Descargar la presentación
La descarga está en progreso. Por favor, espere

1
Estratificación del Riesgo Cardiovascular
Dr. Alejandro Chávez Servicio de Cardiología Hospital General de México

2
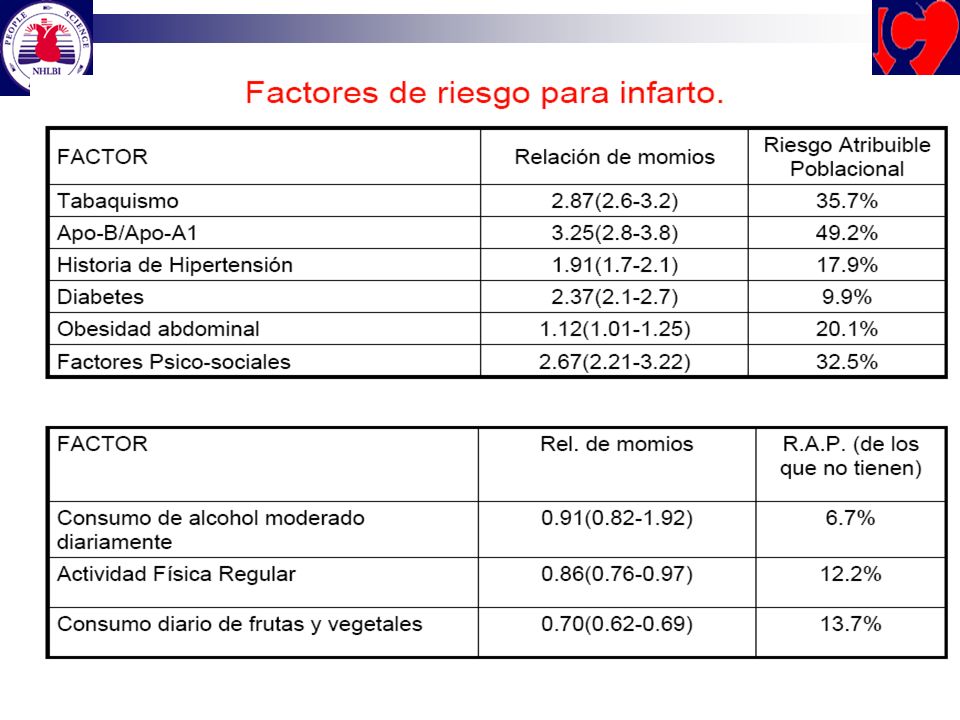
Factores de Riesgo CV Un factor de riesgo es una condición que se encuentra más frecuentemente en una población enferma que en una sana Existen más de 200 FR identificados para ECV 9 FR explican el 90% de las ECV en el mundo

4
Teoría General del Riesgo
Todos estamos en riesgo El factor principal es el paso de los años Todos tenemos factores de riesgo: Hipertensos 30%, prehipertensos 66% Sobrepeso 40%, obesos 24% Niveles inadecuados de lípidos 85% Diabéticos 11% S. metabólico 27% Fumadores 35% Sedentarismo 55%

5
Como predecir en una persona asintomática, quién y que tan cercano está de padecer enfermedad CV
Detectando objetivamente la presencia de aterosclerosis asintomática Calculando su riesgo a través de estudiar los factores presentes En forma aislada Combinados Global

6
Factores de Riesgo CV HF ECV 55 años y 65 años
EDAD 55 años ó 65 años Tabaquismo Cintura: 90 cm y 80 cm Sedentarismo 20 minutos diarios PA 140/90 mm Hg Dislipidemia [ CT 200, LDL HDL ] Glucosa preprandial anormal [ mg/dl]

8
Estratificación del Riesgo
La manera más práctica y objetiva de calcular el Riesgo Global es con métodos a partir de datos epidemiológicos derivados de: Framingham Heart Study PROCAM SCORE

9
El riesgo a 10 años se califica de la siguiente manera
Para enfermedad coronaria: FRAMINGHAM ó PROCAM Para muerte coronaria: SCORE Bajo 10% Mediano: 10-19% Alto: 20-30% Muy Alto: 30% Bajo: 2% Mediano: 2-5 % Alto: 5%

10
Pirámide de Riesgo Cardiovascular
(Framingham) Enfermedad coronaria DM Riesgo muy alto (30% a 10 años) SICA Angina DM Enfermedad vascular en otro territorio Riesgo alto (20% a 10 años Aterosclerosis Subclínica Síndrome metabólico 2 Factores de riesgo Riesgo moderado ( de 10-19%) Riesgo bajo (10% a 10 año) 2 Factores de riesgo
 Enfermedad coronaria DM. Riesgo muy alto. (30% a 10 años) SICA. Angina. DM. Enfermedad vascular en. otro territorio. Riesgo alto. (20% a 10 años. Aterosclerosis Subclínica. Síndrome metabólico. 2 Factores de riesgo. Riesgo moderado. ( de 10-19%) Riesgo bajo. (10% a 10 año) 2 Factores. de riesgo.")
11
ECV en México Más de 30 millones de mexicanos
60.5 % de los adultos mexicanos tiene al menos 1 factor de riesgo cardiovascular (hipertensión arterial, dislipidemia, diabetes, tabaquismo, obesidad) Más de 30 millones de mexicanos Hacer notar a la audiencia el elevado número de mexicanos con factores de riesgo cardiovascular Velázquez O, Rosas M, Lara A. Arch Inst Cardiol Mex 2002; 72:
 Más de 30 millones de mexicanos. Hacer notar a la audiencia el elevado número de mexicanos con factores de riesgo cardiovascular. Velázquez O, Rosas M, Lara A. Arch Inst Cardiol Mex 2002; 72:")
12
Definiciones RIESGO: Es la probabilidad que tiene un individuo de desarrollar ECV fatal o no fatal en un determinado tiempo y se calcula por medio de la evaluación y análisis de los factores de riesgo cardiovascular FACTOR DE RIESGO CARDIOVASCULAR: Es una característica que se encuentra con más frecuencia en individuos con ECV en comparación a los que no la padecen y que señala una probabilidad mayor de desarrollar enfermedad cardiovascular

13
Riesgo Cardiovascular
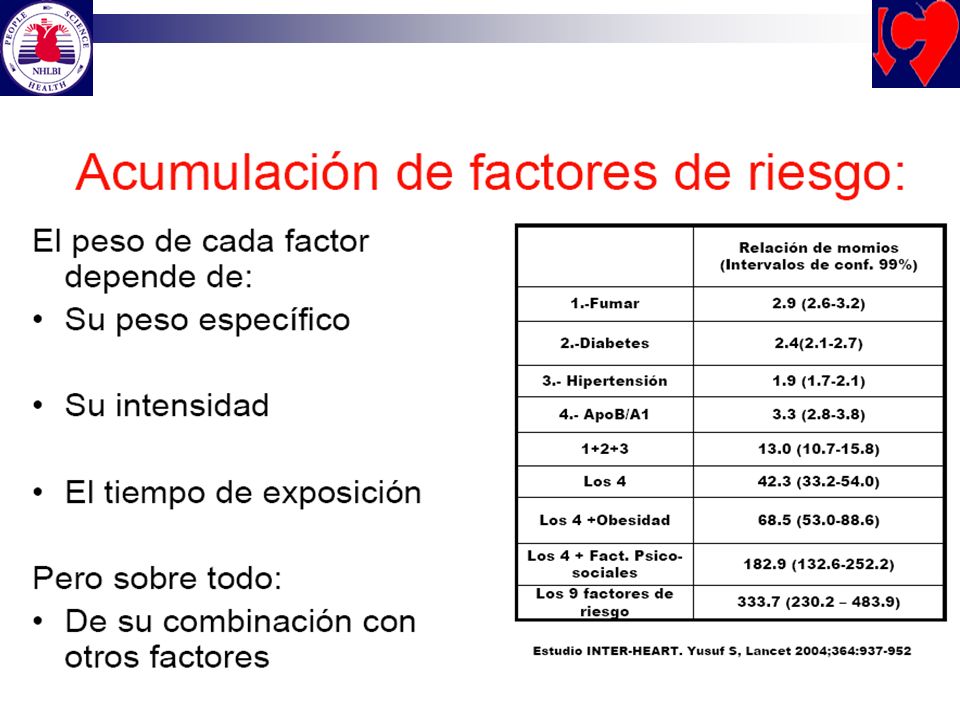
The Framingham Study ( ) Escala acumulativa (Probabilidad a 8 años) Riesgo Cardiovascular 15 Tabaquismo 10 Diabetes Veces 5 Dislipidemia Hipertensión 1 Vez 3.5 Veces 6.5 Veces 8.4 Veces
 Escala acumulativa (Probabilidad a 8 años) Riesgo Cardiovascular. 15. Tabaquismo. 10. Diabetes. Veces. 5. Dislipidemia. Hipertensión. 1 Vez. 3.5 Veces. 6.5 Veces. 8.4 Veces.")
14
CALCULO DEL RIESGO: SCORE DE FRAMINGHAM

15
Evaluación Global de Riesgo – 2001
Escala acumulativa a 10 años para riesgo de CI en hombres y mujeres (Framingham point scores) 3.09 CI = IM ó muerte coronaria Edad 20-34 = -9/-7 35-39 = -4/-3 40-44 = 0/0 45-49 = 3/3 50-54 = 6/6 55-59 = 8/8 60-64 = 10/10 65-69 = 11/12 70-74 = 12/14 75-79 = 13/16 CT ( años) <160 = 0/0 = 3/3 = 5/6 = 6/8 >280 = 8/10 Presión arterial sistólica Tratada: No Sí <120 = 0/ /0 = 0/ /3 = 1/ /4 = 1/ /5 160 = 2/ /6 CT ( años) = 2/2 = 3/4 = 4/5 280 = 5/7 HDL-C >60 = -1/-1 50-59 = 0/0 40-49 = 1/1 <40 = 2/2 Fumador ( años) No = 0/0 Sí = 8/9 (40-49 años) Sí = 5/7 ( años) Sí = 3/4 Global Risk Assessment – 2001 Data from the Framingham Heart Study provided a method for calculating a patient’s global risk based on multiple risk factors. Risk is calculated from a patient’s gender, age, TC, HDL-C, systolic blood pressure, and smoking status. TC is used instead of LDL-C because the Framingham database is larger and thus statistically more robust for this value. Risk from TC and smoking are age-dependent, decreasing over time as shown. Values for all ages can be found in the Executive Summary of the NCEP ATP III report. If a person is on antihypertensive therapy, an extra point(s) is added because treated hypertension carries residual risk. The designation “smoker” applies if any cigarettes have been smoked in the last month. The points assigned from each of the factors are added and the total used to find the 10-year risk for CHD (MI or coronary death), as shown at the bottom of the chart. If 10-year risk is < 10%, the level for initiation of drug therapy is 160 mg/dL LDL-C. If 10-year risk is 10% or greater, drug therapy should be initiated at 130 mg/dL LDL-C. If the 10-year risk is > 20%, drug therapy should be considered between 100 and 129 mg/dL LDL-C. Wilson PWF, D’Agostino RB, Levy D, Belanger AM, Silbershatz H, Kannel WB. Prediction of coronary heart disease using risk factor categories. Circulation. 1998;97: Expert Panel on Detection, Evaluation, and Treatment of High Blood Cholesterol in Adults. Executive Summary of the National Cholesterol Education Program (NCEP) Expert Panel on Detection, Evaluation, and Treatment of High Blood Cholesterol in Adults (Adult Treatment Panel III). JAMA. 2001;285: Puntos : < 25 Riesgo a 10 años : < 30 < 30 Adapted from NCEP ATP III. JAMA. 2001;285:
 CI = IM ó muerte coronaria. Edad = -9/ = -4/ = 0/ = 3/ = 6/ = 8/ = 10/ = 11/ = 12/ = 13/16. CT ( años) <160 = 0/ = 3/ = 5/ = 6/8. >280 = 8/10. Presión arterial sistólica. Tratada: No Sí. <120 = 0/0 0/ = 0/1 1/ = 1/2 2/ = 1/3 2/5. 160 = 2/4 3/6. CT ( años) = 2/ = 3/ = 4/5. 280 = 5/7. HDL-C. >60 = -1/ = 0/ = 1/1. <40 = 2/2. Fumador. ( años) No = 0/0. Sí = 8/9. (40-49 años) Sí = 5/7. ( años) Sí = 3/4. Global Risk Assessment – Data from the Framingham Heart Study provided a method for calculating a patient’s global risk based on multiple risk factors. Risk is calculated from a patient’s gender, age, TC, HDL-C, systolic blood pressure, and smoking status. TC is used instead of LDL-C because the Framingham database is larger and thus statistically more robust for this value. Risk from TC and smoking are age-dependent, decreasing over time as shown. Values for all ages can be found in the Executive Summary of the NCEP ATP III report. If a person is on antihypertensive therapy, an extra point(s) is added because treated hypertension carries residual risk. The designation smoker applies if any cigarettes have been smoked in the last month. The points assigned from each of the factors are added and the total used to find the 10-year risk for CHD (MI or coronary death), as shown at the bottom of the chart. If 10-year risk is < 10%, the level for initiation of drug therapy is 160 mg/dL LDL-C. If 10-year risk is 10% or greater, drug therapy should be initiated at 130 mg/dL LDL-C. If the 10-year risk is > 20%, drug therapy should be considered between 100 and 129 mg/dL LDL-C. Wilson PWF, D’Agostino RB, Levy D, Belanger AM, Silbershatz H, Kannel WB. Prediction of coronary heart disease using risk factor categories. Circulation. 1998;97: Expert Panel on Detection, Evaluation, and Treatment of High Blood Cholesterol in Adults. Executive Summary of the National Cholesterol Education Program (NCEP) Expert Panel on Detection, Evaluation, and Treatment of High Blood Cholesterol in Adults (Adult Treatment Panel III). JAMA. 2001;285: Puntos : < 25. Riesgo a. 10 años : < 30. < 30. Adapted from NCEP ATP III. JAMA. 2001;285:")
16
Riesgo Coronario Alto Riesgo absoluto 20% en 10 años
Prevención secundaria por aterosclerosis ó aterosclerosisno coronaria, ó DM ó múltiples FR Intermedio Riesgo absoluto 10-20% en 10 años Prevención primaria Bajo Riesgo absoluto < 10% en 10 años

17
PROCAM Score Edad (años) LDL cholesterol (mg/dl) 35-39 0 <100 0
Presión arterial sistólica(mm Hg) < >= Edad (años) LDL cholesterol (mg/dl) < > HDL cholesterol (mg/dl) <35 11 > Fumador No Sí Triglicéridos (mg/dl) < > PROCAM Score This slide shows the scores assigned to each level of the respective risk factor. The total score is calculated by adding together the points for each risk factor. Antec fam de IAM No Sí Diabetes No 0 Sí 6 Assmann, Cullen, Schulte; Circulation, 105: ; 2002
 < >= Edad (años) LDL cholesterol (mg/dl) < > HDL cholesterol (mg/dl) < >54 0. Fumador. No 0. Sí 8. Triglicéridos (mg/dl) < > PROCAM Score. This slide shows the scores assigned to each level of the respective risk factor. The total score is calculated by adding together the points for each risk factor. Antec fam de IAM. No 0. Sí 4. Diabetes. No 0. Sí 6. Assmann, Cullen, Schulte; Circulation, 105: ;")
18
PROCAM Score No. de puntos 20 21 22 23 24 25 26 27 28 29 30 31 32 33
34 Riesgo a 10 años de eventos coronarios agudos (%) 1.0 1.1 1.2 1.3 1.4 1.6 1.7 1.8 1.9 2.3 2.4 2.8 2.9 3.3 3.5 No. de puntos 35 36 37 38 39 40 41 42 43 44 45 46 47 48 49 Riesgo a 10 años de eventos coronarios agudos (%) 4.0 4.2 4.8 5.1 5.7 6.1 7.0 7.4 8.0 8.8 10.2 10.5 10.7 12.8 13.2 No. de puntos 50 51 52 53 54 55 56 57 58 59 60 Riesgo a 10 años de eventos coronarios agudos (%) 15.5 16.8 17.5 19.6 21.7 22.2 23.8 25.1 28.0 29.4 30.0 PROCAM Score – Corresponding global risks For each total score the corresponding global risk for suffering a heart attack or dying from an acute coronary event within the next 10 years can be seen from this slide. This score was derived in men aged years in the PROCAM Study. The number of coronary events which occurred in women during 10 years of follow-up does not yet permit the development of a specific risk prediction algorithm for women. However, analysis based on data from women aged years indicate a 4-fold lesser absolute risk of coronary events in postmenopausal women compared with men of the same age. Therefore, a rough risk prediction for women can be obtained by dividing the global risk estimated for men by 4. Note, that this estimation is only applicable to postmenopausal women years of age. Assmann, Cullen, Schulte; Circulation, 105: ; 2002
 No. de puntos Riesgo a 10 años. de eventos coronarios agudos (%) No. de puntos 60. Riesgo a 10 años. de eventos coronarios agudos (%) PROCAM Score – Corresponding global risks. For each total score the corresponding global risk for suffering a heart attack or dying from an acute coronary event within the next 10 years can be seen from this slide. This score was derived in men aged years in the PROCAM Study. The number of coronary events which occurred in women during 10 years of follow-up does not yet permit the development of a specific risk prediction algorithm for women. However, analysis based on data from women aged years indicate a 4-fold lesser absolute risk of coronary events in postmenopausal women compared with men of the same age. Therefore, a rough risk prediction for women can be obtained by dividing the global risk estimated for men by 4. Note, that this estimation is only applicable to postmenopausal women years of age. Assmann, Cullen, Schulte; Circulation, 105: ;")
19
Algoritmo PROCAM 21.4 7.6 2.8 2.1 0.6 IAM (%) en 10 Años I II III IV V
The PROCAM Algorithm This slide shows the incidence of coronary events occurring within 10 years of follow-up in men aged years in PROCAM, divided into fifths (quintiles) using a cox proportional hazards model derived from more than 50 variables measured in each man. The 8 variables listed here each make an independent contribution to risk. Taken together, they allow a more than 30-fold stratification of risk between the lowest and the highest quintile. The lower fifths of this distribution are within the desirable range. We regard the third fifth as indicating a moderate increase in risk and the fourth fifth as indicating a marked increase in risk. The top fifth of this distribution is regarded as being at high risk of myocardial infarction. Allocation of your patients to these quintiles can be performed using the interactive program on this website using this link. I II III IV V Quintiles del Score Variables independientes: edad, PAs, LDL-C, HDL-C, triglicéridos, diabetes mellitus, tabaquismo, antecedentes familiares de IM 325 IAM fatales y no fatales en 4,818 hombres de edades años
 using a cox proportional hazards model derived from more than 50 variables measured in each man. The 8 variables listed here each make an independent contribution to risk. Taken together, they allow a more than 30-fold stratification of risk between the lowest and the highest quintile. The lower fifths of this distribution are within the desirable range. We regard the third fifth as indicating a moderate increase in risk and the fourth fifth as indicating a marked increase in risk. The top fifth of this distribution is regarded as being at high risk of myocardial infarction. Allocation of your patients to these quintiles can be performed using the interactive program on this website using this link. I. II. III. IV. V. Quintiles del Score. Variables independientes: edad, PAs, LDL-C, HDL-C, triglicéridos, diabetes mellitus, tabaquismo, antecedentes familiares de IM. 325 IAM fatales y no fatales en 4,818 hombres de edades años.")
20
PROCAM Score IAM observados (por 1000) en 10años PROCAM score
Estimated and observed risk of myocardial infarction This slide shows the observed incidence of myocardial infarction in 10 years for categories of estimated 10-year risk. Also, the ranges of the PROCAM score corresponding to each estimated risk category are given. The numbers illustrate a good fit between estimated and observed risk. The prevalences given in the last row reveal that 7.5% of the men in the PROCAM cohort had a 10-year risk for myocardial infarction ≥ 20% and a further 15% had a risk between 10 and 20%. PROCAM score Riesgo estimado de IM en 10 años (%) < 40 Prevalencia (%) Assmann, Cullen, Schulte; Circulation, 105: ; 2002
 < 40. Prevalencia (%) Assmann, Cullen, Schulte; Circulation, 105: ;")
21
Score de Reynolds Incorpora 2 parámetros adicionales: PCRus
Antecedentes familiares IAM 60 años de edad

Presentaciones similares


>")


