Descargar la presentación
La descarga está en progreso. Por favor, espere

1
DIABETES MELLITUS TIPO 2
Dr. Pablo Robles Vergara Profesor de Medicina Interna Coordinador CIHTA

2
2025 Casos totales = 300 millones de adultos
“Alarmante tendencia a la elevación” de diabetes–prevalencia desde 1997 a 2025 2025 Casos totales = 300 millones de adultos 1997 Total cases = 143 million adults NOTE: This slide contains animation to show the change in diabetes prevalence from 1997 to 2025 – activated via one mouse-click. The World Health Report in 1998 from the World Health Organisation (WHO) noted an “alarming upward trend” in diabetes. WHO believes that population ageing, unhealthy diets, obesity and a sedentary lifestyle are the main factors that explain this rise and predicts that diabetes cases in adults will more than double globally from 143 million in 1997 to 300 million by 2025 largely because of dietary and other lifestyle factors. In general, non-communicable diseases such as diabetes are more common than infectious diseases in the industrialised world. Reference World Health Organisation. The World Health Report: life in the 21st century, a vision for all. Geneva: WHO, 1998 Número de personas No datos disponibles World Health Organisation. The World Health Report: life in the 21st century, a vision for all. Geneva: WHO, 1998
 noted an alarming upward trend in diabetes. WHO believes that population ageing, unhealthy diets, obesity and a sedentary lifestyle are the main factors that explain this rise and predicts that diabetes cases in adults will more than double globally from 143 million in 1997 to 300 million by 2025 largely because of dietary and other lifestyle factors. In general, non-communicable diseases such as diabetes are more common than infectious diseases in the industrialised world. Reference. World Health Organisation. The World Health Report: life in the 21st century, a. vision for all. Geneva: WHO, Número de personas. No datos disponibles. World Health Organisation. The World Health Report: life in the 21st century, a vision for all. Geneva: WHO,")
3
Diabetes tipo 2 es una trastorno heterogéneo
Caracterizado por 2 defectos fundamentales Resistencia Disfunción = Diabetes Insulina célula Beta2,3 tipo 2 Parte del Síndrome Resistencia a la Insulina 4 (un grupo de alteración metabólica) Type 2 diabetes is a heterogeneous disorder, requiring impairment of both insulin action (insulin resistance) and insulin secretion (beta-cell dysfunction). The disease has a long development and symptoms may not be noticeable during the early stages of the disease. Insulin resistance represents the preliminary defect in most patients with type 2 diabetes.1 The body compensates for this decreased sensitivity by secreting more insulin. Eventually, beta-cell failure may ensue2,3 leading to the development of overt diabetes.4 Type 2 diabetes forms part of a cluster of CV risk factors known as the ‘Insulin Resistance Syndrome’ or ‘Metabolic Syndrome’.5 References 1. Groop LC. Diabetes Obes Metab 1999; 1 (Suppl 1): S1-S7. 2. UK Prospective Diabetes Study Group. UK prospective diabetes study 16. Diabetes 1995; 44: 3. Alberti KGMM. Diabetes Obes Metab 2001; 3 (Suppl 1): S3-S10. 4. DeFronzo RA, Bonadonna RC, Ferrannini E. Diabetes Care 1992; 15: 5. Reaven. Phys Rev 1995; 75: 1. Groop LC. Diabetes Obes Metab 1999; 1 (Suppl 1): S1-S7 2. UK Prospective Diabetes Study Group. UK prospective diabetes study 16. Diabetes 1995; 44: 3. Alberti KGMM. Diabetes Obes Metab 2001; 3 (Suppl 1): S3-S10 4. Reaven. Phys Rev 1995; 75: 66-79
 Type 2 diabetes is a heterogeneous disorder, requiring impairment of both insulin action (insulin resistance) and insulin secretion (beta-cell dysfunction). The disease has a long development and symptoms may not be noticeable during the early stages of the disease. Insulin resistance represents the preliminary defect in most patients with type 2 diabetes.1 The body compensates for this decreased sensitivity by secreting more insulin. Eventually, beta-cell failure may ensue2,3 leading to the development of overt diabetes.4. Type 2 diabetes forms part of a cluster of CV risk factors known as the ‘Insulin Resistance Syndrome’ or ‘Metabolic Syndrome’.5. References. 1. Groop LC. Diabetes Obes Metab 1999; 1 (Suppl 1): S1-S7. 2. UK Prospective Diabetes Study Group. UK prospective diabetes study 16. Diabetes 1995; 44: Alberti KGMM. Diabetes Obes Metab 2001; 3 (Suppl 1): S3-S DeFronzo RA, Bonadonna RC, Ferrannini E. Diabetes Care 1992; 15: Reaven. Phys Rev 1995; 75: Groop LC. Diabetes Obes Metab 1999; 1 (Suppl 1): S1-S7. 2. UK Prospective Diabetes Study Group. UK prospective diabetes study 16. Diabetes 1995; 44: Alberti KGMM. Diabetes Obes Metab 2001; 3 (Suppl 1): S3-S Reaven. Phys Rev 1995; 75:")
5
Fisiopatología de diabetes tipo 2
Estómago Tejido Adiposo I Carbohidrato Glucosa (G) Excesiva liberación de ácidos grasos Intestino G I Resistencia a la acción de insulina Secreción defectuosa de insulina I G Insulina (I) G G I Pancreas I G G G I Captación ineficiente de glucosa I G Músculo NOTE: This slide contains animation – activated via one mouse-click. The abnormal glucose metabolism observed in type 2 diabetes involves a number of different organs. Impaired beta-cell function at the pancreas is a common defect in established type 2 diabetes. The overproduction of glucose by the liver as a result of insulin resistance is also a characteristic trait. Furthermore, insulin resistance at the adipose tissues can affect glucose uptake at the tissue and also causes excess fatty acid release, which further increases hepatic glucose output. Insulin resistance also affects the skeletal muscle, in which 80 to 90% of insulin-stimulated glucose uptake occurs. This uptake is attenuated in patients with type 2 diabetes. Stimulation of glucose metabolism by insulin requires that the hormone must first bind to specific receptors on the surface of all insulin-target tissues. In type 2 diabetes, both insulin receptor and post-receptor defects have been shown to contribute to insulin resistance. Reference DeFronzo RA, Bonadonna RC, Ferrannini E. Diabetes Care 1992; 15: G I I Exceso producción de glucosa G I G G Hígado I: insulina G: glucosa
 Excesiva liberación de ácidos grasos. Intestino. G. I. Resistencia a la acción de insulina. Secreción defectuosa de insulina. I. G. Insulina (I) G. G. I. Pancreas. I. G. G. G. I. Captación ineficiente de glucosa. I. G. Músculo. NOTE: This slide contains animation – activated via one mouse-click. The abnormal glucose metabolism observed in type 2 diabetes involves a number of different organs. Impaired beta-cell function at the pancreas is a common defect in established type 2 diabetes. The overproduction of glucose by the liver as a result of insulin resistance is also a characteristic trait. Furthermore, insulin resistance at the adipose tissues can affect glucose uptake at the tissue and also causes excess fatty acid release, which further increases hepatic glucose output. Insulin resistance also affects the skeletal muscle, in which 80 to 90% of insulin-stimulated glucose uptake occurs. This uptake is attenuated in patients with type 2 diabetes. Stimulation of glucose metabolism by insulin requires that the hormone must first bind to specific receptors on the surface of all insulin-target tissues. In type 2 diabetes, both insulin receptor and post-receptor defects have been shown to contribute to insulin resistance. Reference. DeFronzo RA, Bonadonna RC, Ferrannini E. Diabetes Care 1992; 15: G. I. I. Exceso producción de glucosa. G. I. G. G. Hígado. I: insulina G: glucosa.")
6
Resistencia a la Insulina y secreción baja de insulina son causas fundamentales de diabetes tipo 2
15.9% Ninguno 1.5% Ambas 54% Haffner SM et al1 examined the incidence of type 2 diabetes by insulin resistance and insulin secretion. This 7-year follow-up of the San Antonio Heart Study2 used the homeostatic model of insulin resistance (HOMA IR) as a measure of insulin resistance and I30-0/ G30-0 as a measure of insulin secretion (early secretory response to a glucose load). The formula for the HOMA IR model follows: HOMA IR = fasting insulin (μU/ml) X fasting glucose (mmol/l) 22.5 Categorisation of insulin resistance was based on a HOMA IR above and below the median for the overall non-diabetic population at baseline. Insulin secretion was based on a I30-0/ G30-0 above and below the median for the non-diabetic population.1 Reference 1. Haffner SM et al. Circulation 2000; 101: 2. Haffner SM et al. Diabetes 1995; 44: Resistencia a la insulina 28.7% n=195 Adapted from Haffner SM et al. Circulation 2000; 101: 975–980
 as a measure of insulin resistance and I30-0/ G30-0 as a measure of insulin secretion (early secretory response to a glucose load). The formula for the HOMA IR model follows: HOMA IR = fasting insulin (μU/ml) X fasting glucose (mmol/l) Categorisation of insulin resistance was based on a HOMA IR above and below the median for the overall non-diabetic population at baseline. Insulin secretion was based on a I30-0/ G30-0 above and below the median for the non-diabetic population.1. Reference. 1. Haffner SM et al. Circulation 2000; 101: Haffner SM et al. Diabetes 1995; 44: Resistencia a la insulina. 28.7% n=195. Adapted from Haffner SM et al. Circulation 2000; 101: 975–980.")
8
Progresión de diabetes tipo 2
Genética Resistencia Insulina Ambiental Hiperinsulinemia Resistencia a insulina Compensada Tolerancia de glucosa Normal Alteración Tolerancia Glucosada (IGT) Genética Ambiental Type 2 diabetes usually remains undiagnosed for 4-7 years in the majority of patients due to the relative lack of symptoms in the earlier stages of the disease. Insulin resistance The development of insulin resistance is considered to be the primary initiating factor in the progression to type 2 diabetes. This inability in the body’s ability to respond to insulin may be predetermined by genetic defects and also influenced by environmental factors such as obesity and a sedentary lifestyle. Genetic factors include the background genome, a reduced insulin receptor count and a reduced ability of insulin to stimulate post-receptor signalling. Intracellular glucose transporters (GLUT), responsible for transmembrane glucose transport, may also be implicated resulting in impaired translocation of glucose from the circulation into cells. Furthermore, metabolic inefficiency (obesity), which may be both a genetic and environmental factor, is associated with elevated free fatty acid levels that cause peripheral and hepatic insulin resistance. Environmental factors include obesity, diet, lifestyle, age, stress, hormones, drugs, chronic infections and other diseases. Beta-cell dysfunction The pancreas is able to compensate for the effects of insulin resistance by increasing insulin secretion and glucose tolerance remains normal. However, high levels of insulin secretion in the long term eventually causes beta-cell dysfunction and the pancreas can no longer maintain its high secretion rate. Like insulin resistance, there may be both genetic and environmental factors that control the development of beta-cell dysfunction. Genetic factors include beta-cell mass, division, apoptosis, neogenesis’ expression of factors controlling insulin biosynthesis/secretion and environmental factors include neonatal and adult diet, infections and exocrine pancreatic disease. Beta-cell number is a critical determinant of the amount of insulin that is secreted by the pancreas. Patients with well established type 2 diabetes have been demonstrated to have a modest reduction (20-40%) in beta-cell mass that contributes to the loss of beta-cell function.1 However, a >80-90% decrease in beta-cell mass is required before sufficient insulinopenia develops to cause overt diabetes. It is therefore likely that other factors, in addition to beta-cell loss, must be responsible for the impaired insulin secretion observed in beta-cell dysfunction. This failure eventually leads to the development of frank diabetes and its associated microvascular and macrovascular complications. Reference 1. DeFronzo RA, Bonadonna RC, Ferrannini E. Diabetes Care 1992; 15: Disfunción célula Enfermedad Micro- & macrovascular Diabetes tipo 2 Hiperglicemia Adapted from Edelman S. Type II Diabetes Mellitus. Advances in Internal Medicine vol 43: Mosby Year Book 1998:
 Genética. Ambiental. Type 2 diabetes usually remains undiagnosed for 4-7 years in the majority of patients due to the relative lack of symptoms in the earlier stages of the disease. Insulin resistance. The development of insulin resistance is considered to be the primary initiating factor in the progression to type 2 diabetes. This inability in the body’s ability to respond to insulin may be predetermined by genetic defects and also influenced by environmental factors such as obesity and a sedentary lifestyle. Genetic factors include the background genome, a reduced insulin receptor count and a reduced ability of insulin to stimulate post-receptor signalling. Intracellular glucose transporters (GLUT), responsible for transmembrane glucose transport, may also be implicated resulting in impaired translocation of glucose from the circulation into cells. Furthermore, metabolic inefficiency (obesity), which may be both a genetic and environmental factor, is associated with elevated free fatty acid levels that cause peripheral and hepatic insulin resistance. Environmental factors include obesity, diet, lifestyle, age, stress, hormones, drugs, chronic infections and other diseases. Beta-cell dysfunction. The pancreas is able to compensate for the effects of insulin resistance by increasing insulin secretion and glucose tolerance remains normal. However, high levels of insulin secretion in the long term eventually causes beta-cell dysfunction and the pancreas can no longer maintain its high secretion rate. Like insulin resistance, there may be both genetic and environmental factors that control the development of beta-cell dysfunction. Genetic factors include beta-cell mass, division, apoptosis, neogenesis’ expression of factors controlling insulin biosynthesis/secretion and environmental factors include neonatal and adult diet, infections and exocrine pancreatic disease. Beta-cell number is a critical determinant of the amount of insulin that is secreted by the pancreas. Patients with well established type 2 diabetes have been demonstrated to have a modest reduction (20-40%) in beta-cell mass that contributes to the loss of beta-cell function.1 However, a >80-90% decrease in beta-cell mass is required before sufficient insulinopenia develops to cause overt diabetes. It is therefore likely that other factors, in addition to beta-cell loss, must be responsible for the impaired insulin secretion observed in beta-cell dysfunction. This failure eventually leads to the development of frank diabetes and its associated microvascular and macrovascular complications. Reference. 1. DeFronzo RA, Bonadonna RC, Ferrannini E. Diabetes Care 1992; 15: Disfunción célula Enfermedad Micro- & macrovascular. Diabetes tipo 2. Hiperglicemia. Adapted from Edelman S. Type II Diabetes Mellitus. Advances in Internal Medicine vol 43: Mosby Year Book 1998:")
11
Resistencia a la Insulina
- Causas subyacentes de diabetes tipo 2 - Vínculo con la enfermedad cardiovascular

12
Qué es resistencia a la insulina?
Una respuesta biológica alterada a la insulina1 Defecto primario en pacientes con diabetes tipo 22 Resistencia a la Insulina, combinada con hiperinsulinemia, es un fuerte predictor del desarrollo de diabetes tipo 23 Razón fundamental asociada a los factores de riesgo CV colectivamente se conocen como el Síndrome de Resistencia a la insulina4 Fisiopatología ambiental y genética In some patients, there can be defects in the sensitivity of tissues to the action of insulin which can affect glucose homeostasis. Insulin sensitivity varies greatly within the general population and impaired sensitivity to insulin, ie insulin resistance, may lead to IGT and eventually to the development of type 2 diabetes. Insulin resistance is also an integral component in the Insulin Resistance Syndrome, in which hypertension, dyslipidaemia and other metabolic conditions form a cluster of risk factors for cardiovascular disease. 1. American Diabetes Association. Diabetes Care 1998; 21: 310–314 2. Beck-Nielsen H, Groop LC. J Clin Invest 1994; 94: 1714–1721 3. Bloomgarden ZT. Clin Ther 1998; 20: 216–231 4. Reaven. Phys Rev 1995; 75:

13
Sindrome de Resistencia a la insulina
Obesidad central < Actividad Fisica Microalbuminuria Inflamación Cronica > proinsulina LDL pequeno denso Activacion plaquetaria Hiperinsulinemia Resistencia a la insulina > fibronogeno > PAI -1 > Triglcieridos HTA > HDL Intolernacia a glucosa Diabetes Mellitus Microalbuminuria Adapted from DeFronzo. Diabetes Care 1991; 14:

15
Número de alteraciones metabólicas
Prevalencia de resistencia a la insulina asociada a alteraciones metabólicas 100 27% 43% 59% 80% 95% 80 60 Prevalencia de resistencia a la insulina HOMA (%) 40 20 This population-based study1 assessed the prevalence rate of insulin resistance in subjects with impaired glucose tolerance (IGT), type 2 diabetes, dyslipidaemia, hyperuricaemia and hypertension. The study comprised an age- and sex-stratified random sample of the general population (n=888; aged years) and insulin resistance was estimated by homeostasis model assessment (HOMAIR)*, which was preliminarily validated against a euglycaemic-hyperinsulinaemic clamp in 83 subjects. Insulin resistance had a frequency proportional (p<0.001) to the number of metabolic abnormalities clustering within the same individual. This was observed in both men and women, in younger and older subjects, and in normal-weight and overweight individuals. The prevalence of insulin resistance in subjects with the combination of glucose intolerance (IGT or type 2 diabetes), dyslipidaemia (hypercholesterolaemia and/or hypertriglyceridaemia and/or low HDL cholesterol), hyperuricaemia and hypertension (n=21) was 95.2%. In a further analysis of 1,326 patients with type 2 diabetes, Bonora E et al concluded that homeostasis model assessment-estimated insulin resistance (HOMA-IR)* is an independent predictor of cardiovascular disease (CVD) in type 2 diabetes. Therefore, the improvement of insulin resistance might have beneficial effects not only on glucose control but also on CVD in patients with type 2 diabetes.2 *HOMAIR is a method of estimating insulin resistance using computer-aided modelling of fasting glucose and insulin concentrations. Reference 1. Bonora E et al. Diabetes 1998; 47: 1643–1649. 2. Bonora E et al. Diabetes Care 2002; 25: 1135–1141. 1 2 3 4 Número de alteraciones metabólicas Alteraciones metabólicas: intolerancia a la glucosa, dislipidemia, hiperuricemia y/o hipertensión p<0.001 para diferencias en la tasa de prevalencia a través de las categorías Bonora E et al. Diabetes 1998; 47:
 This population-based study1 assessed the prevalence rate of insulin resistance in subjects with impaired glucose tolerance (IGT), type 2 diabetes, dyslipidaemia, hyperuricaemia and hypertension. The study comprised an age- and sex-stratified random sample of the general population (n=888; aged years) and insulin resistance was estimated by homeostasis model assessment (HOMAIR)*, which was preliminarily validated against a euglycaemic-hyperinsulinaemic clamp in 83 subjects. Insulin resistance had a frequency proportional (p<0.001) to the number of metabolic abnormalities clustering within the same individual. This was observed in both men and women, in younger and older subjects, and in normal-weight and overweight individuals. The prevalence of insulin resistance in subjects with the combination of glucose intolerance (IGT or type 2 diabetes), dyslipidaemia (hypercholesterolaemia and/or hypertriglyceridaemia and/or low HDL cholesterol), hyperuricaemia and hypertension (n=21) was 95.2%. In a further analysis of 1,326 patients with type 2 diabetes, Bonora E et al concluded that homeostasis model assessment-estimated insulin resistance (HOMA-IR)* is an independent predictor of cardiovascular disease (CVD) in type 2 diabetes. Therefore, the improvement of insulin resistance might have beneficial effects not only on glucose control but also on CVD in patients with type 2 diabetes.2. *HOMAIR is a method of estimating insulin resistance using computer-aided. modelling of fasting glucose and insulin concentrations. Reference. 1. Bonora E et al. Diabetes 1998; 47: 1643– Bonora E et al. Diabetes Care 2002; 25: 1135– Número de alteraciones metabólicas. Alteraciones metabólicas: intolerancia a la glucosa, dislipidemia, hiperuricemia y/o hipertensión p<0.001 para diferencias en la tasa de prevalencia a través de las categorías. Bonora E et al. Diabetes 1998; 47:")
16
Prevalencia de resistencia a la insulina en alteraciones metabólicas
100 80 60 Prevalencia de resistencia a la insulina (%) 40 20 TGI Hiperuricemia Hipertensión Población General Diabetes Tipo 2 Hipercolesterolemia Hipertrigliceridemia Bajo HDL colesterol Adapted from Bonora E et al. Diabetes 1998; 47:
 TGI. Hiperuricemia. Hipertensión. Población General. Diabetes Tipo 2. Hipercolesterolemia. Hipertrigliceridemia. Bajo HDL colesterol. Adapted from Bonora E et al. Diabetes 1998; 47:")
17
Estudio Cardíaco de Framingham: riesgo de Enfermedad CV en pacientes con o sin diabetes
Cualquier evento CV * * ACV Claudicación Intermitente † * † Insuficiencia cardíaca * Hombres EC † ‡ Mujeres IM ‡ * Angina pectoris Muerte súbita N/A Epidemiological research from the Framingham Heart Study has shown that diabetes predisposed subjects to all of the major atherosclerotic diseases and coronary heart disease was the most common and most lethal. The chart shows the age-adjusted relative risk of clinical manifestations of cardiovascular disease (CVD) for diabetics versus non-diabetics (16-year follow up after the 10th biennial examination of the Framingham Cohort Study). It is based on 554 men (46 with diabetes) and 760 women (43 with diabetes) who were free of CVD at exam 10. The risk for individuals without diabetes is represented by the broken line at a risk ratio of 1. It is clearly noticeable that the risk of CV disease is greater for those with diabetics compared to those without. For men with diabetes, the age-adjusted risk ratio of coronary heart disease is 1.73 compared to individuals without diabetes (p<0.05) and for women it is 2.5 (p<0.01). No data were available for sudden death in women. Reference Kannel WB et al. Am Heart J 1990; 120: Mortalidad Coronaria † † 1 2 3 4 5 6 Relación de riesgo ajustada a la edad (1 = riesgo de individuos sin diabetes) Adapted from Kannel WB et al. Am Heart J 1990; 120: *p<0.001; †p<0.05; ‡p<0.01; §p<0.1 (p values vs non-diabetics)
 for diabetics versus non-diabetics (16-year follow up after the 10th biennial examination of the Framingham Cohort Study). It is based on 554 men (46 with diabetes) and 760 women (43 with diabetes) who were free of CVD at exam 10. The risk for individuals without diabetes is represented by the broken line at a risk ratio of 1. It is clearly noticeable that the risk of CV disease is greater for those with diabetics compared to those without. For men with diabetes, the age-adjusted risk ratio of coronary heart disease is 1.73 compared to individuals without diabetes (p<0.05) and for women it is 2.5 (p<0.01). No data were available for sudden death in women. Reference. Kannel WB et al. Am Heart J 1990; 120: Mortalidad Coronaria. † † Relación de riesgo ajustada a la edad. (1 = riesgo de individuos sin diabetes) Adapted from Kannel WB et al. Am Heart J 1990; 120: *p<0.001; †p<0.05; ‡p<0.01; §p<0.1 (p values vs non-diabetics)")
18
Disfunción Endotelial
Defecto primario en el proceso de aterosclerosis Reportado en pre-diabéticos individuales y se cree que contribuye a microangiopatía asociada a diabetes tipo 2 Células endoteliales son sensibles a insulina Estrechamente asociada con el Síndrome de Resistencia a la Insulina Puede ser evaluada a través de la determinación de microalbuminuria (significativa permeabilidad vascular anormal) o reactividad vascular
 o reactividad vascular.")
19
Disfunción Endotelial se correlaciona con la resistancia a la insulina
12 Control (n=9) Diabetes (n=9) 10 Hipertensión (n=9) r=0.46, p<0.05 8 Sensibilidad a la insulina en el cuerpo entero (MCR; ml/kg/min) 6 4 This study examined the relationship between insulin action and endothelial function in male patients with type 2 diabetes (n=9), hypertension (n=9) with healthy control subjects (n=9). Whole-body insulin sensitivity (MCR) by hyperinsulinaemic clamp technique and forearm vasoreactivity were measured. When data from the 3 groups were pooled and plotted, there was no evidence of group clustering and there was a significant positive association (r= 0.46, p<0.05) between the vascular and metabolic effects of insulin. Reference Cleland SJ et al. Hypertension 2000; 35: 507–511 2 –20 20 40 60 Vasoreactividad (% cambio en la velocidad del flujo de sangre a través del antebrazo) Cleland SJ et al. Hypertension 2000; 35:
 Diabetes (n=9) 10. Hipertensión (n=9) r=0.46, p< Sensibilidad a la insulina en el cuerpo entero (MCR; ml/kg/min) This study examined the relationship between insulin action and endothelial function in male patients with type 2 diabetes (n=9), hypertension (n=9) with healthy control subjects (n=9). Whole-body insulin sensitivity (MCR) by hyperinsulinaemic clamp technique and forearm vasoreactivity were measured. When data from the 3 groups were pooled and plotted, there was no evidence of group clustering and there was a significant positive association (r= 0.46, p<0.05) between the vascular and metabolic effects of insulin. Reference. Cleland SJ et al. Hypertension 2000; 35: 507– – Vasoreactividad (% cambio en la velocidad del flujo de sangre a través del antebrazo) Cleland SJ et al. Hypertension 2000; 35:")
20
Marcadores de Riesgo Aterogénico asociado con la resistencia a insulina
Obesidad Abdominal WHR, FFA, TNF, Resistina Dislipidemia FFA, Trigliceridos, LDL pequeña densidad HDL, LDL grandes menos densos Hipertensión Presión arterial Inflamación Proteína C reactiva, matrix metaloproteinasa-9 Estress Oxidativo LDLs Oxidadas y F2-isoprostanos Disfunción Endotelial PAI-1, Moléculas de adhesión celular Coagulación Fibrinógeno, PAI-1, tPa Hiperglicemia AGEs, Circulación de derivados AGE Hiperinsuliniemia Insulina plasmática (pre- y diabetes precoz) Microalbuminuria Excreción albumina urinaria A number of atherogenic risk markers associated with the Insulin Resistance Syndrome are now recognised. These components jointly contribute to reduced vascular reactivity1 and therefore the development and progression of atherosclerosis. IRAS (Insulin Resistance Atherosclerosis Study) reported a positive association between insulin resistance and CRP levels in non-diabetic individuals and also noted a positive association between insulin resistance and the intimal-medial thickness of the carotid artery wall, which is an indicator of atherosclerosis.2 WHR (waist-hip ratio): This is a measure of visceral obesity. An increased ratio is an indicator of greater risk of heart disease. FFA (free fatty acids): Plasma free fatty acids play important physiological roles in skeletal muscle, heart, liver and pancreas. Plasma FFA levels may affect both insulin resistance and insulin secretion.3 TNF (tumour necrosis factor alpha): This cytokine plays a key role in mediating pathological inflammation. It is known to exert a variety of catabolic effects that may impair cellular insulin action, increase lipolysis and inhibit glucose transporter 4 (GLUT4) expression. TG (triglycerides), LDL (low density lipoprotein), HDL (high density lipoprotein): These are forms of cholesterol. CRP (C-reactive protein): This is a marker of systemic inflammation. MMP-9 (matrix metalloproteinase-9): Matrix metalloproteinases are a family of membrane-bound zinc-endopeptidases. These enzymes can degrade all of the components of the extracellular matrix. PAI-1 (plasminogen activator inhibitor-1): PAI-1 is a major regulator of plasminogen activation and plays an important role in blood clotting. tPa (tissue plasminogen activating factor): t-Pa is involved in the blood-clotting process. It triggers the conversion of plasminogen to plasmin, which is the principle effector of fibrinolysis. AGE (advanced glycation endproduct): These ligands bind to Receptors for Advanced Glycation End Products (RAGE) that are located on the surface of cells. RAGE may play a role in the development of diabetic complications. References 1. Ross R. N Engl J Med 1999; 340: 115–126. 2. Festa A et al. Circulation 2000; 102: 42–47. 3. Boden G, Shulman GI. Eur J Clin Invest 2002; 32 (Suppl 3): WHR: relación cintura -cadera FFA: ácidos grasos libres TNF: factor necrosis tumoral LDL: lipoproteina de baja densidad HDL: lipoproteina de alta densidad PAI-1: factor-1 activador plasminógeno tPa: activador plasminógeno tisular AGE: avanzada glicación producto final Adapted from Ross R. N Engl J Med 1999; 340: and Festa A et al. Circulation 2000; 102: 42-47
 Microalbuminuria. Excreción albumina urinaria. A number of atherogenic risk markers associated with the Insulin Resistance Syndrome are now recognised. These components jointly contribute to reduced vascular reactivity1 and therefore the development and progression of atherosclerosis. IRAS (Insulin Resistance Atherosclerosis Study) reported a positive association between insulin resistance and CRP levels in non-diabetic individuals and also noted a positive association between insulin resistance and the intimal-medial thickness of the carotid artery wall, which is an indicator of atherosclerosis.2. WHR (waist-hip ratio): This is a measure of visceral obesity. An increased ratio is an indicator of greater risk of heart disease. FFA (free fatty acids): Plasma free fatty acids play important physiological roles in skeletal muscle, heart, liver and pancreas. Plasma FFA levels may affect both insulin resistance and insulin secretion.3. TNF (tumour necrosis factor alpha): This cytokine plays a key role in mediating pathological inflammation. It is known to exert a variety of catabolic effects that may impair cellular insulin action, increase lipolysis and inhibit glucose transporter 4 (GLUT4) expression. TG (triglycerides), LDL (low density lipoprotein), HDL (high density lipoprotein): These are forms of cholesterol. CRP (C-reactive protein): This is a marker of systemic inflammation. MMP-9 (matrix metalloproteinase-9): Matrix metalloproteinases are a family of membrane-bound zinc-endopeptidases. These enzymes can degrade all of the components of the extracellular matrix. PAI-1 (plasminogen activator inhibitor-1): PAI-1 is a major regulator of plasminogen activation and plays an important role in blood clotting. tPa (tissue plasminogen activating factor): t-Pa is involved in the blood-clotting process. It triggers the conversion of plasminogen to plasmin, which is the principle effector of fibrinolysis. AGE (advanced glycation endproduct): These ligands bind to Receptors for Advanced Glycation End Products (RAGE) that are located on the surface of cells. RAGE may play a role in the development of diabetic complications. References. 1. Ross R. N Engl J Med 1999; 340: 115– Festa A et al. Circulation 2000; 102: 42– Boden G, Shulman GI. Eur J Clin Invest 2002; 32 (Suppl 3): WHR: relación cintura -cadera FFA: ácidos grasos libres. TNF: factor necrosis tumoral LDL: lipoproteina de baja densidad. HDL: lipoproteina de alta densidad PAI-1: factor-1 activador plasminógeno. tPa: activador plasminógeno tisular AGE: avanzada glicación producto final. Adapted from Ross R. N Engl J Med 1999; 340: and Festa A et al. Circulation 2000; 102:")
22
Resistencia a la Insulina: Vínculo entre diabetes tipo 2 y ECV
>75% de la mortalidad en diabetes tipo 2 es debido a enfermedad cardiovascular1 Resistencia a la Insulina: Un predictor independiente de ECV2 Se une estrechamente a numerosos de factores de riesgo de enfermedad cardiovascular3 (Síndrome de Resistencia a la Insulina) Puede desarrollarse 2-3 décadas antes del inicio de diabetes tipo 2 4 ~50% de pacientes diagnosticados nuevos demuestran signos de enfermedad cardiovascular5 1. Gray RP, Yudkin JS. In Textbook of Diabetes, Bonora E et al. Diabetes 2000; 49 (Suppl 1): A21 3. Bonora E et al. Diabetes 1998; 47: Beck-Nielsen H & the EGIR. Drugs 1999; 58 (Suppl 1): Laakso M. Int J Clin Pract Suppl 2001; 121: 8-12
 Puede desarrollarse 2-3 décadas antes del inicio de diabetes tipo 2 4 ~50% de pacientes diagnosticados nuevos demuestran signos de enfermedad cardiovascular5. 1. Gray RP, Yudkin JS. In Textbook of Diabetes, Bonora E et al. Diabetes 2000; 49 (Suppl 1): A21 3. Bonora E et al. Diabetes 1998; 47: Beck-Nielsen H & the EGIR. Drugs 1999; 58 (Suppl 1): Laakso M. Int J Clin Pract Suppl 2001; 121:")
23
PAI-1 Elevado predice enfermedad CV
PAI-1 (rango, g/l) 4 3 2 1 5.8 13.6 p=0.002 para la tendencia Riesgo Relativo de infarto al miocardio (comparado con PAI-1 5.8 g/l) The aim of this study was to assess whether plasma levels of PAI-1 could predict the occurrence of a first acute myocardial infarction in a population with high prevalence of coronary heart disease by use of a prospective nested case-control design. 78 subjects developed a first AMI compared with 156 references matched for age, sex and sampling time. High plasma concentrations of PAI-1 were associated with a significantly increased risk of myocardial infarction. References Thögersen AM et al. Circulation 1998; 98: n=234 Thögersen AM et al. Circulation 1998; 98:
 13.6. p=0.002 para la tendencia. Riesgo Relativo de infarto al miocardio. (comparado con PAI-1 5.8 g/l) The aim of this study was to assess whether plasma levels of PAI-1 could predict the occurrence of a first acute myocardial infarction in a population with high prevalence of coronary heart disease by use of a prospective nested case-control design. 78 subjects developed a first AMI compared with 156 references matched for age, sex and sampling time. High plasma concentrations of PAI-1 were associated with a significantly increased risk of myocardial infarction. References. Thögersen AM et al. Circulation 1998; 98: n=234. Thögersen AM et al. Circulation 1998; 98:")
24
PAI-1 es elevado en pacientes diabetes tipo 2
35 * 30 * n=1551 *p<0.001 para todas las comparaciones 25 * PAI-1 antígeno (ng/ml) 20 15 10 This study involved 1551 subjects in whom proinsulin, plasminogen activator inhibitor-1 (PAI-1) and fibrinogen levels were measured. The aim was to investigate the relationship of insulin and its precursors to markers of coagulation and fibrinolysis. Amongst the results obtained, it was shown that plasminogen activator inhibitor-1 (PAI-1) antigen concentrations were significantly different by glucose tolerance status irrespective of sex, age, ethnic group and clinic (p<0.001 for all comparisons between normal glucose tolerance, impaired glucose tolerance and tipo 2 diabetes). Reference Festa A et al. Arterioscler Thromb Vasc Biol 1999; 19: 5 Tolerancia de glucosa normal (n=693) Tolerancia de glucosa aIterada (n=348) Diabetes tipo 2 (n=510) Error barras= SE Adapted from Festa A et al. Arterioscler Thromb Vasc Biol 1999; 19:
 This study involved 1551 subjects in whom proinsulin, plasminogen activator inhibitor-1 (PAI-1) and fibrinogen levels were measured. The aim was to investigate the relationship of insulin and its precursors to markers of coagulation and fibrinolysis. Amongst the results obtained, it was shown that plasminogen activator inhibitor-1 (PAI-1) antigen concentrations were significantly different by glucose tolerance status irrespective of sex, age, ethnic group and clinic (p<0.001 for all comparisons between normal glucose tolerance, impaired glucose tolerance and tipo 2 diabetes). Reference. Festa A et al. Arterioscler Thromb Vasc Biol 1999; 19: Tolerancia de glucosa normal (n=693) Tolerancia de glucosa aIterada (n=348) Diabetes tipo 2 (n=510) Error barras= SE. Adapted from Festa A et al. Arterioscler Thromb Vasc Biol 1999; 19:")
25
(1= riesgo de ECV en individuos en el quintile 1)
Aumento de la resistencia a la insulina asociado a un aumento del riesgo CV San Antonio Heart Study: HOMA-IR y 8 años de riesgo CV (1= riesgo de ECV en individuos en el quintile 1) 5 4 HOMA-IR quintiles 3 2 This study investigated the relationship of the homeostasis model assessment of insulin resistance (HOMA-IR) with risk of cardiovascular disease (CVD) in 2,569 subjects who were free of diabetes at baseline over the 8-year follow-up of the San Antonio Heart Study. Over the follow-up period, 187 subjects experienced and incident cardiovascular event (heart attack, stroke, heart surgery, angina, or CVD death). The risk of CVD event increased across quintiles of HOMA-IR after adjustment for age, sex and ethnicity (p< for trend). Additional adjustment for LDL, triglyceride, HDL, systolic blood pressure, smoking, alcohol consumption, exercise and waist circumference (shown in slide) only modestly reduced the magnitude of these associations (p= for trend). Therefore, there is a significant association between HOMA-IR and risk of CVD after adjustment for multiple covariates. Reference Hanley AJ et al. Diabetes Care 2002; 25: 1 2 3 4 5 Relación de probabilidad del riesgo de ECV (95% IC) Quintile de HOMA-IR ajustado a la edad, sexo, etnicidad, LDL, trigliceridos, HDL, presi´´on arterial sistólica, cigarro, consumo de alcohol, hora de ocio, ejercicio y circunferencia de cintura (mediana) *p= para aumento del riesgo de enfermedad CV a través de quintiles HOMA-IR Hanley AJ et al. Diabetes Care 2002; 25:
 HOMA-IR quintiles This study investigated the relationship of the homeostasis model assessment of insulin resistance (HOMA-IR) with risk of cardiovascular disease (CVD) in 2,569 subjects who were free of diabetes at baseline over the 8-year follow-up of the San Antonio Heart Study. Over the follow-up period, 187 subjects experienced and incident cardiovascular event (heart attack, stroke, heart surgery, angina, or CVD death). The risk of CVD event increased across quintiles of HOMA-IR after adjustment for age, sex and ethnicity (p< for trend). Additional adjustment for LDL, triglyceride, HDL, systolic blood pressure, smoking, alcohol consumption, exercise and waist circumference (shown in slide) only modestly reduced the magnitude of these associations (p= for trend). Therefore, there is a significant association between HOMA-IR and risk of CVD after adjustment for multiple covariates. Reference. Hanley AJ et al. Diabetes Care 2002; 25: Relación de probabilidad del riesgo de ECV (95% IC) Quintile de HOMA-IR ajustado a la edad, sexo, etnicidad, LDL, trigliceridos, HDL, presi´´on arterial sistólica, cigarro, consumo de alcohol, hora de ocio, ejercicio y circunferencia de cintura (mediana) *p= para aumento del riesgo de enfermedad CV a través de quintiles HOMA-IR. Hanley AJ et al. Diabetes Care 2002; 25:")
26
Riesgo de IM es alta en diabetes tipo 2
50 p<0.001 No prior myocardial infarction 45.0 40 Prior myocardial infarction 30 Riesgo de IM fatal o no fatal (%) p<0.001 20 20.2 18.8 10 3.5 Pacientes No diabéticos (n= 1,373) Pacientes diabéticos tipo 2 (n= 1,059) Incidencia en 7 años en un chohorte basado en Finnish Adapted from Haffner SM. N Engl J Med 1998; 339:
 p< Pacientes No diabéticos (n= 1,373) Pacientes diabéticos tipo 2. (n= 1,059) Incidencia en 7 años en un chohorte basado en Finnish. Adapted from Haffner SM. N Engl J Med 1998; 339:")
27
Tasa de mortalidad en diabéticos es mas del doble vs no diabéticos
Relación 1:2.5 Relación 1:2.2 Relación 1:2.1 5 10 15 20 25 30 35 32.0 26.9 26.9 (muertes por 1000 pacientes año) Tasa de mortalidad Control 15.5 Diabetes 12.5 10.8 Balkau et al1 analysed the 20-year mortality of the men aged years in the Whitehall,2 Paris Prospective3 and Helsinki Policemen4 studies. 75% of the deaths in the Helsinki study were from CVD, compared with 56% in Whitehall and 31% in France. References 1. Balkau B et al. Lancet 1997; 350: 1680. 2. Reid DD et al. Lancet 1974; i: 3. Ducitemière P et al. Diabetologia 1980; 19: 4. Pyorala K. Diabetes Care 1979; 2: Patient numbers 10,025 61 6629 279 631 24 Estudio Whitehall Estudio en policía Helsinki Estudio Prospectivo Paris Balkau B et al. Lancet 1997; 350: 1680
 Tasa de mortalidad. Control Diabetes Balkau et al1 analysed the 20-year mortality of the men aged years in the Whitehall,2 Paris Prospective3 and Helsinki Policemen4 studies. 75% of the deaths in the Helsinki study were from CVD, compared with 56% in Whitehall and 31% in France. References. 1. Balkau B et al. Lancet 1997; 350: Reid DD et al. Lancet 1974; i: Ducitemière P et al. Diabetologia 1980; 19: Pyorala K. Diabetes Care 1979; 2: Patient numbers. 10, Estudio. Whitehall. Estudio en. policía Helsinki. Estudio Prospectivo Paris. Balkau B et al. Lancet 1997; 350:")
28
Probabilidad de muertes en EC en pacientes con diabetes tipo 2 con/sin IM previo
100 80 60 Sobrevida (%) 40 No diabetes y no IM previo (n=1304) Diabetes y no IM previo (n=890) No diabetes e IM previo (n=69) Diabetes e IM previo (n=169) 20 This study compared the 7-year incidence of fatal and nonfatal myocardial infarction (MI) among subjects with type 2 diabetes (n=1059) and non-diabetics (n=1373). A history of MI at baseline in either group was significantly associated with an increased incidence of MI and patients with with both diabetes and prior MI had the worst prognosis (45% incidence of MI). The 7-year incidence rates of MI: - Non-diabetic subjects without MI at baseline 3.5% - Non-diabetic subjects with MI at baseline was 18.8% - Diabetic subjects with previous MI at baseline 45% - Diabetic patients without previous MI at baseline 20.2%. The slide shows a Kaplan-Meier estimate of the probability of death from coronary heart disease (CHD). The hazard ratio for death from coronary heart disease (see slide) for patients with diabetes without prior MI as compared with non-diabetic patients with prior MI was not significantly different from 1.0 after adjustment for age and sex, suggesting similar risks of MI in the two groups. Reference Haffner SM et al. N Engl J Med 1998; 339: 1 2 3 4 5 6 7 8 Año IM: Infarto al miocardio Error de las barras indican 95% IC Haffner SM et al. N Engl J Med 1998; 339:
 40. No diabetes y no IM previo (n=1304) Diabetes y no IM previo (n=890) No diabetes e IM previo (n=69) Diabetes e IM previo (n=169) 20. This study compared the 7-year incidence of fatal and nonfatal myocardial infarction (MI) among subjects with type 2 diabetes (n=1059) and non-diabetics (n=1373). A history of MI at baseline in either group was significantly associated with an increased incidence of MI and patients with with both diabetes and prior MI had the worst prognosis (45% incidence of MI). The 7-year incidence rates of MI: - Non-diabetic subjects without MI at baseline 3.5% - Non-diabetic subjects with MI at baseline was 18.8% - Diabetic subjects with previous MI at baseline 45% - Diabetic patients without previous MI at baseline 20.2%. The slide shows a Kaplan-Meier estimate of the probability of death from coronary heart disease (CHD). The hazard ratio for death from coronary heart disease (see slide) for patients with diabetes without prior MI as compared with non-diabetic patients with prior MI was not significantly different from 1.0 after adjustment for age and sex, suggesting similar risks of MI in the two groups. Reference. Haffner SM et al. N Engl J Med 1998; 339: Año. IM: Infarto al miocardio. Error de las barras indican 95% IC. Haffner SM et al. N Engl J Med 1998; 339:")
33
Implicaciones del síndrome metabólico en el ATP III
National Cholesterol Education Program Adult Treatment Panel III (ATP III) Guidelines Implicaciones del síndrome metabólico en el ATP III
 Guidelines. Implicaciones del síndrome metabólico en el ATP III.")
34
Beneficio mas allá del manejo del LDL El Sindrome Metabólico como una meta Secundaria
Hallazgos Generales del SM Obesidad abdominal Dislipidemia Aterogénica Trigliceridos Altos > LDL pequeña HDL colesterol bajo Elevación de la TA Resistencia a la Insulina ( intolerancia a la glucosa) Estado Protrombótico Estado Proinflamatorio
 Estado Protrombótico. Estado Proinflamatorio.")
35
Guias ATP III Beneficios después de bajar LDL El Sindrome Metabólico como una meta Secundaria

36
Morbilidad y Mortalidad asociada al Síndrome metabólico
Definido por OMS como dos de los siguientes Obesidad, hipertensión, dislipidemia o microalbuminuria. 10-15% en normales, 42-64% en intolerancia y Diabetes Mellitus tipo 2 RR Coronario y cerebrovascular >3 veces en SÍNDROME METABÓLICO Mortalidad CVD 12 vs 2.2p<0.001 RR mas alto por microalbuminuria RR 2,8 Osomaa B Diab Care abr 2001

37
Sindrome Metabólico ATP lo reconoce como factor de riesgo secundario después de controlar LDL Objetivos Reducir las causas subyacentes (obesidad , sedentarísmo) Tratar factores de riesgo lipídicos y no lipídicos asociados
 Tratar factores de riesgo lipídicos y no lipídicos asociados.")
38
Identificación Clínica del Sindrome Metabólico
FACTOR DE RIESGO DEFINICION Obesidad abdominal hombre mujer Circunferencia abdominal >102 cm(40 pulg) >88 cm (35 pulg) Triglicéridos >150 mg/dl HDL hombre <40 mg/dl < 50 mg/dl Presión arterial =>130/85 mmHg Glucosa de ayuno > 110 mg/dl
 >88 cm (35 pulg) Triglicéridos. >150 mg/dl. HDL hombre. <40 mg/dl. < 50 mg/dl. Presión arterial. =>130/85 mmHg. Glucosa de ayuno. > 110 mg/dl.")
39
La circunferencia de la cintura es un parámetro de grasa visceral y determina riesgo cardiovascular
MUJERES HOMBRES > 88 cm = Riesgo aumentado > 102 cm = Riesgo aumentado Lean MEJ, et al. Lancet; 1998: 351; 882-6

40
Sindrome Metabólico Sinónimos Sindrome de resistance a la insulina
Sindrome X (Metabólico) Sindrome Dismetabólico Síndrome Multiple metabólico
 Sindrome Dismetabólico. Síndrome Multiple metabólico.")
41
Sindrome Metabólico Causas Causas Adquiridas de Obesidad y sobrepeso
Inactividad ósea Dieta rica en carbohidratos (>60% de ingesta calórica) en algunas personas Causas Genéticas
 en algunas personas. Causas Genéticas.")
42
Síndrome Metabólico Objectivos Terapeúticos Para reducir las causas
Obesidad Sedentarismo Tratar factores asociados de lípidos y otros factores de riesgo Hipertensión Estado Protrombótico Dislipidemia Aterogénica (Triada lipídica)
")
43
Sindrome Metabólico Manejo del sobrepeso y obesidad
Factores de estilo de vida. Objetivos específicos de intervención Reducción de peso Mejorar reducción del LDL Reducir los factores de riesgo Tecnicas de reducción de peso, Educación

44
Sindrome Metabólico Manejo del Sedentarismo
Sedentarismo como factor de riesgo Objetivo directo de intervención Aumentar actividad física Reducir factores de riesgo Mejorar función cardiovascular Clinical guidelines: U.S. Surgeon General’s Report on Physical Activity

45
Pautas en el manejo terapéutico

46
Pasos tradicionales para el manejo
Insulina Intensiva + Oral ± insulina Dieta & ejercicio + Combinación Oral Monoterapia oral 10 9 HbA1c (%) 8 7 NOTE: This slide contains animation – activated via 5 mouse-clicks. This slide can be used in conjunction with slide X to illustrate how to improve diabetes management. It is traditional to use a stepwise approach to treat type 2 diabetes. This strategy aims primarily to control acute symptoms. Conventional therapy, comprising of dietary measures and exercise, is not usually sufficient to control glycaemia beyond the first year of therapy after diagnosis in the majority of patients.1 In those with unsatisfactory blood glucose control, oral monotherapy [metformin, sulphonylurea (SU) or acarbose] is usually recommended. If oral monotherapy provides inadequate control then combination therapy (eg metformin plus SU or metformin plus RSG) is usually started. If this also proves unsuccessful, conversion to insulin is the next step, either alone or in combination with an oral agent such as metformin to allow a reduction in the insulin dosage and minimise weight gain.1 While this traditional stepwise strategy may prove successful in some patients, in the majority of cases it does not lead to sustained glycaemic control.2 Many physicians intensify treatment only when symptoms of poor glycaemic control become apparent, rather than when glycaemic targets are not reached. References 1. Campbell IW. Br J Cardiol 2000; 7: 2. New JP et al. Diabetologia 2000; 43: Blanco HbA1c 6.5% 6 Pasos del tratamiento Adapted from Campbell IW. Br J Cardiol 2000; 7:
 NOTE: This slide contains animation – activated via 5 mouse-clicks. This slide can be used in conjunction with slide X to illustrate how to improve diabetes management. It is traditional to use a stepwise approach to treat type 2 diabetes. This strategy aims primarily to control acute symptoms. Conventional therapy, comprising of dietary measures and exercise, is not usually sufficient to control glycaemia beyond the first year of therapy after diagnosis in the majority of patients.1. In those with unsatisfactory blood glucose control, oral monotherapy [metformin, sulphonylurea (SU) or acarbose] is usually recommended. If oral monotherapy provides inadequate control then combination therapy (eg metformin plus SU or metformin plus RSG) is usually started. If this also proves unsuccessful, conversion to insulin is the next step, either alone or in combination with an oral agent such as metformin to allow a reduction in the insulin dosage and minimise weight gain.1. While this traditional stepwise strategy may prove successful in some patients, in the majority of cases it does not lead to sustained glycaemic control.2. Many physicians intensify treatment only when symptoms of poor glycaemic control become apparent, rather than when glycaemic targets are not reached. References. 1. Campbell IW. Br J Cardiol 2000; 7: New JP et al. Diabetologia 2000; 43: Blanco HbA1c 6.5% 6. Pasos del tratamiento. Adapted from Campbell IW. Br J Cardiol 2000; 7:")
47
Estrategia en el manejo de diabetes tipo 2 (IDF)
Diagnóstico temprano y clasificación de los estados hiperglicémicos Asegura efectivo capacidad de cuidado Promueve efectiva educación de autocuidado continuo Control glicemia, lipemia, presión arterial Detectar y manejar las complicaciones de la diabetes Manejo de los problemas especiales ‘A Desktop Guide to Type 2 Diabetes Mellitus’ was published in 1999 by the European Diabetes Policy Group of the International Diabetes Federation (IDF) European Region. The document aims to provide guidelines which can offer easy access to high quality and better integrated care, while reducing healthcare inequalities. A greater emphasis on arterial risk factor management, rather than just good blood glucose control, is given particular prominence. The aim of the guidelines is to enable people with diabetes to have a life of normal length and fulfilment through: - Provision of skills to adapt lifestyle to ensure optimum health - Development of understanding to allow coping with new challenges, and to give maximum flexibility - Control of risk factors for arterial disease, and for eye, kidney and nerve damage - Early detection and management of any existing vascular damage. Reference European Diabetes Policy Group. Diabet Med 1999; 16: European Diabetes Policy Group. Diabet Med 1999; 16:
 European Region. The document aims to provide guidelines which can offer easy access to high quality and better integrated care, while reducing healthcare inequalities. A greater emphasis on arterial risk factor management, rather than just good blood glucose control, is given particular prominence. The aim of the guidelines is to enable people with diabetes to have a life of normal length and fulfilment through: - Provision of skills to adapt lifestyle to ensure optimum health. - Development of understanding to allow coping with new challenges, and to give maximum flexibility. - Control of risk factors for arterial disease, and for eye, kidney and nerve damage. - Early detection and management of any existing vascular damage. Reference. European Diabetes Policy Group. Diabet Med 1999; 16: European Diabetes Policy Group. Diabet Med 1999; 16:")
48
Estilo de vida Farmacoterapia Presión arterial Lípidos
Manejo del Riesgo Estilo de vida Farmacoterapia Presión arterial Lípidos

49
Estilo de vida

50
Intervención en el Estilo de vida
Representa el primer paso en el tratamiento de la diabetes tipo 2 Manejo del estilo de vida reduce la progresión a diabetes en 58 % de los pacientes con riesgo a diabetes: Finnish Diabetes Prevention Study1 (Estudio de Prevención de la diabetes terminal) Diabetes Prevention Program2 (Programa de prevención de diabetes) Sin embargo el cumplimiento es pobre en la mayoría de los pacientes que requieren farmacoterapia oral a los pocos años del diagnóstico 1. Tuomilehto J et al for the Finnish Diabetes Prevention Study Group. N Engl J Med 2001; 344: Bailey CJ. Br J Diabetes Vasc Dis 2001; 1: 62-64
 Diabetes Prevention Program2 (Programa de prevención de diabetes) Sin embargo el cumplimiento es pobre en la mayoría de los pacientes que requieren farmacoterapia oral a los pocos años del diagnóstico. 1. Tuomilehto J et al for the Finnish Diabetes Prevention Study Group. N Engl J Med 2001; 344: Bailey CJ. Br J Diabetes Vasc Dis 2001; 1:")
51
Control Glicémico: Efectos sobre las complicaciones micro y macrovascular
Cada descenso del 1% de HbA1c del rango normal se ha asociado con la reducción del riesgo siguiente: Muerte relacionada con cualquier diabetes Muerte relacionada con Diabetes Todas las causas de mortalidad IM ACV Enfermedad vascular periférica* Enfermedad Microvascular Extracción de catarata -5 12 -10 14 14 -15 p=0.035 19 21 21 p<0.0001 p<0.0001 -20 Reducción del riesgo (%) p<0.0001 -25 p<0.0001 p<0.0001 -30 37 -35 UKPDS 35 was a prospective observational study to determine the relation between exposure to glycaemia over time and the risk of macrovascular or microvascular complications in patients with type 2 diabetes who were participants in UKPDS blood glucose control study. After a three month dietary runin period patients were stratified on the basis of fasting plasma glucose concentration and body weight. The 3867 patients who had fasting plasma glucose concentrations between 6.1 and 15.0 mmol/l and no symptoms of hyperglycaemia were randomised to a policy of conventional glucose control, primarily with diet, or to an intensive policy with sulphonylurea or insulin. The aim in the group allocated to conventional control (n=1138) was to obtain fasting plasma glucose concentration <15 mmol/l, but if concentrations rose to >15 mmol/l or symptoms of hyperglycaemia developed patients were secondarily randomised to nonintensive use of these pharmacological treatments, with the aim of achieving fasting plasma glucose concentrations <15 mmol/l without symptoms. The aim in the intensive group (n=2729) was to achieve fasting plasma glucose concentration <6 mmol/l with a sulphonylurea (chlorpropamide, glibenclamide, or glipizide) or with insulin. Overweight patients (>120% ideal bodyweight) were randomly assigned treatment with the additional possibility of metformin (342 patients were on intensive metformin therapy). The incidence of clinical complications was significantly associated with glycaemia. Any reduction in HbA1c is likely to reduce the risk of complications, with the lowest risk being in those with HbA1c values in the normal range (<6.0%). Reference Stratton IM et al on behalf of the United Kingdom Prospective Diabetes Study Group (UKPDS 35). BMJ 2000; 321: -40 43 p<0.0001 -45 p<0.0001 -50 *Amputación de miembro inferior o enfermedad vascular periférica fatal Stratton IM et al (UKPDS 35). BMJ 2000; 321:
 p< p< p< UKPDS 35 was a prospective observational study to determine the relation between exposure to glycaemia over time and the risk of macrovascular or microvascular complications in patients with type 2 diabetes who were participants in UKPDS blood glucose control study. After a three month dietary runin period patients were stratified on the basis of fasting plasma glucose concentration and body weight. The 3867 patients who had fasting plasma glucose concentrations between 6.1 and 15.0 mmol/l and no symptoms of hyperglycaemia were randomised to a policy of conventional glucose control, primarily with diet, or to an intensive policy with sulphonylurea or insulin. The aim in the group allocated to conventional control (n=1138) was to obtain fasting plasma glucose concentration <15 mmol/l, but if concentrations rose to >15 mmol/l or symptoms of hyperglycaemia developed patients were secondarily randomised to nonintensive use of these pharmacological treatments, with the aim of achieving fasting plasma glucose concentrations <15 mmol/l without symptoms. The aim in the intensive group (n=2729) was to achieve fasting plasma glucose concentration <6 mmol/l with a sulphonylurea (chlorpropamide, glibenclamide, or glipizide) or with insulin. Overweight patients (>120% ideal bodyweight) were randomly assigned treatment with the additional possibility of metformin (342 patients were on intensive metformin therapy). The incidence of clinical complications was significantly associated with glycaemia. Any reduction in HbA1c is likely to reduce the risk of complications, with the lowest risk being in those with HbA1c values in the normal range (<6.0%). Reference. Stratton IM et al on behalf of the United Kingdom Prospective Diabetes Study Group. (UKPDS 35). BMJ 2000; 321: p< p< *Amputación de miembro inferior o enfermedad vascular periférica fatal. Stratton IM et al (UKPDS 35). BMJ 2000; 321:")
52
Intervención en el Estilo de vida reduce la glicemia en ayunas
Finnish Diabetes Prevention Study Grupo Control * (n=250) Grupo de Intervention ** (n=256) 0.1 0.056 Cambios de la glicemia en ayunas al año (mmol/l) -0.1 -0.2 -0.224 The Finnish Diabetes Prevention Study randomly assigned 522 middle-aged, overweight subjects (172 men and 350 women; mean age, 55 years; mean body mass index, 31 kg/m2) with impaired glucose tolerance to either an intervention or a control group. Subjects in the intervention group received individualised counselling aimed at reducing weight, total intake of fat, and intake of saturated fat and increasing fibre intake and physical activity. Each subject in the intervention group had seven sessions with a nutritionist during the first year of the study and one session every 3 months thereafter and also received individual guidance on increasing their level of physical activity. Subjects in the control group were given general oral and written advice about diet and exercise at baseline and at subsequent annual visits but no specific individualised programmes were offered to them. An oral glucose tolerance test was performed annually and the diagnosis of diabetes was confirmed by a second test. The mean duration of follow-up was 3.2 years. There was a significantly greater decrease in fasting plasma glucose concentrations in the intervention group compared to the control group (p<0.001) at the end of the first year. There were also significant falls in mean body weight, visceral obesity, serum insulin and plasma glucose concentration 2 hours after oral glucose challenge in the intervention group compared to the control group. Reference Tuomilehto J et al for the Finnish Diabetes Prevention Study Group. N Engl J Med 2001; 344: *Grupo Control: consejo general sobre el estilo de vida ** Grupo de Intervención: consejos individualizado sobre el estilo de vida, frecuentemente reforzado Error de las barras= 95% IC -0.3 p<0.001 -0.4 Tuomilehto J et al for the Finnish Diabetes Prevention Study Group. N Engl J Med 2001; 344:
 Grupo de. Intervention ** (n=256) Cambios de la glicemia en. ayunas al año (mmol/l) The Finnish Diabetes Prevention Study randomly assigned 522 middle-aged, overweight subjects (172 men and 350 women; mean age, 55 years; mean body mass index, 31 kg/m2) with impaired glucose tolerance to either an intervention or a control group. Subjects in the intervention group received individualised counselling aimed at reducing weight, total intake of fat, and intake of saturated fat and increasing fibre intake and physical activity. Each subject in the intervention group had seven sessions with a nutritionist during the first year of the study and one session every 3 months thereafter and also received individual guidance on increasing their level of physical activity. Subjects in the control group were given general oral and written advice about diet and exercise at baseline and at subsequent annual visits but no specific individualised programmes were offered to them. An oral glucose tolerance test was performed annually and the diagnosis of diabetes was confirmed by a second test. The mean duration of follow-up was 3.2 years. There was a significantly greater decrease in fasting plasma glucose concentrations in the intervention group compared to the control group (p<0.001) at the end of the first year. There were also significant falls in mean body weight, visceral obesity, serum insulin and plasma glucose concentration 2 hours after oral glucose challenge in the intervention group compared to the control group. Reference. Tuomilehto J et al for the Finnish Diabetes Prevention Study Group. N Engl J Med. 2001; 344: *Grupo Control: consejo general sobre el estilo de vida ** Grupo de Intervención: consejos individualizado sobre el estilo de vida, frecuentemente reforzado Error de las barras= 95% IC p< Tuomilehto J et al for the Finnish Diabetes Prevention Study Group. N Engl J Med 2001; 344:")
53
Probabilidad acumulativa de permancer libre de diabetes
Intervención en el Estilo de vida previene el desarrollo de diabetes tipo 2 Finnish Diabetes Prevention Study en sujetos IGT 1.0 Grupo de Intervención 0.9 0.8 Probabilidad acumulativa de permancer libre de diabetes 0.7 p<0.001 entre grupos Grupo Control 0.6 0.5 The Finnish Diabetes Prevention Study randomly assigned 522 middle-aged, overweight subjects (172 men and 350 women; mean age, 55 years; mean body mass index, 31 kg/m2) with impaired glucose tolerance to either an intervention or a control group. Subjects in the intervention group received individualised counselling aimed at reducing weight, total intake of fat, and intake of saturated fat and increasing fibre intake and physical activity. Each subject in the intervention group had seven sessions with a nutritionist during the first year of the study and one session every 3 months thereafter and also received individual guidance on increasing their level of physical activity. Subjects in the control group were given general oral and written advice about diet and exercise at baseline and at subsequent annual visits but no specific individualised programmes were offered to them. An oral glucose tolerance test was performed annually and the diagnosis of diabetes was confirmed by a second test. The mean duration of follow-up was 3.2 years. The mean duration of follow-up was 3.2 years. The slide shows the cumulative incidence of diabetes was lower in the intervention group than in the control group. The relative risk of diabetes for subjects in the intervention group, as compared with those in the control group, was 0.4 (p<0.001 for the comparison between the groups). Reference Tuomilehto J et al for the Finnish Diabetes Prevention Study Group. N Engl J Med 2001; 344: *Grupo Control: consejo general sobre el estilo de vida ** Grupo de Intervención: consejos individualizado sobre el estilo de vida, frecuentemente reforzado Error de las barras= 95% IC 1 2 3 4 5 6 Año de estudio Total no N° acumulativo con diabetes: Grupo de Intervención Grupo Control Tuomilehto J et al for the Finnish Diabetes Prevention Study Group. N Engl J Med 2001; 344:
 with impaired glucose tolerance to either an intervention or a control group. Subjects in the intervention group received individualised counselling aimed at reducing weight, total intake of fat, and intake of saturated fat and increasing fibre intake and physical activity. Each subject in the intervention group had seven sessions with a nutritionist during the first year of the study and one session every 3 months thereafter and also received individual guidance on increasing their level of physical activity. Subjects in the control group were given general oral and written advice about diet and exercise at baseline and at subsequent annual visits but no specific individualised programmes were offered to them. An oral glucose tolerance test was performed annually and the diagnosis of diabetes was confirmed by a second test. The mean duration of follow-up was 3.2 years. The mean duration of follow-up was 3.2 years. The slide shows the cumulative incidence of diabetes was lower in the intervention group than in the control group. The relative risk of diabetes for subjects in the intervention group, as compared with those in the control group, was 0.4 (p<0.001 for the comparison between the groups). Reference. Tuomilehto J et al for the Finnish Diabetes Prevention Study Group. N Engl J Med. 2001; 344: *Grupo Control: consejo general sobre el estilo de vida ** Grupo de Intervención: consejos individualizado sobre el estilo de vida, frecuentemente reforzado Error de las barras= 95% IC Año de estudio. Total no N° acumulativo con diabetes: Grupo de Intervención Grupo Control Tuomilehto J et al for the Finnish Diabetes Prevention Study Group. N Engl J Med 2001; 344:")
54
Manejo de Estilo de vida reduce el riesgo de diabetes tipo 2
Diabetes Prevention Program 12 10 11% 8 58% Desarrollo Individual de diabetes por año después de 3 años de seguimiento (%) 6 4 4.8% The Diabetes Prevention Program (DPP) was a randomised trial in 3,234 subjects with impaired glucose tolerance (plasma glucose concentration 7.8 and <11.1 mmol/l at 2 hours after a 75 g oral glucose tolerance test). For inclusion in the DPP, individuals not only had IGT but also had a fasting plasma glucose of mg/dl, placing them towards the upper end of the normal range and therefore at particularly high risk of diabetes. Individuals were randomised to 1 of 3 groups: standard care, intensive lifestyle intervention and metformin intervention (results not shown). Standard care consisted of written information and a single advisory session to encourage healthy living. Advice was given on diet, exercise, smoking, alcohol and body weight control, and this was reinforced at each annual review. Intensive lifestyle management provided frequent and interactive sessions on lifestyle management designed to achieve 150 min/week of moderately intense physical activity (walking or cycling) and 7% weight loss in the overweight. Participants in this group attended 16 sessions in the first 24 weeks with additional sessions at least every 2 months thereafter. On average, this groups managed 30 min/day of moderate physical activity and maintained a 5% weight loss. During the average follow-up period of 3 years about 11% per year of individuals receiving standard care developed diabetes. In contrast, only 4.8% per year receiving intensive lifestyle intervention developed diabetes representing a 58% decrease in progression of IGT to diabetes. Reference Bailey CJ. Br J Diabetes Vasc Dis 2001; 1: 2 Cuidado Estandard Intensa intervención del estilo de vida Adapted from Bailey CJ. Br J Diabetes Vasc Dis 2001; 1: 62-64
 % The Diabetes Prevention Program (DPP) was a randomised trial in 3,234 subjects with impaired glucose tolerance (plasma glucose concentration 7.8 and <11.1 mmol/l at 2 hours after a 75 g oral glucose tolerance test). For inclusion in the DPP, individuals not only had IGT but also had a fasting plasma glucose of mg/dl, placing them towards the upper end of the normal range and therefore at particularly high risk of diabetes. Individuals were randomised to 1 of 3 groups: standard care, intensive lifestyle intervention and metformin intervention (results not shown). Standard care consisted of written information and a single advisory session to encourage healthy living. Advice was given on diet, exercise, smoking, alcohol and body weight control, and this was reinforced at each annual review. Intensive lifestyle management provided frequent and interactive sessions on lifestyle management designed to achieve 150 min/week of moderately intense physical activity (walking or cycling) and 7% weight loss in the overweight. Participants in this group attended 16 sessions in the first 24 weeks with additional sessions at least every 2 months thereafter. On average, this groups managed 30 min/day of moderate physical activity and maintained a 5% weight loss. During the average follow-up period of 3 years about 11% per year of individuals receiving standard care developed diabetes. In contrast, only 4.8% per year receiving intensive lifestyle intervention developed diabetes representing a 58% decrease in progression of IGT to diabetes. Reference. Bailey CJ. Br J Diabetes Vasc Dis 2001; 1: Cuidado Estandard. Intensa intervención del estilo de vida. Adapted from Bailey CJ. Br J Diabetes Vasc Dis 2001; 1:")
55
Farmacoterapia - Biguanidas - Sulfonilúreas - Liberadores de insulina prandial - Inhibidores Glucosidasa Alfa - Tiazolidinediones

56
Clases de agentes antidiabéticos
Acción Biguanidas Ej metformin Mejora la sensibilidad a la insulina en hígado Sulfonilúreas Ej glibenclamida, glipizide Estimula la secreción de insulina por las células beta pancreáticas Liberadores Insulina prandial Ej repaglinida Estimuladores rápidos y breves de la secreción de insulina por las células beta pancreáticas Inhibidores glucosidasa alfa Ej acarbose Retardo de los carbohidratos complejos del tracto GI Tiazolidinediones Ej RSG, pioglitazone Mejora la sensibilidad a la insulina, particularmente en músculo y tejido adiposo Insulina Descenso de la salida de glucosa hepática, aumento del uso de la glucosa, suprime la lipólisis Apart from insulin, there are currently five classes of oral antidiabetic agents available: Sulphonylureas are the longest established oral agents for type 2 diabetes and are widely used in patients with type 2 diabetes (used in approximately 70% of European patients receiving oral treatment). They help control blood glucose levels by stimulating insulin secretion from the pancreatic beta-cells. Meglitinides such as repaglinide are a relatively new class of oral antidiabetic and increase insulin secretion by binding to the sulphonylurea binding site. Biguanides, such as metformin, are well established agents whose primary site of action is in the liver where they increase insulin sensitivity and thereby reduce hepatic glucose output. Alpha-glucosidase inhibitors such as acarbose delay the absorption of complex carbohydrates from the gastrointestinal tract. They are therefore of value in controlling postprandial hyperglycaemia. Thiazolidinediones improve glycaemic control by decreasing insulin resistance in peripheral tissues and by also reducing levels of free fatty acids. Reference Campbell IW. Br J Cardiol 2000; 7: Adapted from Campbell IW. Br J Cardiol 2000; 7:
. They help control blood glucose levels by stimulating insulin secretion from the pancreatic beta-cells. Meglitinides such as repaglinide are a relatively new class of oral antidiabetic and increase insulin secretion by binding to the sulphonylurea binding site. Biguanides, such as metformin, are well established agents whose primary site of action is in the liver where they increase insulin sensitivity and thereby reduce hepatic glucose output. Alpha-glucosidase inhibitors such as acarbose delay the absorption of complex carbohydrates from the gastrointestinal tract. They are therefore of value in controlling postprandial hyperglycaemia. Thiazolidinediones improve glycaemic control by decreasing insulin resistance in peripheral tissues and by also reducing levels of free fatty acids. Reference. Campbell IW. Br J Cardiol 2000; 7: Adapted from Campbell IW. Br J Cardiol 2000; 7:")
57
Diabetes es una enfermedad multi-órgano: RSG tiene un modo de acción complementario
Inhibidor de glucosidasa alfa (Ej acarbose) Retardo de la absorción Sulfonilúrea (Ej glibenclamide), Liberadores de Insulina Prandial (Ej repaglinide) Estimula secreción de insulina Biguanide (Ej metformin) Reduce la salida de glucosa hepática I G Carbohidratos I Glucosa (G) Insulina (I) Tiazolidinediones (Ej RSG) Mejora resistencia a insulina, positivamente afecta función de células beta NOTE: This slide contains animation – activated via one mouse-click.
 Retardo de la absorción. Sulfonilúrea. (Ej glibenclamide), Liberadores de Insulina Prandial (Ej repaglinide) Estimula secreción de insulina. Biguanide (Ej metformin) Reduce la salida de glucosa hepática. I. G. Carbohidratos. I. Glucosa (G) Insulina (I) Tiazolidinediones (Ej RSG) Mejora resistencia a insulina, positivamente afecta función de células beta. NOTE: This slide contains animation – activated via one mouse-click.")
58
Biguanidas – características claves
Mecanismo de acción producción glucosa hepática captación glucosa periférica Sitio de acción Hígado y músculo Disminución de HbA1c 1.5 – 2.0% Niveles de insulina en plasma Principales eventos adversos Trastornos GI, casos raros de acidosis láctica Efectos sobre el peso corporal Biguanides, such as metformin, are well established agents that act on the liver to reduce hepatic glucose output. Furthermore, biguanides may also slight improve insulin sensitivity.1 Biguanides are indicated for the treatment of type 2 diabetes in adults, particularly in overweight patients, when dietary management and exercise alone does not result in adequate glycaemic control. It may be used as monotherapy or in combination with other oral antidiabetic agents, or with insulin. These agents are usually recommended in obese patients and although generally well tolerated, gastrointestinal side effects can limit its use in some patients. Lactic acidosis is a rare, but serious and reported cases of lactic acidosis have occurred primarily in diabetic patients with significant renal failure.2 As biguanides are excreted by the kidney, serum creatinine levels should be determined before initiating treatment and regularly thereafter. Biguanides are contraindicated in renal failure or renal dysfunction (eg serum creatinine levels> 135 μmol/l in males and >110 μmol/l in females). Reference 1. Campbell IW. Br J Cardiol 2000; 7: 2. Glucophage. Summary of Product Characteristics, Merck-Pharmaceuticals, 2001. Adapted from Campbell IW. Br J Cardiol 2000; 7:
. Reference. 1. Campbell IW. Br J Cardiol 2000; 7: Glucophage. Summary of Product Characteristics, Merck-Pharmaceuticals, Adapted from Campbell IW. Br J Cardiol 2000; 7:")
59
Metformina en pacientes con sobrepeso (UKPDS)
Intensa terapia con metformina (n=342) vs terapia con dieta (convencional) (n=411) 32% reducción del riesgo en culaquier punto p=0.0023 final relacionado con diabetes 42% reducción del riesgo de muertes p=0.017 relacionadas con diabetes 36% reducción del riesgo de todas las causas p=0.011 de mortalidad 39% reducción del riesgo en infarto al miocardio p=0.01 In UKPDS 34, 753 overweight patients with newly diagnosed type 2 diabetes were included in a randomised controlled trial, median treatment duration 10.7 years, of conventional therapy (primarily with diet alone*, n=411) versus intensive blood-glucose control with metformin, aiming for an FPG <6 mmol/l (n=342). Median HbA1c was 7.4% in the metformin group compared with 8.0% in the conventional group. Intensive glucose control with metformin appears to decrease the risk of diabetic complications in overweight patients with diabetes. Metformin was alsoa associated with less weight gain and fewer hypoglycaemic attacks than sulphonylureas or insulin in this patient group. *If marked hyperglycaemia developed (FPG >15 mmol/l or symptoms of hyperglycaemia) patients were secondarily randomised to additional non-intensive pharmacological therapy with other treatments (metformin, chlorpropamide, glibenclamide, and insulin). Reference United Kingdom Prospective Diabetes Study Group (UKPDS 34). Lancet 1998; 352: UKPDS 34. Lancet 1998; 352:
 vs terapia con dieta (convencional) (n=411) 32% reducción del riesgo en culaquier punto p= final relacionado con diabetes 42% reducción del riesgo de muertes p= relacionadas con diabetes. 36% reducción del riesgo de todas las causas p= de mortalidad 39% reducción del riesgo en infarto al miocardio p=0.01. In UKPDS 34, 753 overweight patients with newly diagnosed type 2 diabetes were included in a randomised controlled trial, median treatment duration 10.7 years, of conventional therapy (primarily with diet alone*, n=411) versus intensive blood-glucose control with metformin, aiming for an FPG <6 mmol/l (n=342). Median HbA1c was 7.4% in the metformin group compared with 8.0% in the conventional group. Intensive glucose control with metformin appears to decrease the risk of diabetic complications in overweight patients with diabetes. Metformin was alsoa associated with less weight gain and fewer hypoglycaemic attacks than sulphonylureas or insulin in this patient group. *If marked hyperglycaemia developed (FPG >15 mmol/l or symptoms of. hyperglycaemia) patients were secondarily randomised to additional non-intensive. pharmacological therapy with other treatments (metformin, chlorpropamide, glibenclamide, and insulin). Reference. United Kingdom Prospective Diabetes Study Group (UKPDS 34). Lancet 1998; 352: UKPDS 34. Lancet 1998; 352:")
60
Sulfonilúreas – características claves
Mecanismo de acción secreción de insulina Sitio de acción Actúa directamente sobre células beta del páncreas Disminución de HbA1c 1.5 – 2.0% Niveles de insulina en plasma Principales eventos adversos Hipoglicemia Efectos sobre el peso corporal Sulphonylureas are indicated for the oral treatment of patients with type 2 diabetes who respond inadequately to dietary measures alone. Sulphonylureas help control blood glucose levels by stimulating insulin secretion from the pancreatic beta-cells. They are generally well tolerated, hypoglycaemia being the most common adverse event.1 In addition, these agents can increase body weight if used for long periods. UKPDS 33 showed that patients treated with SU had significantly more weight gain at 10 years than patients assigned to conventional therapy with diet (2.6 kg with chlorpropamide, 1.7 kg with glibenclamide, p<0.001 for both).1 SUs may therefore be unsuitable for obese patients. References 1. Campbell IW. Br J Cardiol 2000; 7: 2. United Kingdom Prospective Diabetes Study Group (UKPDS 33). Lancet 1998; 352: Adapted from Campbell IW. Br J Cardiol 2000; 7:
.1 SUs may therefore be unsuitable for obese patients. References. 1. Campbell IW. Br J Cardiol 2000; 7: United Kingdom Prospective Diabetes Study Group (UKPDS 33). Lancet 1998; 352: Adapted from Campbell IW. Br J Cardiol 2000; 7:")
61
Liberadores de Insulina Prandial – Características claves
Mecanismo de acción secreción de insulina Sitio de acción Páncreas Disminución de HbA1c 0.5 – 2.0% Niveles de insulina en plasma Transitorio Principales eventos adversos Hipoglicemia Efectos sobre el peso corporal Meglitinides such as repaglinide are a relatively new class of oral antidiabetic and increase insulin secretion by binding to the sulphonylurea binding site. They are indicated in patients with type 2 diabetes whose hyperglycaemia can no longer be controlled satisfactorily by diet, weight reduction and exercise. They are also indicated in combination with metformin in patients who are not satisfactorily controlled on metformin alone. They have a rapid on-off action and therefore have a short duration of action. Meglitinides have been shown to decrease postprandial hyperglycaemia and reduce HbA1c. These agents can be associated with weight gain. Repaglinide should be taken before main meals (i.e. preprandially). Reference Campbell IW. Br J Cardiol 2000; 7: Adapted from Campbell IW. Br J Cardiol 2000; 7:
. Reference. Campbell IW. Br J Cardiol 2000; 7: Adapted from Campbell IW. Br J Cardiol 2000; 7:")
62
Inhibidores de glucosidasa alfa – características claves
Mecanismo de acción absorción glucosa Intestinal Sitio de acción Intestino Disminución de HbA1c 0.4 – 1.2% Niveles de insulina en plasma Principales eventos adversos Flatulencia, diarrea Efectos sobre el peso corporal Alpha-glucosidase inhibitors such as acarbose delay the absorption of complex carbohydrates from the gastrointestinal tract.1 They are therefore of value in controlling postprandial hyperglycaemia. Acarbose as monotherapy is less potent in reducing hyperglycaemia than sulphonylureas or metformin and its side effects are dose limiting, mainly flatulence and diarrhoea. The discontinuation rate for all events with acarbose has been reported to be as high as 61% after three years of treatment.1 Reference 1. Campbell IW. Br J Cardiol 2000; 7: 2. Holman RR et al for the UK Prospective Diabetes Study Group (UKPDS 44). Diabetes Care 1999; 22: Adapted from Campbell IW. Br J Cardiol 2000; 7:
. Diabetes Care 1999; 22: Adapted from Campbell IW. Br J Cardiol 2000; 7:")
63
Inhibidores de glucosidasa alfa- – control glicémico
p<0.0001 p<0.0001 p<0.001 0.6 Placebo 0.4 Acarbose 0.2 Cambio promedio en HbA1c (%) -0.2 This study randomised patients previously enrolled in the UK Prospective Diabetes Study (UKPDS) to acarbose (n=973) or to placebo (n=973). Mean age was 59 years, body weight 84 kg, diabetes duration 7.6 years, median HbA1c 7.9% and fasting plasma glucose (FPG) 8.7 mmol/l. 14% of patients had been treated with diet alone, 52% with monotherapy (SU 26%, metformin 6%, insulin 20%) and 34% with combined therapy (SU plus metformin 16%, SU plus insulin 4%, multiple insulin 14%). Analysis by intention to treat showed that patients allocated to acarbose, compared with placebo, had 0.2% lower median HbA1c at 3 years (p<0.0001). At 3 years, 61% of patients receiving acarbose had discontinued treatment compared with 42% of patients discontinuing in the placebo group (p< between the two groups). In view of these significant non-compliance rates, an analysis by actual therapy was performed to estimate glycaemic differences (shown in graph). Over 1, 2 and 3 years there was a 0.5% significantly lower median HbA1c values in the group taking acarbose at each time point. Reference Holman RR et al for the United Kingdom Prospective Diabetes Study Group (UKPDS 44). Diabetes Care 1999; 22: -0.4 1 2 3 Análisis de acuerdo a los pacientes que permanecieron en la terapia Años desde la randomización Holman RR et al (UKPDS 44). Diabetes Care 1999; 22:
 This study randomised patients previously enrolled in the UK Prospective Diabetes Study (UKPDS) to acarbose (n=973) or to placebo (n=973). Mean age was 59 years, body weight 84 kg, diabetes duration 7.6 years, median HbA1c 7.9% and fasting plasma glucose (FPG) 8.7 mmol/l. 14% of patients had been treated with diet alone, 52% with monotherapy (SU 26%, metformin 6%, insulin 20%) and 34% with combined therapy (SU plus metformin 16%, SU plus insulin 4%, multiple insulin 14%). Analysis by intention to treat showed that patients allocated to acarbose, compared with placebo, had 0.2% lower median HbA1c at 3 years (p<0.0001). At 3 years, 61% of patients receiving acarbose had discontinued treatment compared with 42% of patients discontinuing in the placebo group (p< between the two groups). In view of these significant non-compliance rates, an analysis by actual therapy was performed to estimate glycaemic differences (shown in graph). Over 1, 2 and 3 years there was a 0.5% significantly lower median HbA1c values in the group taking acarbose at each time point. Reference. Holman RR et al for the United Kingdom Prospective Diabetes Study Group (UKPDS. 44). Diabetes Care 1999; 22: Análisis de acuerdo a los pacientes que permanecieron en la terapia. Años desde la randomización. Holman RR et al (UKPDS 44). Diabetes Care 1999; 22:")
64
Tiazolidinediones – características claves
Mecanismo de acción sensibilidad a insulina y captación de glucosa periférica salida de glucosa hepática Sitio de acción Grasa, músculo, hígado Disminución de HbA1c 1.0 – 1.4% Niveles de insulina en plasma Principales eventos adversos Edema, anemia Efectos sobre el peso corporal Thiazolidinediones improve glycaemic control by decreasing insulin resistance in peripheral tissues and by also reducing levels of free fatty acids. These agents bind to peroxisome proliferator-activated receptors (PPARs) on the nuclear membrane of cells, leading to the stimulation of insulin-sensitive proteins involved in glucose metabolism. Thiazolidinediones are well tolerated and they do not cause hypoglycaemia when used as monotherapy because they do not stimulate insulin secretion. They may be associated with weight gain and oedema and are contraindicated in patients with cardiac failure. Thiazolidinediones are currently used only in combination with metformin and sulphonylureas in Europe. Reference Campbell IW. Br J Cardiol 2000; 7: Adapted from Campbell IW. Br J Cardiol 2000; 7:
 on the nuclear membrane of cells, leading to the stimulation of insulin-sensitive proteins involved in glucose metabolism. Thiazolidinediones are well tolerated and they do not cause hypoglycaemia when used as monotherapy because they do not stimulate insulin secretion. They may be associated with weight gain and oedema and are contraindicated in patients with cardiac failure. Thiazolidinediones are currently used only in combination with metformin and sulphonylureas in Europe. Reference. Campbell IW. Br J Cardiol 2000; 7: Adapted from Campbell IW. Br J Cardiol 2000; 7:")
65
Tiazolidinediones – mecanismo de acción
Tejido adiposo Liberación FFA Glucosa en sangre Hígado resistencia a insulina producción glucosa hepática Thiazolidinediones improve the key underlying defects in type 2 diabetes, insulin resistance and beta-cell dysfunction. Thiazolidinediones have a number of effects on various organs of the body: - Muscle and adipose tissue – increasing insulin sensitivity promotes increased glucose uptake - Liver – increased hepatic glucose production is often seen in patients with type 2 diabetes but decreasing insulin resistance can lead to reversal of this effect. Thiazolidinediones may also decrease hepatic glucose output by decreasing free fatty acid concentrations. - Pancreas – thiazolidinediones also improve beta-cell granulation (function). Músculo resistencia a insulina captación de glucosa Páncreas demanda de secreción de insulina granulación de células beta
. Músculo resistencia a insulina. captación de glucosa. Páncreas. demanda de secreción de insulina. granulación de células beta.")
66
Insulina – características claves
Mecanismo de acción producción glucosa hepática Utilisación de glucosa, lipólisis Sitio de acción Grasa, músculo, hígado, páncreas Disminución de HbA1c 1.5 – 2.0% Niveles de insulina en plasma Principales eventos adversos hipoglicemia Efectos sobre el peso corporal Unlike oral antidiabetic agents, insulin needs to be injected into the body where it increases the plasma insulin level and therefore augments the natural actions of insulin. The need to self-inject, the potential for hypoglycaemic episodes and the significant weight gain all tend to limit long-term compliance and this, combined with the need for frequent blood glucose monitoring, can compromise long-term efficacy. A large-scale study of insulin therapy in general practice has suggested that insulin is no more effective than sulphonylureas.1 Reference 1. Hayward RA et al. JAMA 1997; 278:

67
Insulina – control glicémico (UKPDS)
9 Cohorte, valores de la mediana 8 HbA1c (%) Convencional Insulina 7 UKPDS 33 showed that intensive blood-glucose control with insulin was effective in reducing HbA1c levels in patients with type 2 diabetes. The median HbA1c value over 10 years with insulin (7.1%) was significantly lower than that with conventional treatment (7.9%, p<0.0001). However, after an initial decrease in the first year with insulin therapy, there was a subsequent increase in HbA1c similar to the conventional group. Reference United Kingdom Prospective Diabetes Study Group (UKPDS 33). Lancet 1998; 352: Límite superior a la normal= 6.2% 6 2 4 6 8 10 Años desde la randomización UKPDS 33. Lancet 1998; 352:
 Convencional. Insulina. 7. UKPDS 33 showed that intensive blood-glucose control with insulin was effective in reducing HbA1c levels in patients with type 2 diabetes. The median HbA1c value over 10 years with insulin (7.1%) was significantly lower than that with conventional treatment (7.9%, p<0.0001). However, after an initial decrease in the first year with insulin therapy, there was a subsequent increase in HbA1c similar to the conventional group. Reference. United Kingdom Prospective Diabetes Study Group (UKPDS 33). Lancet 1998; 352: Límite superior a la normal= 6.2% Años desde la randomización. UKPDS 33. Lancet 1998; 352:")
68
Presión arterial - UKPDS -HOT

69
Hipertensión en diabetes tipo 2
Diabetes tipo 2 e hipertensión son condiciones comúnmente asociadas Prevalencia de hipertensión en diabetes tipo 2 es mas alto que en la población general : A los 45 años, aprox. 40% son hipertensos A los 75 años, aprox. 60% son hipertensos Hipertensión aumenta siempre el alto riesgo de enfermedad CV asociado con diabetes Type 2 diabetes and hypertension are both conditions associated with the insulin resistance syndrome and carry an increased risk of cardiovascular and renal disease. The prevalence of hypertension in patients with type 2 diabetes is higher than in the general population, especially in younger patients. Hypertension increased the already high risk of cardiovascular disease in patients with type 2 diabetes and is also a risk factor for the development of microalbuminuria and retinopathy. Reference United Kingdom Prospective Diabetes Study Group (UKPDS 38). BMJ 1998; 317: 703- 713. UKPDS 38. BMJ 1998; 317:
. BMJ 1998; 317: UKPDS 38. BMJ 1998; 317:")
70
Control de la Presión arterial en pacientes con diabetes tipo 2 (UKPDS)
Control estricto de PA (144/82 mmHg) vs control menos estricto de PA (154/87 mmHg): 24% reducción del riesgo en cualquier punto final relacionado con diabetes p=0.0046 32% reducción del riesgo en muertes relacionado con diabetes p= 44% reducción del riesgo en ACV p= 37% puntos finales microvascular p=0.0092 UKPDS 38 was a randomised controlled trial comparing tight control of blood pressure (BP) aiming at a BP of <150/85 mmHg (with the use of an angiotensin converting enzyme inhibitor captopril or a beta-blocker atenolol as main treatment, n=758) with less tight control aiming at a BP of <180/105 mmHg in patients with type 2 diabetes (n=390) on macrovascular and microvascular complications. Median follow up was 8.4 years. Mean BP during follow up was significantly reduced in the group assigned tight BP control (144/82 mmHg)-compared with the group assigned to less tight BP control (154/87 mmHg) (p<0.0001). Tight BP control in patients with hypertension and type 2 diabetes achieved a clinically important reduction in the deaths related to diabetes, complications related to diabetes, progression of diabetic retinopathy and deterioration in visual acuity. Reference United Kingdom Prospective Diabetes Study Group (UKPDS 38). BMJ 1998; 317: 703- 713. UKPDS 38. BMJ 1998; 317:
 vs control menos estricto de PA (154/87 mmHg): 24% reducción del riesgo en cualquier punto final relacionado con diabetes p= 32% reducción del riesgo en muertes relacionado con diabetes p=0.019 44% reducción del riesgo en ACV p=0.013 37% puntos finales microvascular p= UKPDS 38 was a randomised controlled trial comparing tight control of blood pressure (BP) aiming at a BP of <150/85 mmHg (with the use of an angiotensin converting enzyme inhibitor captopril or a beta-blocker atenolol as main treatment, n=758) with less tight control aiming at a BP of <180/105 mmHg in patients with type 2 diabetes (n=390) on macrovascular and microvascular complications. Median follow up was 8.4 years. Mean BP during follow up was significantly reduced in the group assigned tight BP control (144/82 mmHg)-compared with the group assigned to less tight BP control (154/87 mmHg) (p<0.0001). Tight BP control in patients with hypertension and type 2 diabetes achieved a clinically important reduction in the deaths related to diabetes, complications related to diabetes, progression of diabetic retinopathy and deterioration in visual acuity. Reference. United Kingdom Prospective Diabetes Study Group (UKPDS 38). BMJ 1998; 317: UKPDS 38. BMJ 1998; 317:")
71
Efecto de PA diastólica sobre la mortalidad cardiovascular en 4 años
Tratamiento Optimo de Hipertensión (HOT) Pacientes con diabetes (n=1501) 15 Pacientes No diabéticos (n=18,970) p=0.016 para la tendencia 11.2 10 11.1 Eventos/1000 paciente años Reducción del riesgo 67% 5 4.1 3.7 3.7 3.8 In the Hypertension Optimal Treatment (HOT) trial 18,970 patients with hypertension were randomly assigned to 3 different diastolic blood pressures (BP; 90 mmHg, 85 mmHg or 80 mmHg). The calcium antagonist felodipine was given as baseline therapy with the addition of other agents, according to a 5-step regimen, if BP targets were not being achieved. There was no difference for reducing blood pressure on cardiovascular mortality in patients without diabetes but in a subgroup of 1501 patients with type 2 diabetes, there was a 67% decrease in risk (p=0.016 for trend). These data support the benefits of intensive blood pressure lowering in patients with type 2 diabetes. Reference Hansson L et al. Lancet 1998; 351: 90 85 80 90 85 80 Presión diastólica (mmHg) Adapted from Hansson L et al. Lancet 1998; 351:
 Pacientes con diabetes (n=1501) 15. Pacientes No diabéticos (n=18,970) p=0.016 para la tendencia Eventos/1000 paciente años. Reducción. del riesgo. 67% In the Hypertension Optimal Treatment (HOT) trial 18,970 patients with hypertension were randomly assigned to 3 different diastolic blood pressures (BP; 90 mmHg, 85 mmHg or 80 mmHg). The calcium antagonist felodipine was given as baseline therapy with the addition of other agents, according to a 5-step regimen, if BP targets were not being achieved. There was no difference for reducing blood pressure on cardiovascular mortality in patients without diabetes but in a subgroup of 1501 patients with type 2 diabetes, there was a 67% decrease in risk (p=0.016 for trend). These data support the benefits of intensive blood pressure lowering in patients with type 2 diabetes. Reference. Hansson L et al. Lancet 1998; 351: 90. 85. 80. 90. 85. 80. Presión diastólica (mmHg) Adapted from Hansson L et al. Lancet 1998; 351:")
72
Control de Presión Arterial en pacientes con diabetes tipo 2
Tratamiento Optimo de Hipertensión (HOT) 90 mmHg (n=501) 85 mmHg (n=501) 80 mmHg (n=499) Diastolica objetivo p=0.045* 30 p=0.005* 25 20 p=0.016* Eventos por 1000 paciente años 15 10 In the Hypertension Optimal Treatment (HOT) trial 18,970 patients with hypertension were randomly assigned to 3 different diastolic blood pressures (BP; 90 mmHg, 85 mmHg or 80 mmHg). The calcium antagonist felodipine was given as baseline therapy with the addition of other agents, according to a 5-step regimen, if BP targets were not being achieved. In a subgroup of 1501 patients with type 2 diabetes, there was a substantial benefit with a decrease in BP. There was an associated decrease in the rate of major cardiovascular events (p for trend=0.005), major CV events including silent myocardial infarction (p=0.045) and cardiovascular mortality (p=0.016). These data support the benefits of intensive blood pressure lowering in patients with type 2 diabetes. Reference Hansson L et al. Lancet 1998; 351: 5 Eventos CV principales Principales eventos CV (IM inc silente) Mortalidad CV *p valores para la tendencia Hansson L et al. Lancet 1998; 351:
 90 mmHg (n=501) 85 mmHg (n=501) 80 mmHg (n=499) Diastolica objetivo. p=0.045* 30. p=0.005* p=0.016* Eventos por 1000 paciente años In the Hypertension Optimal Treatment (HOT) trial 18,970 patients with hypertension were randomly assigned to 3 different diastolic blood pressures (BP; 90 mmHg, 85 mmHg or 80 mmHg). The calcium antagonist felodipine was given as baseline therapy with the addition of other agents, according to a 5-step regimen, if BP targets were not being achieved. In a subgroup of 1501 patients with type 2 diabetes, there was a substantial benefit with a decrease in BP. There was an associated decrease in the rate of major cardiovascular events (p for trend=0.005), major CV events including silent myocardial infarction (p=0.045) and cardiovascular mortality (p=0.016). These data support the benefits of intensive blood pressure lowering in patients with type 2 diabetes. Reference. Hansson L et al. Lancet 1998; 351: Eventos CV. principales. Principales eventos CV (IM inc silente) Mortalidad CV. *p valores para la tendencia. Hansson L et al. Lancet 1998; 351:")
73
Lípidos - 4S - VA-HIT

74
Dislipidemia en diabetes tipo 2
Diabetes tipo 2 es asociada a un perfil de lípidos que aumenta el riesgo CV: Bajos niveles de HDL colesterol (protector) Elevados triglicéridos Concentraciones elevadas de ácidos grasos libres Aumento de las partículas LDL densas pequeñas (mas aterogénicos) Niveles de LDL total permanecen relativamente sin cambios Elevación de la relación C total : HDL colesterol Haffner SM et al1 investigated the relationship between cardiovascular risk factors and insulin resistance in the Insulin Resistance Atherosclerosis Study (IRAS). They determined insulin sensitivity of 479 patients with type 2 diabetes and found only 37 individuals were insulin sensitive and the remaining 442 were insulin resistant. After adjustment for age, sex, ethnicity and clinic they showed that insulin resistance among patients with type 2 diabetes is significantly correlated with changes in the lipid profile. The Joint British recommendations on prevention of coronary heart disease in clinical practice2 used the total cholesterol:HDL cholesterol to estimate coronary risk. An improvement in diabetic dyslipidaemia leads to an improvement in long-term CV morbidity and mortality in patients with diabetes and coronary heart disease.2 The UKPDS4 examined the differences in lipids in 507, newly diagnosed, patients with type 2 diabetes compared with 195 age-matched normal subjects: - Plasma triglycerides were higher in type 2 diabetes ( mmol/l vs mmol/l) - Total cholesterol was slightly elevated in type 2 diabetes, with females in both populations higher than males (males: 5.5 vs 5.2 mmol/l; females: 5.8 vs 5.5 mmol/l) - HDL cholesterol was slightly lower in male and markedly lower in female patients with type 2 diabetes (males: 1.00 vs 1.11 mmol/l; females: 1.12 vs 1.42 mmol/l) References 1. Haffner SM et al. Diabetes Care 1999; 22: 2. British Cardiac Society, British Hyperlipidaemia Association, British Hypertension Society, endorsed by the British Diabetic Association. Heart 1998; 80 (Suppl 2): S1-29. 3. Pyorala et al. Diabetes Care 1997; 20: 4. United Kingdom Prospective Diabetes Study (UKPDS) XI. Diabet Med 1994; 11: Haffner SM et al. Diabetes Care 1999; 22: Best J. Drugs 2000; 59: Paolisso, Howard. Diabetic Medicine 1998; 15: Verges B. Diabetes Metabolism 1999; 25: Pyorala et al. Diabetes Care 1997; 20:
 Elevados triglicéridos. Concentraciones elevadas de ácidos grasos libres. Aumento de las partículas LDL densas pequeñas (mas aterogénicos) Niveles de LDL total permanecen relativamente sin cambios. Elevación de la relación C total : HDL colesterol. Haffner SM et al1 investigated the relationship between cardiovascular risk factors and insulin resistance in the Insulin Resistance Atherosclerosis Study (IRAS). They determined insulin sensitivity of 479 patients with type 2 diabetes and found only 37 individuals were insulin sensitive and the remaining 442 were insulin resistant. After adjustment for age, sex, ethnicity and clinic they showed that insulin resistance among patients with type 2 diabetes is significantly correlated with changes in the lipid profile. The Joint British recommendations on prevention of coronary heart disease in clinical practice2 used the total cholesterol:HDL cholesterol to estimate coronary risk. An improvement in diabetic dyslipidaemia leads to an improvement in long-term CV morbidity and mortality in patients with diabetes and coronary heart disease.2. The UKPDS4 examined the differences in lipids in 507, newly diagnosed, patients with type 2 diabetes compared with 195 age-matched normal subjects: - Plasma triglycerides were higher in type 2 diabetes ( mmol/l vs mmol/l) - Total cholesterol was slightly elevated in type 2 diabetes, with females in both populations. higher than males (males: 5.5 vs 5.2 mmol/l; females: 5.8 vs 5.5 mmol/l) - HDL cholesterol was slightly lower in male and markedly lower in female patients with. type 2 diabetes (males: 1.00 vs 1.11 mmol/l; females: 1.12 vs 1.42 mmol/l) References. 1. Haffner SM et al. Diabetes Care 1999; 22: British Cardiac Society, British Hyperlipidaemia Association, British Hypertension Society, endorsed by the British Diabetic Association. Heart 1998; 80 (Suppl 2): S Pyorala et al. Diabetes Care 1997; 20: United Kingdom Prospective Diabetes Study (UKPDS) XI. Diabet Med 1994; 11: Haffner SM et al. Diabetes Care 1999; 22: Best J. Drugs 2000; 59: Paolisso, Howard. Diabetic Medicine 1998; 15: Verges B. Diabetes Metabolism 1999; 25: Pyorala et al. Diabetes Care 1997; 20:")
75
Factores de riesgo de lípidos y predictores de riesgo CV
Bajo HDL es un factor de riesgo independiente de Enfermedad CH1 Relación CT:HDL es el mejor predictor de la enfermedad de arteria coronaria1 Medición de riesgo superior comparado con colesterol total o LDL2 Partículas de LDL pequeñas densas son mas aterogénicas y han sido asociadas a un aumento del riesgo de IM3 Triglicérido NO son un factor de riesgo independiente cuando son analisadas con otras variables Ej HDL4 Acidos grasos libres pueden jugar un papel en ECV afectando el tono vascular (via reducción de la acción/producción del óxido nítrico) 1. Austin MA et al. JAMA 1988; 260: Castelli WP. Am J Obstet Gynecol 1999; 180: S349-S Stampfer MJ et al. JAMA 1996; 276: Turner RC et al (UKPDS 23). BMJ 1998; 316:
 1. Austin MA et al. JAMA 1988; 260: Castelli WP. Am J Obstet Gynecol 1999; 180: S349-S Stampfer MJ et al. JAMA 1996; 276: Turner RC et al (UKPDS 23). BMJ 1998; 316:")
76
ATPIII clasificación de LDL, colesterol total y HDL
LDL colesterol (mg/dl) <100 Optima Cerca de optima/superior a optima Superior al límite Elevado 190 Muy elevado Colesterol Total (mg/dl) <200 Deseable Límite 260 HDL colesterol (mg/dl) <40 Bajo 60 Third Report of the Expert Panel on Detection, Evaluation, and Treatment of High Blood Cholesterol in Adults (Adult Treatment Panel III) Executive Summary. National Cholesterol Education Program (NCEP). May 2001
 <100. Optima Cerca de optima/superior a optima Superior al límite Elevado. 190. Muy elevado. Colesterol Total (mg/dl) <200. Deseable Límite. 260. HDL colesterol (mg/dl) <40. Bajo. 60. Third Report of the Expert Panel on Detection, Evaluation, and Treatment of High Blood Cholesterol in Adults (Adult Treatment Panel III) Executive Summary. National Cholesterol Education Program (NCEP). May")
77
Estatinas en el manejo de la dislipidemia diabética
Estatinas deben ser parte de la práctica clínica de rutina de la diabetes 1 Estatinas indican cuando la respuesta es inadecuada a las modificaciones del estilo de vida y mejoría del control de glucosa Tratamiento en Adulto Panel III:2 Diabetes = CHD riesgo equivalente LDL meta <100 mg/dl (2.6 mmol/l) Inicio se recomienda con drogas hipolipemiantes de LDL cuando LDL 130 mg/dl (3.4 mmol/l) ADA: Meta LDL <100 mg/dl (2.6 mmol/l)3 1. Haffner SM. Diabetes Care 1998; 21:160– National Cholesterol Education Programme, National Institutes of Health, ADA Diabetes Care 2002; 25:S33–S49
 Inicio se recomienda con drogas hipolipemiantes de LDL cuando LDL 130 mg/dl (3.4 mmol/l) ADA: Meta LDL <100 mg/dl (2.6 mmol/l)3. 1. Haffner SM. Diabetes Care 1998; 21:160– National Cholesterol Education Programme, National Institutes of Health, ADA Diabetes Care 2002; 25:S33–S49.")
78
Estatinas – reducción de la concentración de lípidos séricos
Scandinavian Simvastatin Survival Study (4S) Estudio Escandinavo de Sobrevida con Simvastatina (4S) 20 Placebo (n=2223) Simvastatina (n=2221) 10 Cambio desde la línea basal de la concentración de lípidos séricos (%) -10 -20 The Scandinavian Simvastatin Survival Study (4S) was designed to evaluate the effect of statin therapy (with simvastatin) on mortality and morbidity in patients with coronary heart disease (CHD). 4444 patients with angina pectoris and previous myocardial infarction and serum cholesterol mmol/l on a lipid-lowering diet were randomised to double-blind treatment with simvastatin or placebo. Four percent of patients in the placebo group and 5% in the statin group had diabetes at baseline. Over the 5.4 years median follow-up period, simvastatin produced mean changes in total cholesterol, low-density-lipoprotein (LDL) cholesterol, and high-density-lipoprotein cholesterol of –25%, -35% and +8% respectively. Reference Scandinavian Simvastatin Survival Study (4S) Group. Lancet 1994; 344: Pacientes con diabetes en la línea basal: Placebo 4%, Simvastatina 5% -30 Colesterol Total LDL colesterol HDL colesterol Triglicéridos séricos -40 Scandinavian Simvastatin Survival Study (4S) Group. Lancet 1994; 344:
 Estudio Escandinavo de Sobrevida con Simvastatina (4S) 20. Placebo (n=2223) Simvastatina (n=2221) 10. Cambio desde la línea basal de la concentración de lípidos séricos (%) The Scandinavian Simvastatin Survival Study (4S) was designed to evaluate the effect of statin therapy (with simvastatin) on mortality and morbidity in patients with coronary heart disease (CHD) patients with angina pectoris and previous myocardial infarction and serum cholesterol mmol/l on a lipid-lowering diet were randomised to double-blind treatment with simvastatin or placebo. Four percent of patients in the placebo group and 5% in the statin group had diabetes at baseline. Over the 5.4 years median follow-up period, simvastatin produced mean changes in total cholesterol, low-density-lipoprotein (LDL) cholesterol, and high-density-lipoprotein cholesterol of –25%, -35% and +8% respectively. Reference. Scandinavian Simvastatin Survival Study (4S) Group. Lancet 1994; 344: Pacientes con diabetes en la línea basal: Placebo 4%, Simvastatina 5% -30. Colesterol. Total. LDL. colesterol. HDL. colesterol. Triglicéridos. séricos Scandinavian Simvastatin Survival Study (4S) Group. Lancet 1994; 344:")
79
Estatinas – mejora la sobrevida en pacientes de alto riesgo
Scandinavian Simvastatin Survival Study (4S) 1.00 0.95 0.90 0.85 0.80 0.00 Log rango p=0.0003 Proporción de vivos Simvastatin Placebo Pacientes con diabetes en la línea basal: placebo 4%, simvastatina 5% Número de pacientes en riesgo al inicio de cada año se ha demostrado por debajo del eje horizontal The Scandinavian Simvastatin Survival Study (4S) found that lipid-lowering therapy improved survival in patients with CHD. There were 256 deaths (12%) in the placebo group and 182 deaths (8%) in the simvastatin group. The relative risk of death in the simvastatin group was 0.70 (p=0.0003). Reference Scandinavian Simvastatin Survival Study (4S) Group. Lancet 1994; 344: Años desde la randomización Simvastatina Placebo Scandinavian Simvastatin Survival Study (4S) Group. Lancet 1994; 344:
 Log rango p= Proporción de vivos. Simvastatin. Placebo. Pacientes con diabetes en la línea basal: placebo 4%, simvastatina 5% Número de pacientes en riesgo al inicio de cada año se ha demostrado por debajo del eje horizontal. The Scandinavian Simvastatin Survival Study (4S) found that lipid-lowering therapy improved survival in patients with CHD. There were 256 deaths (12%) in the placebo group and 182 deaths (8%) in the simvastatin group. The relative risk of death in the simvastatin group was 0.70 (p=0.0003). Reference. Scandinavian Simvastatin Survival Study (4S) Group. Lancet 1994; 344: Años desde la randomización. Simvastatina Placebo. Scandinavian Simvastatin Survival Study (4S) Group. Lancet 1994; 344:")
80
Estatinas – reducen los eventos coronarios en diabetes
Scandinavian Simvastatin Survival Study (4S) Riesgo para individuos sin diabetes 1 0.8 0.79 p=0.01 0.72 0.6 Riesgo Relativo p=0.005 0.58 0.52 0.4 Using the 1997 American Diabetes Association diagnostic criteria, this study assessed the effect of statin therapy (with simvastatin) post-hoc for an average of 5.4 years in 4S patients with normal fasting glucose (n=3237), impaired fasting glucose (n=678) and type 2 diabetes (n=483). Results are shown only for the type 2 diabetes group. Statin-treated patients with type 2 diabetes had significantly reduced numbers of major coronary events (relative risk [RR]=0.58, p=0.01) and revascularisations (RR=0.52, p=0.005). Total (RR=0.79, p=ns) and coronary (RR=0.72, p=ns) mortality were also reduced in this patient group but not significantly. Reference Haffner SM et al. Arch Intern Med 1999; 159: 0.2 Principales eventos coronarios Revascularizaciones Mortalidad Total Mortalidad coronaria Haffner SM et al. Arch Intern Med 1999; 159:
 Riesgo para individuos sin diabetes p= Riesgo Relativo. p= Using the 1997 American Diabetes Association diagnostic criteria, this study assessed the effect of statin therapy (with simvastatin) post-hoc for an average of 5.4 years in 4S patients with normal fasting glucose (n=3237), impaired fasting glucose (n=678) and type 2 diabetes (n=483). Results are shown only for the type 2 diabetes group. Statin-treated patients with type 2 diabetes had significantly reduced numbers of major coronary events (relative risk [RR]=0.58, p=0.01) and revascularisations (RR=0.52, p=0.005). Total (RR=0.79, p=ns) and coronary (RR=0.72, p=ns) mortality were also reduced in this patient group but not significantly. Reference. Haffner SM et al. Arch Intern Med 1999; 159: Principales. eventos coronarios. Revascularizaciones. Mortalidad. Total. Mortalidad. coronaria. Haffner SM et al. Arch Intern Med 1999; 159:")
81
Fibratos – reducción de las concentraciones de lípidos séricos
Veterans Affairs Cooperative Studies Program High-Density Lipoprotein Intervention Trial (VA-HIT) 5 p<0.001 Placebo Gemfibrozil 1200 mg/día 4 3 Cambio promedio en la concentración de colesterol al año (mmol/l) p<0.001 2 The Veterans Affairs Cooperative Studies Program High-Density Lipoprotein Intervention Trial (VA-HIT) was a double-blind trial comparing fibrate therapy (gemfibrozil 1200 mg/day) with placebo in 2531 men with coronary heart disease, an HDL cholesterol level of <1.0 mmol/l and an LDL cholesterol level of <3.6 mmol/l. Twenty-five percent of patients in the placebo group and 24% of patients in the gemfibrozil group had diabetes. 1 year after randomisation, the mean HDL cholesterol was 6% higher in the gemfibrozil group than in the placebo group (p<0.001), mean total cholesterol was 4% lower (p<0.001) and the mean triglyceride concentration was 31% lower (p<0.001). Significant differences between treatment groups for these three lipids persisted throughout the study. The mean LDL cholesterol was 2.9 mmol/l in both groups at one year and never differed significantly between groups. Reference Rubins HB et al. N Engl J Med 1999; 341: p<0.001 1 Pacientes con diabetes en la línea basal: 25% en el grupo placebo, 24% en el grupo gemfibrozil HDL colesterol Colesterol Total Triglicéridos Rubins HB et al. N Engl J Med 1999; 341:
 5. p< Placebo. Gemfibrozil 1200 mg/día Cambio promedio en la concentración de colesterol al año (mmol/l) p< The Veterans Affairs Cooperative Studies Program High-Density Lipoprotein Intervention Trial (VA-HIT) was a double-blind trial comparing fibrate therapy (gemfibrozil 1200 mg/day) with placebo in 2531 men with coronary heart disease, an HDL cholesterol level of <1.0 mmol/l and an LDL cholesterol level of <3.6 mmol/l. Twenty-five percent of patients in the placebo group and 24% of patients in the gemfibrozil group had diabetes. 1 year after randomisation, the mean HDL cholesterol was 6% higher in the gemfibrozil group than in the placebo group (p<0.001), mean total cholesterol was 4% lower (p<0.001) and the mean triglyceride concentration was 31% lower (p<0.001). Significant differences between treatment groups for these three lipids persisted throughout the study. The mean LDL cholesterol was 2.9 mmol/l in both groups at one year and never differed significantly between groups. Reference. Rubins HB et al. N Engl J Med 1999; 341: p< Pacientes con diabetes en la línea basal: 25% en el grupo placebo, 24% en el grupo gemfibrozil. HDL colesterol. Colesterol Total. Triglicéridos. Rubins HB et al. N Engl J Med 1999; 341:")
82
Fibratos – reducción del riesgo de eventos cardiovasculares (VA-HIT)
25 Placebo Gemfibrozil 20 15 Incidencia acumulativa (%) 10 5 Reducción del riesgo relativo 22% (p=0.006) Pacientes con diabetes en la línea basal: 25% en el grupo placebo, 24% en el grupo gemfibrozil When examining outcomes in VA-HIT, fibrate therapy resulted in a significant reduction in the risk of major cardiovascular events. The overall reduction in the risk of an event (death from coronary heart disease or nonfatal myocardial infarction) was 4.4% and the relative risk was 22% (p=0.006). The findings suggest that the rate of coronary events is reduced by raising HDL cholesterol levels and lowering triglycerides without lowering LDL levels. Reference Rubins HB et al. N Engl J Med 1999; 341: 1 2 3 4 5 6 Años No. en riesgo Placebo Gemfibrozil Rubins HB et al. N Engl J Med 1999; 341:
 Reducción del riesgo relativo 22% (p=0.006) Pacientes con diabetes en la línea basal: 25% en el grupo placebo, 24% en el grupo gemfibrozil. When examining outcomes in VA-HIT, fibrate therapy resulted in a significant reduction in the risk of major cardiovascular events. The overall reduction in the risk of an event (death from coronary heart disease or nonfatal myocardial infarction) was 4.4% and the relative risk was 22% (p=0.006). The findings suggest that the rate of coronary events is reduced by raising HDL cholesterol levels and lowering triglycerides without lowering LDL levels. Reference. Rubins HB et al. N Engl J Med 1999; 341: Años. No. en riesgo Placebo Gemfibrozil Rubins HB et al. N Engl J Med 1999; 341:")
83
Fibratos – efectos en el subgrupo de diabetes (VA-HIT)
Mouerte por enfermedad coronaria, infarto al miocardio no fatal y ACV confirmado 40 40 36 30 30 28 20 20 10 10 Pacientes con un evento (%) Reducción del riesgo (%) Placebo (n=318) Gemfibrozil (n=309) VA-HIT examined the outcome of death from coronary heart disease, nonfatal myocardial infarction or confirmed stroke predefined subgroups. Diabetes was defined by clinical history. 191 out of 318 patients in the placebo group (36%) and 88 out of 309 patients (28%) in the gemfibrozil group had an event. This equated to a risk reduction of 24% (p=0.05). The risk reduction for patients without diabetes was also 24% (p<0.009). Reference Rubins HB et al. N Engl J Med 1999; 341: -10 -10 24 -20 -20 p=0.05 -30 -30 Rubins HB et al. N Engl J Med 1999; 341:
 Reducción del riesgo (%) Placebo (n=318) Gemfibrozil (n=309) VA-HIT examined the outcome of death from coronary heart disease, nonfatal myocardial infarction or confirmed stroke predefined subgroups. Diabetes was defined by clinical history. 191 out of 318 patients in the placebo group (36%) and 88 out of 309 patients (28%) in the gemfibrozil group had an event. This equated to a risk reduction of 24% (p=0.05). The risk reduction for patients without diabetes was also 24% (p<0.009). Reference. Rubins HB et al. N Engl J Med 1999; 341: p= Rubins HB et al. N Engl J Med 1999; 341:")
84
Necesidades insatisfechas

85
Pacientes con sobrepeso alcanzaron el objetivo (%)
Menos del 50% de los pacientes con sobrepeso alcanzaron HbA1c <7.0% (UKPDS) 100 Dieta Insulina Metformina Sulfonilúrea 80 60 Pacientes con sobrepeso alcanzaron el objetivo (%) 40 20 UKPDS showed that after 3 years of monotherapy with either insulin, metformin or sulphonylurea, less than 50% of overweight patients* achieved a target HbA1c of <7%.1 *Overweight patients were defined in this study according to the Metropolitan Life Insurance Company Interactive Height and Weight Table2 as individuals who are >120% over the ideal body weight. References 1. Turner RC et al for the United Kingdom Prospective Diabetes Study Group (UKPDS 49). JAMA 1999; 281: 2. Metropolitan Life Insurance Company. Net weight standard for men and women. Stat Bull Metrop Insur Co 1959; 40: 1-4. 3 6 9 3 6 9 3 6 9 3 6 9 Años desde la randomización Adapted from Turner RC et al (UKPDS 49). JAMA 1999; 281:
 100. Dieta. Insulina. Metformina. Sulfonilúrea Pacientes con sobrepeso alcanzaron el objetivo (%) UKPDS showed that after 3 years of monotherapy with either insulin, metformin or sulphonylurea, less than 50% of overweight patients* achieved a target HbA1c of <7%.1. *Overweight patients were defined in this study according to the Metropolitan Life. Insurance Company Interactive Height and Weight Table2 as individuals who are. >120% over the ideal body weight. References. 1. Turner RC et al for the United Kingdom Prospective Diabetes Study Group (UKPDS. 49). JAMA 1999; 281: Metropolitan Life Insurance Company. Net weight standard for men and women. Stat Bull Metrop Insur Co 1959; 40: Años desde la randomización. Adapted from Turner RC et al (UKPDS 49). JAMA 1999; 281:")
86
Requerimientos tempranos para la terapia de combinación (UKPDS)
100 80 75 65 60 Pacientes requieren multiple terapias (%) 50 40 UKPDS showed that by 3 years after the diagnosis of type 2 diabetes, approximately 50% of patients will need more than one pharmacological agent because monotherapy does not achieve target HbA1c<7%.1 By 9 years after initial diagnosis, approximately 75% of patients will need combination therapy to achieve HbA1c<7%. The current International Diabetes Federation (IDF) guidelines for Europe state that the current HbA1c target is 6.5%.2 References 1. Turner RC et al for the United Kingdom Prospective Diabetes Study Group (UKPDS 49). JAMA 1999; 281: 2. European Diabetes Policy Group A desktop guide to type 2 diabetes mellitus. Diabet Med 1999; 16: 20 3 años 6 años 9 años Adapted from Turner RC et al (UKPDS 49). JAMA 1999; 281:
 UKPDS showed that by 3 years after the diagnosis of type 2 diabetes, approximately 50% of patients will need more than one pharmacological agent because monotherapy does not achieve target HbA1c<7%.1. By 9 years after initial diagnosis, approximately 75% of patients will need combination therapy to achieve HbA1c<7%. The current International Diabetes Federation (IDF) guidelines for Europe state that the current HbA1c target is 6.5%.2. References. 1. Turner RC et al for the United Kingdom Prospective Diabetes Study Group (UKPDS 49). JAMA 1999; 281: European Diabetes Policy Group A desktop guide to type 2 diabetes mellitus. Diabet Med 1999; 16: años. 6 años. 9 años. Adapted from Turner RC et al (UKPDS 49). JAMA 1999; 281:")
87
Futuro manejo de la diabetes tipo 2 – manejo intenso
Dieta Orientado a la meta + Insulina Basal + Droga + Droga Complejo régimen de insulina 10 9 8 HbA1c (%) 7 Blanco HbA1c 6.5% 6 NOTE: This slide contains animation – activated via one mouse-click. This approach to type 2 diabetes management avoids the risk of early treatment failure inherent to the traditional stepwise management strategy by adopting an intensive, aggressive therapeutic strategy immediately upon diagnosis. The aim is to quickly control glycaemia at target levels and thereby minimise the risk of both acute and long-term complications. In adopting an intensive strategy, combinations of agents with complementary modes of action targeting the double deficit underlying type 2 diabetes (insulin resistance and beta-cell dysfunction) are most likely to support tight, long-term glycaemic control. Furthermore, combination therapy should be considered earlier in the regimen to provide additional glycaemic control. Reference Campbell IW. Br J Cardiol 2000; 7: Conservador Pasos del tratamiento Adapted from Campbell IW. Br J Cardiol 2000; 7:
 7. Blanco HbA1c 6.5% 6. NOTE: This slide contains animation – activated via one mouse-click. This approach to type 2 diabetes management avoids the risk of early treatment failure inherent to the traditional stepwise management strategy by adopting an intensive, aggressive therapeutic strategy immediately upon diagnosis. The aim is to quickly control glycaemia at target levels and thereby minimise the risk of both acute and long-term complications. In adopting an intensive strategy, combinations of agents with complementary modes of action targeting the double deficit underlying type 2 diabetes (insulin resistance and beta-cell dysfunction) are most likely to support tight, long-term glycaemic control. Furthermore, combination therapy should be considered earlier in the regimen to provide additional glycaemic control. Reference. Campbell IW. Br J Cardiol 2000; 7: Conservador. Pasos del tratamiento. Adapted from Campbell IW. Br J Cardiol 2000; 7:")
88
Futuro manejo de la diabetes tipo 2
57% de los pacientes con antidiabéticos orales re reciben monoterapia son no controlados* 100 80 60 Pacientes (%) 40 20 NOTE: This slide contains animation – activated via one mouse-click. Using data from CODE-2 (Cost Of Diabetes in Europe - Type 2, a European-wide study in over 7000 patients that set out to investigate the economic issues of diabetes in Europe), the potential to improve the management of patients with type 2 diabetes can be appreciated. CODE-2 estimated the prevalence of type 2 diabetes as 10 million patients in Europe.1 Of these patients, approximately 69% received treatment with an oral antidiabetic agent, either as monotherapy (31% and 8% received monotherapy with sulphonylurea and metformin, respectively) or combination therapy (21% and 9% received a combination of sulphonylurea plus metformin and insulin plus oral antidiabetic agent, respectively).2 66% of oral antidiabetic patients receiving patients receiving sulphonylurea monotherapy and 64% of those receiving metformin monotherapy had poor glycaemic control (HbA1c >6.5%). Furthermore, 26% of patients on either sulphonylurea or metformin monotherapy had HbA1c >8.0%. Therefore, combination therapy has the potential to improve outcomes in patients uncontrolled on monotherapy. References 1. Jönsson B. Diabetologia 2002; 45: S5-S12. 2. Perry AS, Downs K. Diabetologia 2002; 45 (Suppl 2). Abstract 758. Antidiabéticos orales Monoterapia Pacientes con monoterapia no controlados* Terapia de Combinación *HbA1c >6.5% Adapted from Perry AS, Downs K. Diabetologia 2002; 45 (Suppl 2). Abstract 758
 NOTE: This slide contains animation – activated via one mouse-click. Using data from CODE-2 (Cost Of Diabetes in Europe - Type 2, a European-wide study in over 7000 patients that set out to investigate the economic issues of diabetes in Europe), the potential to improve the management of patients with type 2 diabetes can be appreciated. CODE-2 estimated the prevalence of type 2 diabetes as 10 million patients in Europe.1 Of these patients, approximately 69% received treatment with an oral antidiabetic agent, either as monotherapy (31% and 8% received monotherapy with sulphonylurea and metformin, respectively) or combination therapy (21% and 9% received a combination of sulphonylurea plus metformin and insulin plus oral antidiabetic agent, respectively).2. 66% of oral antidiabetic patients receiving patients receiving sulphonylurea monotherapy and 64% of those receiving metformin monotherapy had poor glycaemic control (HbA1c >6.5%). Furthermore, 26% of patients on either sulphonylurea or metformin monotherapy had HbA1c >8.0%. Therefore, combination therapy has the potential to improve outcomes in patients uncontrolled on monotherapy. References. 1. Jönsson B. Diabetologia 2002; 45: S5-S Perry AS, Downs K. Diabetologia 2002; 45 (Suppl 2). Abstract 758. Antidiabéticos. orales. Monoterapia. Pacientes con. monoterapia. no controlados* Terapia de. Combinación. *HbA1c >6.5% Adapted from Perry AS, Downs K. Diabetologia 2002; 45 (Suppl 2). Abstract 758.")
Presentaciones similares
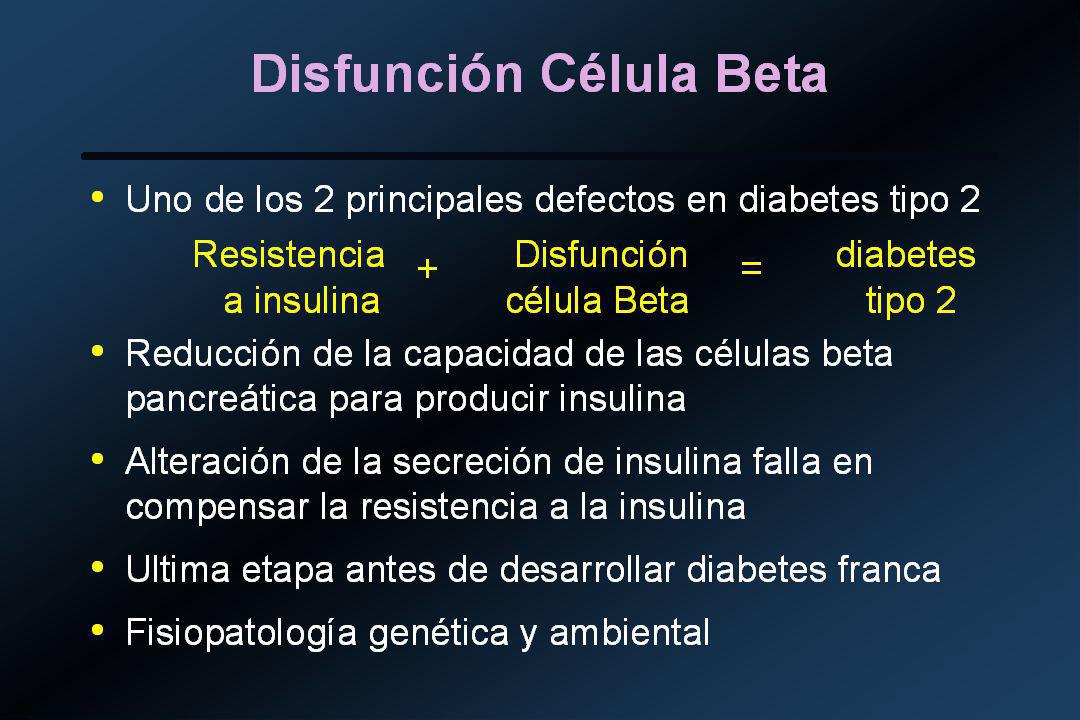
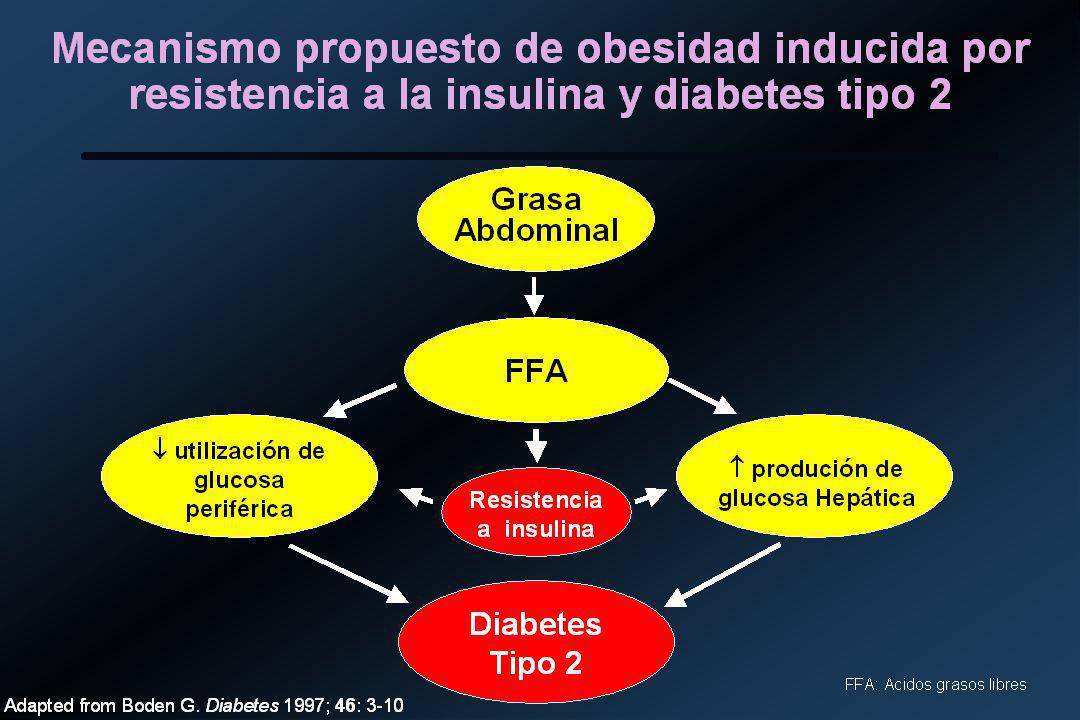
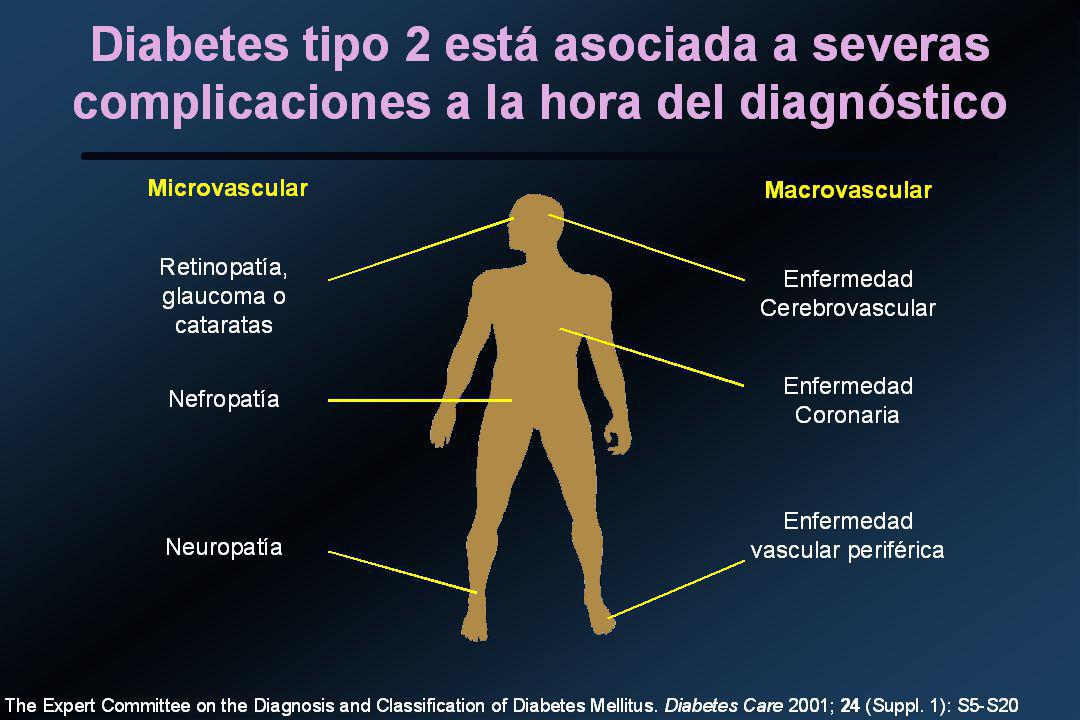
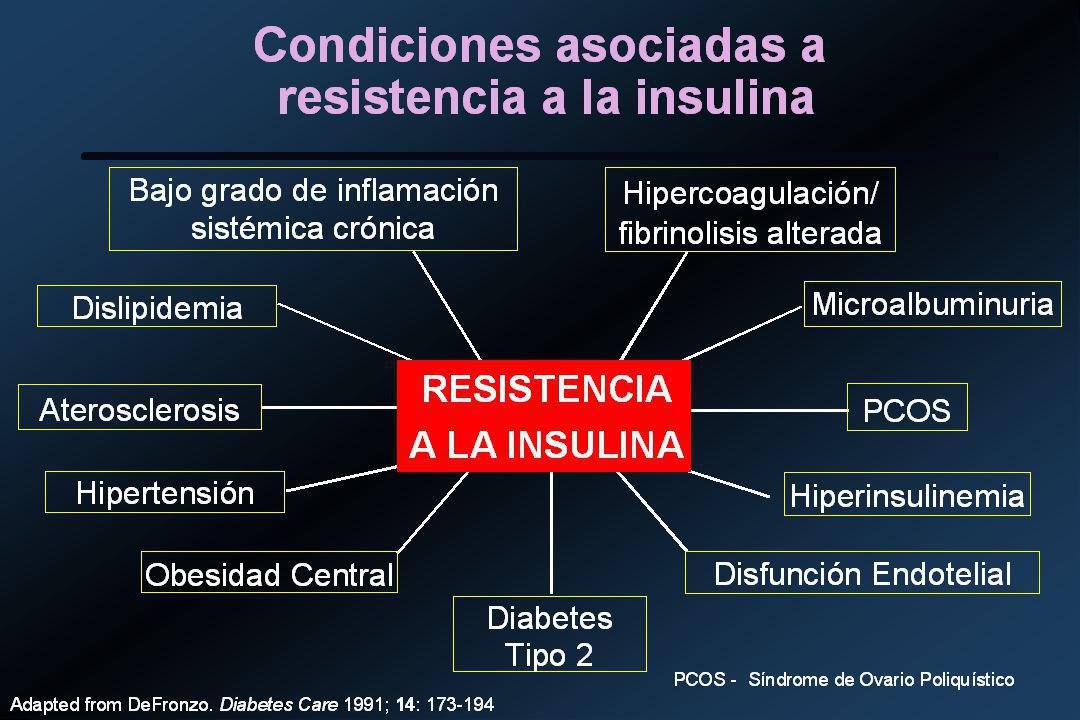
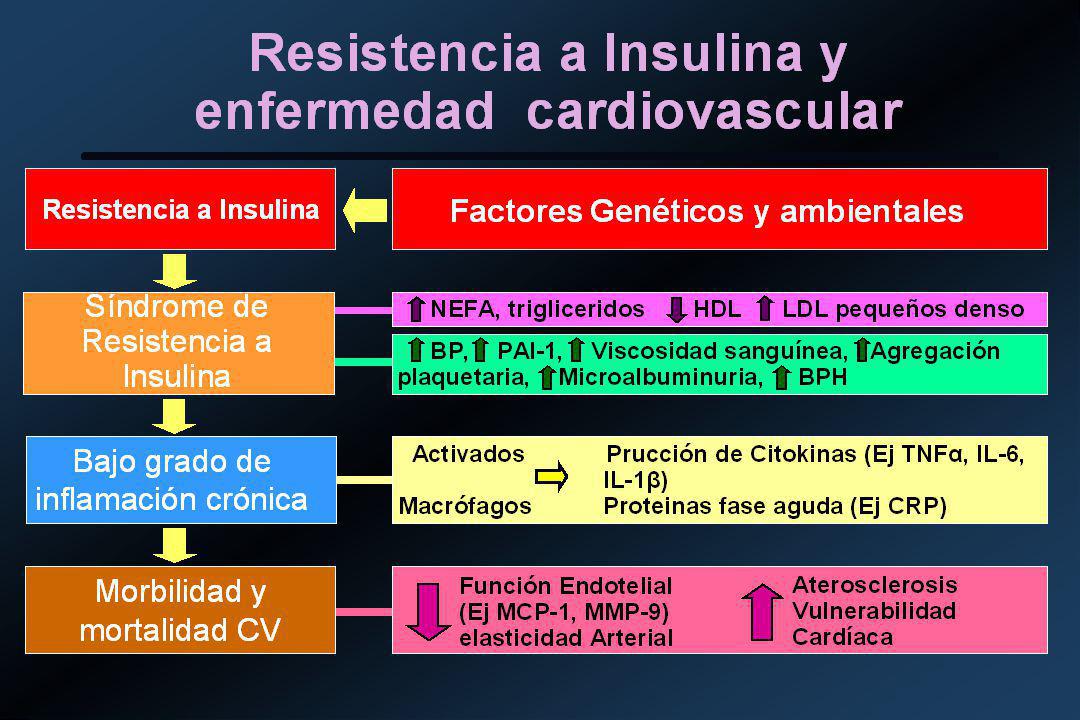

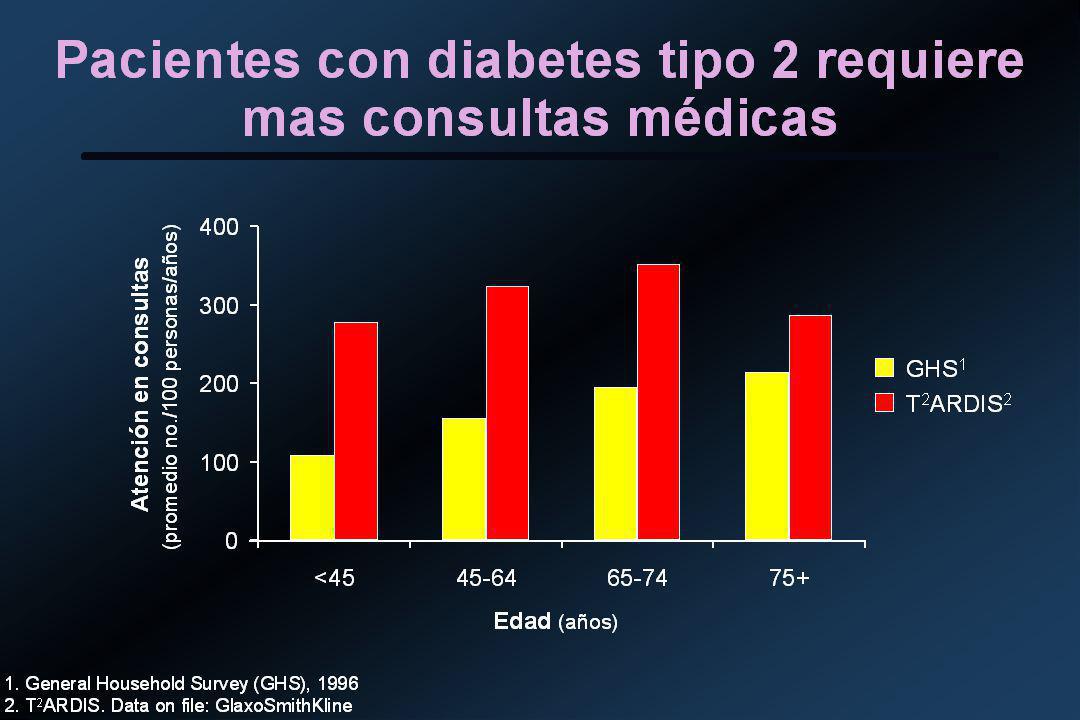
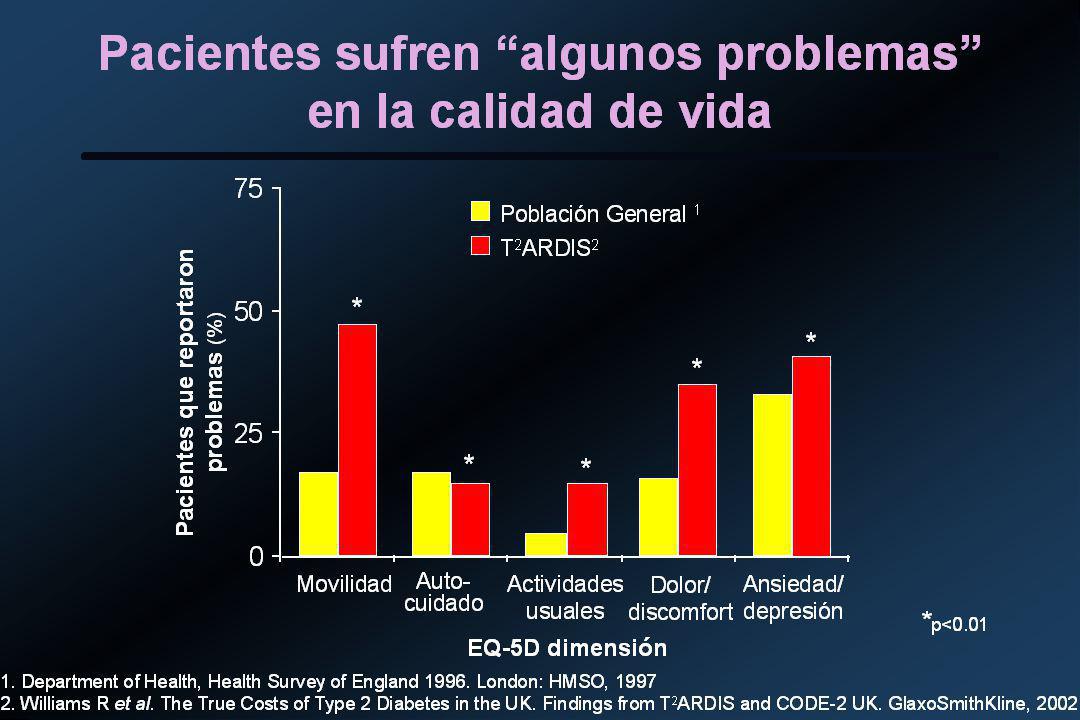


. Panel de expertos en detección, evaluación y tratamiento del colesterol alto.>")


