Descargar la presentación
La descarga está en progreso. Por favor, espere

1
Análisis de Regresión Lineal
Curso de Verano ENCUP: Introducción al análisis cuantitativo en ciencias sociales Javier Aparicio División de Estudios Políticos, CIDE Julio 2009

2
Análisis de regresión lineal
Ajustar una regresión lineal: Estimar los parámetros: Interpretación del intercepto a y la pendiente b Bondad de ajuste Pruebas de hipótesis

3
Scatterplot

4
Modelo lineal E(Y|X)
")
6
Modelo de probabilidad conjunta

7
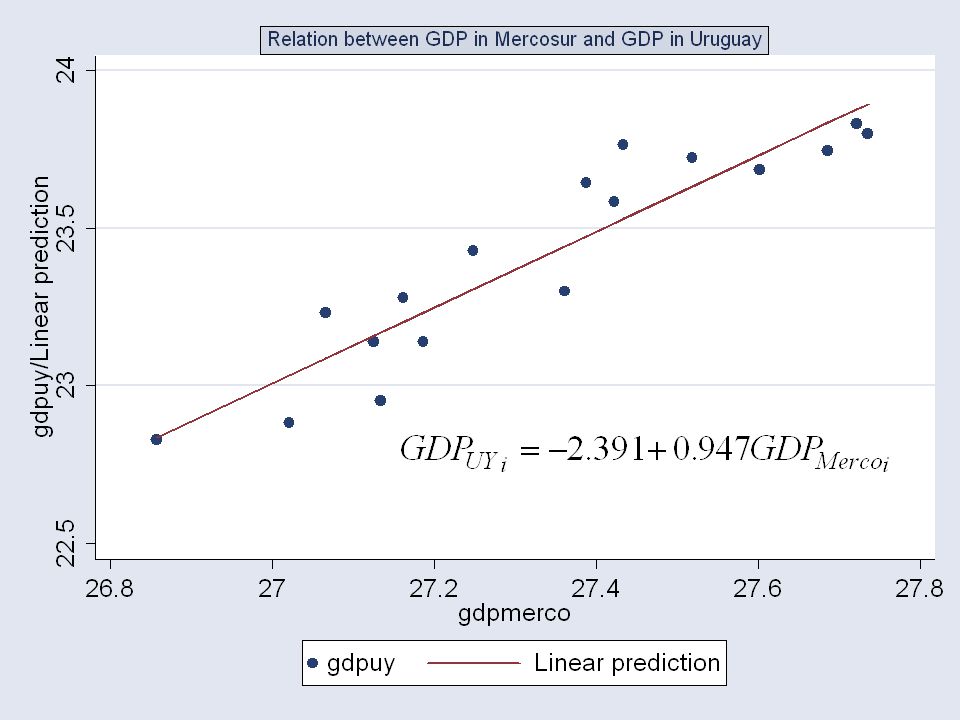
¿PIBMercosur PIBUruguay?

8
1. Ajustando una regresión lineal
Modelo probabilístico Modelo poblacional: Modelo muestral: Modelo estimado: La diferencia ente es el error estimado: La línea de mejor ajuste minimiza la SSE: queremos que el modelo explique la mayor proporción de la varianza de Y. Mathematical models can be either deterministic (exact output for a given input) or probabilistic: the equation will not provide and exact output. Error can be due to different factors: There could be other factors beside growth that explain IMR. There might be measurement error. Or just randomness. Virtually all regression analysis uses sample data. Alpha and Beta are unobtainable and only estimated using sample statistic a and b. All estimated and predicted quantities are denoted by a hat.
 or probabilistic: the equation will not provide and exact output. Error can be due to different factors: There could be other factors beside growth that explain IMR. There might be measurement error. Or just randomness. Virtually all regression analysis uses sample data. Alpha and Beta are unobtainable and only estimated using sample statistic a and b. All estimated and predicted quantities are denoted by a hat.")
9
2. Estimación por Mínimos Cuadrados Ordinarios (OLS) – min(SSE)
Estimando el intercepto a: The minimisation is done by partial differentiation of SSE., with respect to a and in turn to b.

10
2. Estimación por Mínimos Cuadrados Ordinarios (OLS) – min(SSE)
Estimando la pendiente b: Note the similarity between the slope coefficient and the correlation coefficient. B is not independent of the units of measurement.

11
2. Estimación de a y b: ejemplo
Supongamos que queremos verificar la predicción de Mundell-Fleming sobre el efecto del PIB del resto del mundo en una economía pequeña como Uruguay.

12
2. Estimación de a y b: Supongamos que queremos verificar la predicción de Mundell-Fleming sobre el efecto del PIB del resto del mundo en una economía pequeña como Uruguay.

14
3. Interpretando los coeficientes
: es el intercepto : es la pendiente Interpretación: -2.391: nivel esperado del GDP de Uruguay independientemente del GDP de Mercosur, en logarítmo (no muy importante aquí). 0.947: efecto marginal de una unidad adicional de GDP en Mercosur en el GDP de Uruguay Relación positiva, como lo predice la teoría de Mundell-Fleming.
 : efecto marginal de una unidad adicional de GDP en Mercosur en el GDP de Uruguay. Relación positiva, como lo predice la teoría de Mundell-Fleming.")
15
4. Bondad de ajuste Mientras mayor es la proporción de la varianza de Y explicada por el modelo, mayor será la bondad de ajuste del modelo (R2) The least square approach provides a linear approximation for the relation between the two variables. But: how good is the fit of the regression line? The difference between any observation and the mean value (SST) can be divided into two: That part explained by the model: SSR: sum of squares explained by the Regression The error term: SSE: Sum of squares errors
 can be divided into two: That part explained by the model: SSR: sum of squares explained by the Regression. The error term: SSE: Sum of squares errors.")
16
4. Bondad de ajuste: ejemplo
The least square approach provides a linear approximation for the relation between the two variables. But: how good is the fit of the regression line? The difference between any observation and the mean value (SST) can be divided into two: That part explained by the model: SSR: sum of squares explained by the Regression The error term: SSE: Sum of squares errors Interpretación: 82.8% de la variación del GDP en Uruguay se puede “explicar” por la variación en el GDP de Mercosur (excluyendo Uruguay)
 can be divided into two: That part explained by the model: SSR: sum of squares explained by the Regression. The error term: SSE: Sum of squares errors. Interpretación: 82.8% de la variación del GDP en Uruguay se puede explicar por la variación en el GDP de Mercosur (excluyendo Uruguay)")
17
5. Pruebas de hipótesis / significancia de los coeficientes
¿Cómo hacer inferencias sobre la relación “poblacional” entre X y Y? Pruebas de hipótesis. Estadístico t de Student: Si t > t* (valor estímado > valor crítico), rechazamos la H0 y concluimos que b es signficativamente diferente de cero. Para calcular t, necesitamos el error estándar de b: The R2 is not the only criterion for judging the quality of a regression equation. So far regression was used as a descriptive technique fro the sample data. If we want to draw conclusions for the true relation at the population level we need to do hypothesis testing.
, rechazamos la H0 y concluimos que b es signficativamente diferente de cero. Para calcular t, necesitamos el error estándar de b: The R2 is not the only criterion for judging the quality of a regression equation. So far regression was used as a descriptive technique fro the sample data. If we want to draw conclusions for the true relation at the population level we need to do hypothesis testing.")
18
5. Significancia estadística: ejemplo
Dado que t>t*, rechazamos la hipótesis nula y concluimos que b es significativamente distinta de 0: el GDP en Mercosur afecta el GDP en Uruguay. The R2 is not the only criterion for judging the quality of a regression equation. So far regression was used as a descriptive technique for the sample data. If we want to draw conclusions for the true relation at the population level we need to do hypothesis testing. We are able to test for alternative hypothesis. For instance we could test H0: beta=1; Ha= beta no= 1 We could also test hypothesis about the intercept. For that we need an expression for the standard error of the intercept, available in the lecture notes.

Presentaciones similares


>")


 a partir de los valores de x (variable.>")


