Descargar la presentación
La descarga está en progreso. Por favor, espere

1
Megatendencias Globales en la Producción de Carne
Juan Carlos Bello Fernández Elanco Animal Health

2
Megatendencias 1- Disponibilidad y Costo de Insumos 2- Proyecciones de Consumo y Producción de Carne 3- Uso de la tecnología en la Producción

3
Megatendencia #1 Disponibilidad y Costo de Insumos

4
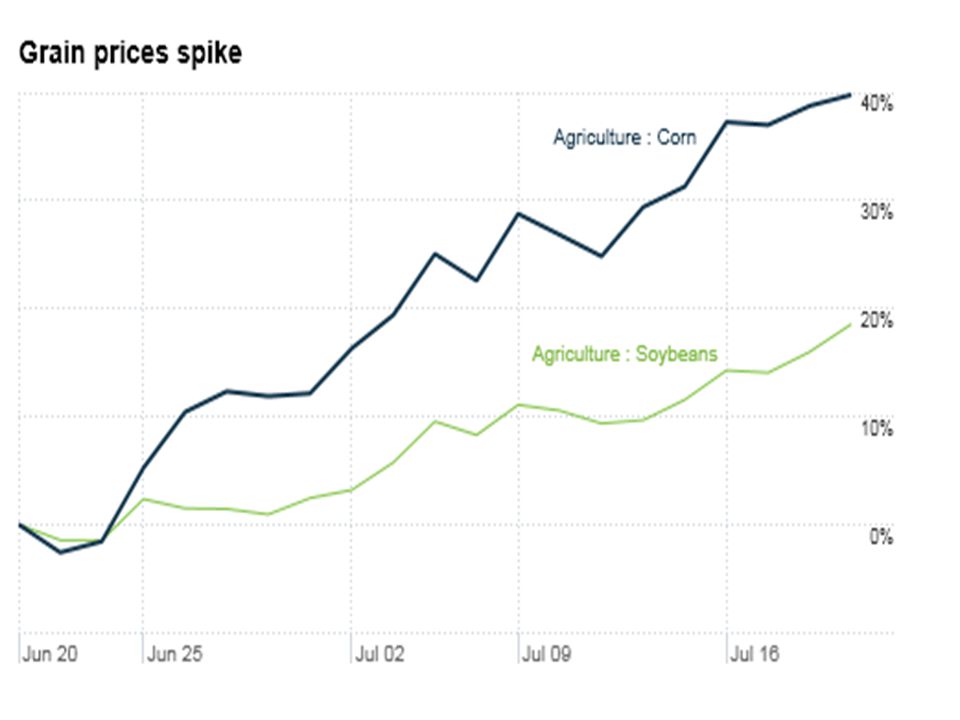
Variabilidad en el costo
Los costos de producción de la avicultura se han elevado como consecuencia de los altos precios de los granos, pues en el país se importa gran parte del requerimiento del sector y deben pagar 40 dólares por tonelada adicionales Es claro que la variabilidad en el costo a través del mundo es muy grande y depende de la disponibilidad y precio de la materia prima.

12
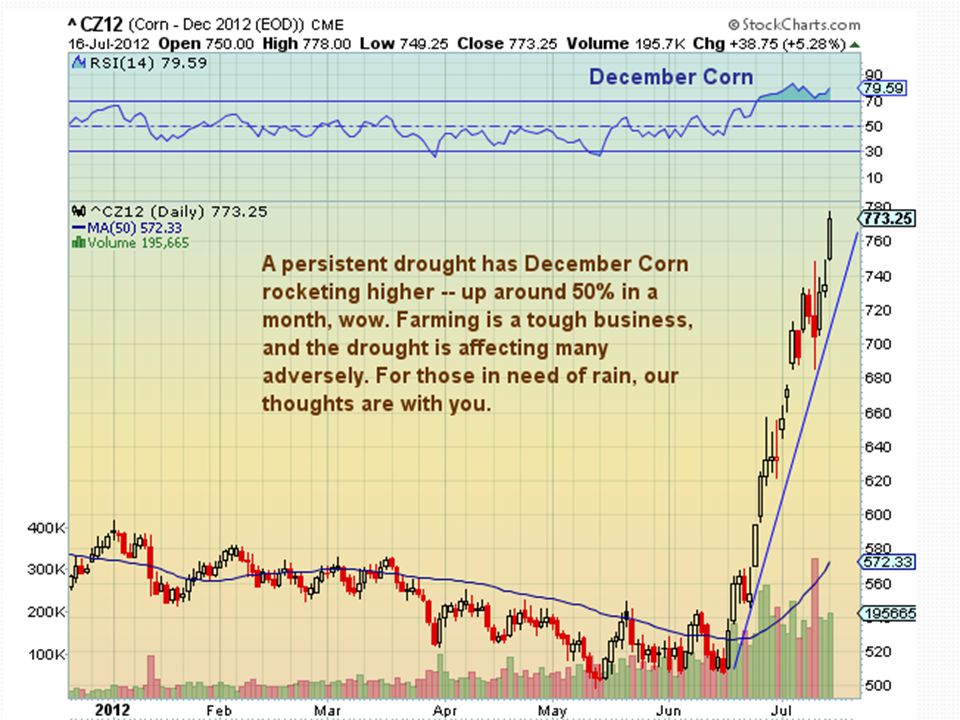
Nuevo Escenario El nuevo escenario se esta readaptando a factores que no se habían conjuntado antes: Precio de los Energéticos Condiciones climáticas Especulación

13
Nuevo Escenario Volatilidad Inestabilidad Alguien sabe que va a pasar mañana??

14
Escenario de Desafío En escenarios de desafío como el actual, las empresas buscan principalmente maximizar la rentabilidad de sus operaciones, y esta eficiencia puede ser alcanzada al someter a control la mayor parte de variables que encarecen nuestro costo de producción.

15
Megatendencia #2 Proyecciones de Consumo y Producción de Carne

16
La producción de alimentos entre 1961-2010 superó el crecimiento demográfico
A Revolução da Pecuária - Quadro atualizado Jan2012.xlsx

17
Hay suficiente comida en el mundo, pero eso no significa buena o justa distribución
Elaborated by ODConsulting based on data by FAOSTAT and GIEWS/FAO. Food supply selected countries and areas of the world.xlsx

18
Ásia & África están lejos de esa situación
El consumo de carne aumenta con la renta, pero hay un nivel de saturación a partir de que el consumo de carne se mueve hacia los lados. Ásia & África están lejos de esa situación Elaborated by ODConsulting based on data by FAOSTAT and GIEWS/FAO. Food supply selected countries and areas of the world 2009

19
La dieta humana evoluciona para una mayor ingesta de productos de origen animal
17,7% 15,3% 82,3% World Vegetal and Animal products xlsx 84,7%

20
¿Cuales son esos productos de origen animal?
Las carnes lideran los productos de origen animal en la composición de calorías World Vegetal and Animal products xlsx

21
+ Ingresos = + Carnes Dietary Energy & Income y 2010 animal & vegetal products pct

22
+ Ingresos = (+ Carnes – Granos)
Dietary Energy & Income 70-07animal & vegetal products pct.xlsx Fuente: PIB per cápita World Bank – Consumo:Balances Alimentarios, FAOSTAT

23
Porcentaje de crecimiento de la producción de carne para 2019 en comparación con la producción promedio de Meat production growth dominated by Developing Countries.xlsx Fonte: OECD/FAO (2012), OECD-FAO Agricultural Outlook 2012, Producción de Carnes
, OECD-FAO Agricultural Outlook 2012, Producción de Carnes.")
24
Los Países en Desarrollo son los vectores de la demanda, producción y las importaciones de carnes
Principais Alimentos a 2021.xlsx Fonte: OECD/FAO (2012), OECD-FAO Agricultural Outlook 2012,
, OECD-FAO Agricultural Outlook 2012,")
25
Se confirman los Países en Desarrollo como los vectores de la demanda, producción y las importaciones de carnes Meat production growth dominated by Developing Countries.xlsx Fonte: OECD/FAO (2012), OECD-FAO Agricultural Outlook 2012,
, OECD-FAO Agricultural Outlook 2012,")
26
Agricultura es fotosíntesis, tierra arable y sobretodo agua,

27
Los recursos de agua son escasos y finitos
Los recursos de agua son escasos y finitos. 70% del consumo de agua se verifica en la agricultura. El libre comercio vendrá del desequilibrio entre la distribución de la populación y los recursos de agua en mundo. Agua será fuente de conflictos en el futuro como petróleo lo es en el día de hoy.

28
Los pronósticos segun la OECD-FAO
Projeções por tipos de carnes a 2021.xlsx Fonte: OECD/FAO (2012), OECD-FAO Agricultural Outlook 2012,
, OECD-FAO Agricultural Outlook 2012,")
29
Carne de Ave Previsiones a 2021
Juan Carlos Bello Fernández Elanco Animal Health

30
CARNE DE AVES – PRODUCCIÓN MUNDIAL EN 000 TM
Projeções por tipos de carnes a 2021

31
PAÍSES EN DESARROLLO AUMENTARÁN SU PARTICIPACIÓN EN LA PRODUCCIÓN MUNDIAL DE CARNES DE AVES
Projeções por tipos de carnes a 2021

32
Las carnes de aves presentan el más acentuado crecimiento
37,1% -11,5% 145,1% Dietary Energy & Income y 2010 animal & vegetal products pct 32,7%

33
Crece la producción mundial de carnes y las
Especies más Eficientes Ganan Terreno Produção Mundial de Carnes por espécies 1948 a 2011 base de dados e projeções a 2050 May 2012.xlsx

34
Evolución de la producción mundial de carne por especie 000 ton
Evolución de la producción mundial de carne por especies ton Produção Mundial de Carnes por espécies 1948 a 2011 base de dados e projeções a 2050 May 2012.xlsx Fonte: Elaborado por ODConsulting a partir de dados da FAOSTAT, FAO Statistic Division e Giews

35
Las carnes de aves han ganado espacio en los últimos 50 años
Produção Mundial de Carnes por espécies 1948 a 2011 base de dados e projeções a 2050 jun2011.xlsx

36
Y serán la especie dominante en el futuro
Produção Mundial de Carnes por espécies 1948 a 2011 base de dados e projeções a 2050 jun2011.xlsx

37
Megatendencia #3 Uso de la tecnología en la Producción

38
Alimento inocuo, accesible y abundante
4/15/2017 Alimento inocuo, accesible y abundante Hello, I am (name and title here). I am excited to be here today. (Offer a compliment to the group, or state a reason you admire/respect the group/audience). I appreciate that you are taking the time today to talk about food production, to consider the ramifications of efficient food production, and to participate in the food chain. (Consider giving a little of your personal background, where you grew up, what you’ve done professionally, etc.). Creative\Clients\Elanco\ Presentation PPT\ Presentation (for approval) v14.ppt
. I am excited to be here today. (Offer a compliment to the group, or state a reason you admire/respect the group/audience). I appreciate that you are taking the time today to talk about food production, to consider the ramifications of efficient food production, and to participate in the food chain. (Consider giving a little of your personal background, where you grew up, what you’ve done professionally, etc.). Creative\Clients\Elanco\ Presentation PPT\ Presentation (for approval) v14.ppt.")
39
Tecnología y elección: las claves
4/15/2017 Tecnología y elección: las claves The Three Rights: Food, Choice, Sustainability Creative\Clients\Elanco\ Presentation PPT\ Presentation (for approval) v14.ppt
 v14.ppt.")
40
La situación es crítica, debemos actuar
4/15/2017 La situación es crítica, debemos actuar El momento es ahora: Precios récord del petróleo. Precios altos de commodities. Temores por inseguridad alimentaria. Reestricciones de comercio. Recesión global. The paper I’m talking about today refers to a growing wave of global hunger. What does that mean? It means that today, the world finds itself in a precarious position. The U.N. Food and Agriculture Organization reports that agriculture, globally, has experienced a “severe shock” in recent years because of1: Record high oil prices Commodity price spikes Food security fears Trade restrictions The most serious global recession since the 1930s Source: “OECD-FAO Agricultural Outlook Highlights.” Organisation for Economic Co-operation and Development and Food and Agriculture Organization of the United Nations. Creative\Clients\Elanco\ Presentation PPT\ Presentation (for approval) v14.ppt
 v14.ppt.")
41
El reto del sector agropecuario
4/15/2017 El reto del sector agropecuario I mentioned population. We’re on our way to 9 billion people by By then, our growing global population will require an estimated 100% more food1,2 than we produce today. Unfortunately, we won’t have 100% more land available. The U.N. Food and Agriculture Organization (FAO) reports that added farmland will help produce only 20% of the additional food our planet will need in 2050, and 10% will come from increased cropping intensity. Accordingly, the FAO concludes that 70% of the world’s additional food needs can be produced only with new and existing agricultural technologies.3 Sources: 1. Green, R., et al. January “Farming and the Fate of Wild Nature.” Science 307: 2. Tilman, D., et al. August “Agricultural sustainability and intensive production practices.” Nature 418: 3. “World agriculture: toward 2015/2030.” United Nations Food and Agriculture Organization, Rome. Accessed December 2, <ftp://ftp.fao.org/docrep/fao/004/y3557e/y3557e.pdf>. Creative\Clients\Elanco\ Presentation PPT\ Presentation (for approval) v14.ppt
 reports that added farmland will help produce only 20% of the additional food our planet will need in 2050, and 10% will come from increased cropping intensity. Accordingly, the FAO concludes that 70% of the world’s additional food needs can be produced only with new and existing agricultural technologies.3. Sources: 1. Green, R., et al. January Farming and the Fate of Wild Nature. Science 307: Tilman, D., et al. August Agricultural sustainability and intensive production practices. Nature 418: World agriculture: toward 2015/ United Nations Food and Agriculture Organization, Rome. Accessed December 2, <ftp://ftp.fao.org/docrep/fao/004/y3557e/y3557e.pdf>. Creative\Clients\Elanco\ Presentation PPT\ Presentation (for approval) v14.ppt.")
42
Tecnología... La piedra angular para que
el alimento seguro, accesible y abundante sea una relidad First, what do we mean by technology? WHO defines technology as 3 key things: Practices: Doing it better by the way you do it. Products: Using new and better tools, equipment, etc. Genetics: Improving the actual plants and animals we grow. So why technology: Technology increases efficiency . . . Efficiency drives abundance and affordability . . . Which are key to reducing hunger by making more food available to more people, particularly when you consider nearly half our global population lives on less than $2 a day. Tecnología = prácticas, productos, genética 42

43
La tecnología asegura tres derechos
4/15/2017 La tecnología asegura tres derechos Creative\Clients\Elanco\ Presentation PPT\ Presentation (for approval) v14.ppt
 v14.ppt.")
44
Alimentación, un derecho humano básico
4/15/2017 Alimentación, un derecho humano básico So let’s begin by talking about food, a basic human right. Creative\Clients\Elanco\ Presentation PPT\ Presentation (for approval) v14.ppt
 v14.ppt.")
45
La ola mundial del hambre
4/15/2017 La ola mundial del hambre That’s like 60 jumbo jets falling out of the sky each and every day. We would not allow such a thing to continue. Will we allow this grave social injustice to continue, and potentially grow worse in the coming months and years? Will we continue to deny access to technology to many of the people who can help address this injustice, the world’s food producers? Equivalente a 60 jumbo jets cayendo… diariamente Creative\Clients\Elanco\ Presentation PPT\ Presentation (for approval) v14.ppt
 v14.ppt.")
46
4/15/2017 Hambre escondida El “hambre escondida” en países desarrollados afecta a: 1 de 7 1 de 5 A common response to this is, yeah, but I don’t know anyone that’s died of hunger. There’s no one dying from hunger in [NAME CITY YOU’RE IN]. Though the majority of residents in industrialized nations aren’t faced with the threat of starvation, many deal with random bouts of food insecurity where they spend significant effort identifying when and where the next meal will come. Finding nutrition is a daily challenge for an increasing number of children in first-world countries, affecting: Two of every five children living in inner London1 One in every eight children in Paris2 One in every seven children in Japan3 One in every five children in the United States4 Sources: 1. The Poverty Site “Children in low-income households.” Accessed November 2, < 2. The Connexion “13% of French live in poverty.” Accessed November 2, < 3. Fackler, M “Japan Tries to Face Up to Growing Poverty Problem.” The New York Times. Accessed November 2, < 4. U.S. Census Bureau “Income, Poverty, and Health Insurance Coverage in the United States: 2009.” 1 de 8 2 de 5 Creative\Clients\Elanco\ Presentation PPT\ Presentation (for approval) v14.ppt
 v14.ppt.")
47
Ingesta Diaria Recomendada de leche
4/15/2017 Los países en desarrollo requieren proteina Ingesta Diaria Recomendada de leche “Uno de mis sueños es que cada chino, especialmente los niños, tengan leche suficiente todos los días." Wen Jiabao, Premier chino, 2007 So what does food security look like in an emerging economy like China? A few years ago, the Chinese Premier set a vision that every child would have sufficient milk. Currently, Chinese get about 100g of milk each day. Their goal is to triple that, to 300g. That’s still less than half of what Americans get every day. As they began to determine what that meant from an infrastructure standpoint, they quickly realized it’s not possible with current production standards. For China to reach a level of milk consumption that’s half of the U.S. level, it would require the equivalent of 4 U.S. dairy herds! China struggles with the feed and water resources to meet the needs of their current herd. Clearly, they need new solutions and access to technology to meet this growing demand. Sources: Suber, T. July “Export Perspectives: It’s Official: Consume More Dairy.” Export Profile. 19.2:2. U.S. Dairy Export Council. USDA < Accessed March 18, RDI = 3 cups~735 g. USDA “China Agriculture and Economic Data: National Data Results.” < Accessed March 22, 2010. 100g 300g = 36M vacas (con el actual sistema de producción)3 The Three Rights: Food, Choice, Sustainability Creative\Clients\Elanco\ Presentation PPT\ Presentation (for approval) v14.ppt
3. The Three Rights: Food, Choice, Sustainability. Creative\Clients\Elanco\ Presentation PPT\ Presentation (for approval) v14.ppt.")
48
Elección, un derecho del consumidor
4/15/2017 Elección, un derecho del consumidor Now let’s talk about the second right: Choice, a consumer right. Why does choice matter? What’s it got to do with ensuring everyone has enough food? Creative\Clients\Elanco\ Presentation PPT\ Presentation (for approval) v14.ppt
 v14.ppt.")
49
Elección, un derecho del consumidor
4/15/2017 Elección, un derecho del consumidor ¿Los consumidores quieren tecnología? How many of you have heard the perception that consumers don’t want technology used in food production? Despite the imperative of making food affordable for the world’s poor, the myth persists that a majority of people are adamantly opposed to the use of cost-reducing food production technologies. The data, however, show otherwise. Creative\Clients\Elanco\ Presentation PPT\ Presentation (for approval) v14.ppt
 v14.ppt.")
50
Elección, un derecho del consumidor
4/15/2017 Elección, un derecho del consumidor International Consumer Attitudes Study (ICAS) revisión de actitudes y comportamientos del consumidor Criterios: Preguntas no guiadas/abiertas Datos de gasto Elanco continued to hear this perception, so we decided to study it. We commissioned independent researchers to determine how and why people around the world make the food choices they make—and, more specifically, how they regard food-production technologies. We call it the International Consumer Attitudes Study, or ICAS. This is a simple review of any studies we could find, this is not a meta analysis and was not rigorously peer-reviewed. We talked to several experts to determine how to analyze data on this topic and two key criteria emerged to help minimize bias. First, you have to use unaided questions, meaning, consumers had to provide their own answers to open-ended questions, rather than selecting answers from a list. Unaided questions give no prompts on how to answer. Tradeoff scenarios where also considered, such as, “Which is the most important factor in your food purchase decision?” Forcing the consumer to tradeoff other factors is a fair simulation of real-life decisions. To contrast reported attitudes with actual behaviors, consumer spending data was included in the analysis. Creative\Clients\Elanco\ Presentation PPT\ Presentation (for approval) v14.ppt
 revisión de actitudes y comportamientos del consumidor. Criterios: Preguntas no guiadas/abiertas. Datos de gasto. Elanco continued to hear this perception, so we decided to study it. We commissioned independent researchers to determine how and why people around the world make the food choices they make—and, more specifically, how they regard food-production technologies. We call it the International Consumer Attitudes Study, or ICAS. This is a simple review of any studies we could find, this is not a meta analysis and was not rigorously peer-reviewed. We talked to several experts to determine how to analyze data on this topic and two key criteria emerged to help minimize bias. First, you have to use unaided questions, meaning, consumers had to provide their own answers to open-ended questions, rather than selecting answers from a list. Unaided questions give no prompts on how to answer. Tradeoff scenarios where also considered, such as, Which is the most important factor in your food purchase decision Forcing the consumer to tradeoff other factors is a fair simulation of real-life decisions. To contrast reported attitudes with actual behaviors, consumer spending data was included in the analysis. Creative\Clients\Elanco\ Presentation PPT\ Presentation (for approval) v14.ppt.")
51
Elección, un derecho del consumidor
4/15/2017 Elección, un derecho del consumidor 28 estudios 26 países Más de 97,000 consumidores The ICAS analysis started with more than 70 research sources. From those sources, the researchers selected and analyzed 27 reports and studies about consumer attitudes and behaviors from around the world. Those findings were followed up with a validation study by The Nielsen Company. All told, these studies represent the opinions of more than 97,000 people in 26 countries. Here’s what we found. Source: 1. See Appendix. The Three Rights: Food, Choice, Sustainability Creative\Clients\Elanco\ Presentation PPT\ Presentation (for approval) v14.ppt
 v14.ppt.")
52
ICAS: Comprador de alimento
4/15/2017 ICAS: Comprador de alimento 28 estudios 26 países Más de 97,000 consumidores 95% of consumers are what we call food buyers. When they go to the store they’re looking for 3 basic factors – taste, cost and nutrition. They are either neutral about or supportive of using efficiency-enhancing technologies to grow food. Sources: 1. See Appendix. The Three Rights: Food, Choice, Sustainability Creative\Clients\Elanco\ Presentation PPT\ Presentation (for approval) v14.ppt
 v14.ppt.")
53
ICAS: Comprador de estilo
4/15/2017 ICAS: Comprador de estilo 28 estudios 26 países Más de 97,000 consumidores Another 4% are lifestyle buyers, people who purchase food based largely on lifestyle factors. They’re driven by preferences like vegetarianism, or they want organic, local or gourmet. For these buyers money is not much of a concern. [Note to presenter: Click mouse at this point to show blended ray of Food Buyer & Lifestyle Buyer] Research shows that the two groups (food buyers and lifestyle buyers) are not mutually exclusive. [Provide an example of something that you buy that is a lifestyle choice, Jeff uses Starbucks coffee. Then explain another habit where you’re simply looking for price or the right nutrition.] The Three Rights: Food, Choice, Sustainability Creative\Clients\Elanco\ Presentation PPT\ Presentation (for approval) v14.ppt
 are not mutually exclusive. [Provide an example of something that you buy that is a lifestyle choice, Jeff uses Starbucks coffee. Then explain another habit where you’re simply looking for price or the right nutrition.] The Three Rights: Food, Choice, Sustainability. Creative\Clients\Elanco\ Presentation PPT\ Presentation (for approval) v14.ppt.")
54
ICAS: Comprador de estilo
4/15/2017 ICAS: Comprador de estilo 28 estudios 26 países Más de 97,000 consumidores The Three Rights: Food, Choice, Sustainability Creative\Clients\Elanco\ Presentation PPT\ Presentation (for approval) v14.ppt
 v14.ppt.")
55
The Three Rights: Food, Choice, Sustainability
4/15/2017 ICAS: Marginal 28 estudios 26 países Más de 97,000 consumidores That leaves a very small percentage, the “fringe.” These are the people who participate in protests, picketing and rallies to “protect” consumers from modern food-production “threats.” Although these groups are sometimes little more than a few like-minded people skilled at gaining access to the media, they can be effective at influencing local, regional and even national media—and legislation. This is group wants to impose their social agenda on every one else. To put it simply, 99 percent of consumers care what they eat. 1 percent care about what you and I eat. Their rationales for these limits and bans are typically driven by emotion and fear rather than facts, and their actions ignore the moral right of the hungry to be fed. Instead of helping others, then, the “fringe” are condemning more of the world’s poor and hungry to death. But we can learn from them. To them, these issues are personal. They will move from commitment to conviction to action. We need to do the same. Sources: 1. See Appendix. The Three Rights: Food, Choice, Sustainability Creative\Clients\Elanco\ Presentation PPT\ Presentation (for approval) v14.ppt
 v14.ppt.")
56
Factores que influencian las compras de alimentos EUA (2010)
4/15/2017 ICAS: Comprador de alimento Más de 26,000 hogares encuestados en Octubre, 2010 98% de las compras se basan en: Sabor Costo Nutrición1 Factores que influencian las compras de alimentos EUA (2010) Sabor 43.48% Otros 1.99% Nutrición 23.02% Costo 31.51% Once we gathered those findings, we wanted to validate to understand if we were on the right path. So in October of last year, the Nielson Company surveyed more than 26,000 U.S. households, which is projectable to the entire U.S. population. The results verified the earlier findings. 98 percent of consumers said taste, cost or nutrition was most important to them. If asked: What about safety? Most already assume food they buy is safe Source: 1. The Nielsen Company October Online Views Survey. Research commissioned by Elanco. Según una encuesta de Nielsen en 2010 en hogares de EU, los factores más importantes en su decisión de compra de alimentos son sabor, costo y nutrición. Creative\Clients\Elanco\ Presentation PPT\ Presentation (for approval) v14.ppt
 Sabor % Otros. 1.99% Nutrición % Costo % Once we gathered those findings, we wanted to validate to understand if we were on the right path. So in October of last year, the Nielson Company surveyed more than 26,000 U.S. households, which is projectable to the entire U.S. population. The results verified the earlier findings. 98 percent of consumers said taste, cost or nutrition was most important to them. If asked: What about safety Most already assume food they buy is safe. Source: 1. The Nielsen Company October Online Views Survey. Research commissioned by Elanco. Según una encuesta de Nielsen en 2010 en hogares de EU, los factores más importantes en su decisión de compra de alimentos son sabor, costo y nutrición. Creative\Clients\Elanco\ Presentation PPT\ Presentation (for approval) v14.ppt.")
57
Ventas globales de alimento
4/15/2017 Ventas globales de alimento Ventas globales de alimento sin uso de tecnología1 Un nicho importante, pero muy pequeño Data shows global sales of foods grown without most forms of technology represent about: 3% of sales in the USA1 2% of sales in Europe1 1.4% of sales worldwide1 These figures are not expected to change significantly in the next few years, rising only slightly. So although organic food is a growing market, it still represents only a sliver—a tiny fraction—of overall food sales.1 It’s an important market opportunity, but one to keep in perspective. Source: 1. Datamonitor “Global Food and Organic Retail for Years 2009 and 2014.” Creative\Clients\Elanco\ Presentation PPT\ Presentation (for approval) v14.ppt
 v14.ppt.")
58
Un cambio en la política de USA?
4/15/2017 Un cambio en la política de USA? “Farmers in the EU must be allowed to choose the tools they need to thrive, and our citizens must be free to select from the widest variety of food choices made possible by our modern food production enterprises.”1 Paolo De Castro, Chairman of the European Parliament Committee on Agriculture and Rural Development The tide in Europe, after many years, appears to be turning away from the extreme viewpoint and toward a more fact-based approach to protecting consumer rights and capitalizing on the capacity of technology to help end starvation in third-world nations. Paolo De Castro, chairman of the European Parliament’s committee on Agriculture and Rural Development, concurs. (Share quote on slide.) Sources: 1. De Castro, P Professional correspondence. Creative\Clients\Elanco\ Presentation PPT\ Presentation (for approval) v14.ppt
 Sources: 1. De Castro, P Professional correspondence. Creative\Clients\Elanco\ Presentation PPT\ Presentation (for approval) v14.ppt.")
59
Sostenibilidad, derecho a proteger el medio ambiente
4/15/2017 Sostenibilidad, derecho a proteger el medio ambiente Finally, sustainability, which is environmentally right. If we’re going to feed a growing global population while maintaining a broad variety of choices for consumers, we must sustain our resources – the land, water and air. We’ve made a lot of improvement, but we must continue to improve. To ensure our growing global population has sufficient food, we’re going to need to grow food with maximum efficiency and with as little impact on the environment as possible. Creative\Clients\Elanco\ Presentation PPT\ Presentation (for approval) v14.ppt
 v14.ppt.")
60
Los líderes en sostenibilidad
4/15/2017 Los líderes en sostenibilidad “Para alimentar a 9 mil millones de personas y conservar el planeta, debemos congelar la huella de la producción de alimento.”1 Dr. Jason Clay, World Wildlife Fund As Dr. Jason Clay from the World Wildlife Fund notes, (read quote from slide). World Wildlife has also created a Living Earth index that suggests we’re already living at 1.3x the carrying capacity of our Earth. And we have 200,000 new mouths to feed every day. Use of technology will be critical to meet this increasing demand while protecting our resources. Sources: 1. Feedstuffs FoodLink “Ag must ‘freeze food footprint.’” Accessed January 20, < Creative\Clients\Elanco\ Presentation PPT\ Presentation (for approval) v14.ppt
. World Wildlife has also created a Living Earth index that suggests we’re already living at 1.3x the carrying capacity of our Earth. And we have 200,000 new mouths to feed every day. Use of technology will be critical to meet this increasing demand while protecting our resources. Sources: 1. Feedstuffs FoodLink Ag must ‘freeze food footprint.’ Accessed January 20, < sid=&nm=&type=news&mod=News&mid=9A02E3B96F2A415ABC72CB5F516B4C10&tier=3&nid=963CDC E AB1F>. Creative\Clients\Elanco\ Presentation PPT\ Presentation (for approval) v14.ppt.")
61
Producción de leche y eficiencia
4/15/2017 Producción de leche y eficiencia Comparado con 1944, producir hoy 1 litro de leche requiere: 65% menos agua1 1944 65% menos 2007 The data speaks for itself. For example, today one cow produces the same amount of milk it took five cows to produce in 19441, which means we need far fewer cows to meet the global demand for milk. Because of this improved efficiency, modern production of every gallon of milk requires 65% less water and 90% less land than it did in Source: 1. Capper, J., Cady, R. and Bauman, D “The environmental impact of dairy production: 1944 compared with 2007.” J. Anim. Sci. 87: Creative\Clients\Elanco\ Presentation PPT\ Presentation (for approval) v14.ppt
 v14.ppt.")
62
Producción de leche y eficiencia
4/15/2017 Producción de leche y eficiencia Comparado con 1944, producir hoy 1 litro de leche requiere: 65% menos agua1 90% menos terreno1 1944 90% menos 2007 The data speaks for itself. For example, today one cow produces the same amount of milk it took five cows to produce in 19441, which means we need far fewer cows to meet the global demand for milk. Because of this improved efficiency, modern production of every gallon of milk requires 65% less water and 90% less land than it did in Source: 1. Capper, J., Cady, R. and Bauman, D “The environmental impact of dairy production: 1944 compared with 2007.” J. Anim. Sci. 87: Creative\Clients\Elanco\ Presentation PPT\ Presentation (for approval) v14.ppt
 v14.ppt.")
63
Producción de leche y eficiencia
4/15/2017 Producción de leche y eficiencia Comparado con 1944, cada litro de leche producido hoy genera: 76% menos excremento1 1944 76% menos 76% less manure is being produced for each gallon of milk sold.1 The “carbon footprint” for a gallon of milk in 2007 was 63% lower than it was in Source: 1. Capper, J., Cady, R. and Bauman, D “The environmental impact of dairy production: 1944 compared with 2007.” J. Anim. Sci. 87: 2007 Creative\Clients\Elanco\ Presentation PPT\ Presentation (for approval) v14.ppt
 v14.ppt.")
64
Producción de leche y eficiencia
4/15/2017 Producción de leche y eficiencia 1944 Comparado con 1944, cada litro de leche producido hoy genera: 76% menos excremento1 63% menos huella de carbono1 63% menos 2007 76% less manure is being produced for each gallon of milk sold.1 The “carbon footprint” for a gallon of milk in 2007 was 63% lower than it was in Source: 1. Capper, J., Cady, R. and Bauman, D “The environmental impact of dairy production: 1944 compared with 2007.” J. Anim. Sci. 87: Creative\Clients\Elanco\ Presentation PPT\ Presentation (for approval) v14.ppt
 v14.ppt.")
65
Beef production & efficiency
4/15/2017 Beef production & efficiency Cada libra de carne de res producida hoy en USA requiere 14% menos agua1 1977 14% less per pound of beef than in 1977 2007 The story is similar for every pound of beef found in the meat case. Each pound of beef produced in the United States today requires 14% less water and 34% less land than it required in Source: 1. Capper, J. July “Comparing the Environmental Impact of the U.S. Beef Industry in 1977 to 2007.” Abstract presentation at the American Society of Animal Science meetings. Creative\Clients\Elanco\ Presentation PPT\ Presentation (for approval) v14.ppt
 v14.ppt.")
66
Beef production & efficiency
4/15/2017 Beef production & efficiency Cada libra de carne de res producida hoy en USA requiere 14% menos agua1 34% menos terreno1 1977 34% less per pound of beef than in 1977 2007 The story is similar for every pound of beef found in the meat case. Each pound of beef produced in the United States today requires 14% less water and 34% less land than it required in Source: 1. Capper, J. July “Comparing the Environmental Impact of the U.S. Beef Industry in 1977 to 2007.” Abstract presentation at the American Society of Animal Science meetings. Creative\Clients\Elanco\ Presentation PPT\ Presentation (for approval) v14.ppt
 v14.ppt.")
67
Beef production & efficiency
4/15/2017 Beef production & efficiency Comparada con 1977, la producción de carne de res actual: Genera 20% menos excremento1 1977 20% less per pound of beef than in 1977 2007 On a pound-for-pound basis, modern beef production generates 20% less manure than in The “carbon footprint” for each pound of beef is 18% smaller than it was in Sources: 1. Capper, J. July “Comparing the Environmental Impact of the U.S. Beef Industry in 1977 to 2007.” Abstract presentation at the American Society of Animal Science meetings. Creative\Clients\Elanco\ Presentation PPT\ Presentation (for approval) v14.ppt
 v14.ppt.")
68
Beef production & efficiency
4/15/2017 Beef production & efficiency 1977 Comparada con1977, la produccion de carne de res actual: Genera 20% menos excremento1 18% huella de carbono1 18% less per pound of beef than in 1977 2007 On a pound-for-pound basis, modern beef production generates 20% less manure than in The “carbon footprint” for each pound of beef is 18% smaller than it was in Sources: 1. Capper, J. July “Comparing the Environmental Impact of the U.S. Beef Industry in 1977 to 2007.” Abstract presentation at the American Society of Animal Science meetings. Creative\Clients\Elanco\ Presentation PPT\ Presentation (for approval) v14.ppt
 v14.ppt.")
69
La tecnología asegura tres derechos
4/15/2017 La tecnología asegura tres derechos The facts supporting the use of food technologies are there. The science is there. Consumer data supports the economic argument. Regional studies illuminate the sociopolitical reality that widespread concern about food production technologies is, in fact, a myth. All these facts align to support a position on which we can all agree: We must commit ourselves to ensuring that a global supply of safe, affordable and abundant food can become a reality in our lifetime. Thank you. Creative\Clients\Elanco\ Presentation PPT\ Presentation (for approval) v14.ppt
 v14.ppt.")
70
Reservas de granos bajos La necesidad de actuar ahora es urgente
4/15/2017 Conclusiones Reservas de granos bajos La necesidad de actuar ahora es urgente La población creciendo Altos precios de alimentos Tenemos una ventana de oportunidad The need to move boldly forward to address world hunger has never been more pressing. Grain stocks are at startlingly low levels. Food prices are at record highs and expected to grow for months to come. The population is sprinting toward 9 billion. We have a unique window of opportunity: a spotlight has been brought to the issue and we still have time to act. But the need is urgent! Creative\Clients\Elanco\ Presentation PPT\ Presentation (for approval) v14.ppt
 v14.ppt.")
71
Para Reflexionar Sanidad animal seguirá siendo el grande enemigo
Sin ciencia y tecnología no tendremos como atender al aumento de la demanda, pero sobretodo la mudanza en la dieta humana con mayor consumo de productos animales Los neo-ludistas deben ser activa e estructuradamente combatidos Recursos naturales serán los factores determinantes para establecer Que especies prevalecerán Quien producirá, exportará e importará Quien será quien Aumento y concentración de rebaños aumentarán los riesgos sanitarios Bioseguridad + Bioseguridad + Bioseguridad

72
Para Reflexionar Productos de origen animal exigen 4 veces más recursos naturales que los productos de origen vegetal Eses recursos naturales son conocidos, finitos y serán insuficientes para atender la migración de la dieta humana para mayor ingestión de productos animales, sobretodo carnes Por supuesto que esa visión pesimista, presente frecuentemente en la prensa solo se confirmará suponiendo, en una visión neo-ludista¹, la realidad de producción del día de hoy No obstante, la consecuencia mayor de esa inevitable mayor ingestión de carnes será una migración para las especies más eficientes y pollo y acuicultura son los grandes ganadores

73
7 razones para tener esperanza
4/15/2017 7 razones para tener esperanza está ocurriendo. 99% de los consumidores Quieren: sabor, accesibilidad, nutrición & elección. 500 personas influencian la industria de los alimentos. Datos consistentes en las 5 principales áreas de toma de decisión: Ciencia, Economía, Sociedad, Medio Ambiente & Consumidor Un cambio positivo en la industria relativo al uso de tecnología en el último año. Consistencia regulatoria, innovación record y acceso. ’09-’10 Recesión (Seguridad alimentaria) ’11-’12 Altos costos (Costos de alimentos) Ventana de oportunidad 1. Creative\Clients\Elanco\ Presentation PPT\ Presentation (for approval) v14.ppt
 ’11-’12 Altos costos. (Costos de alimentos) Ventana de oportunidad. 1. Creative\Clients\Elanco\ Presentation PPT\ Presentation (for approval) v14.ppt.")
74
The Three Rights: Food, Choice, Sustainability
4/15/2017 Tiempo de actuar So, what can you do. First, personalize the issue. Get out of your bubble and see hunger up close. Until you do, these will remain just statistics on a powerpoint slide and someone else’s problem to solve. Engage your networks, the people you know in the food chain. Help spead the message. It’s time to make our voice heard. Finally, support the 99 percent by delivering what they want and need. The Three Rights: Food, Choice, Sustainability Creative\Clients\Elanco\ Presentation PPT\ Presentation (for approval) v14.ppt
 v14.ppt.")
75
Tecnología y elección: las claves
4/15/2017 Tecnología y elección: las claves The Three Rights: Food, Choice, Sustainability Creative\Clients\Elanco\ Presentation PPT\ Presentation (for approval) v14.ppt
 v14.ppt.")
76
Visite PlentyToThinkAbout.org y participe
4/15/2017 Tiempo de actuar Visite PlentyToThinkAbout.org y participe Acceda a documentos Videos y demás herramientas interactivas As I mentioned, the information in this presentation comes from a new white paper. You can download and read the complete white paper at: You can also view a short video on the topic. And there are easy features allowing you to share it with your Facebook, Twitter and other networks, or them to a friend. Creative\Clients\Elanco\ Presentation PPT\ Presentation (for approval) v14.ppt
 v14.ppt.")
77
4/15/2017 Elanco and the diagonal color bar are registered trademarks of Eli Lilly and Company. © 2011 Elanco Animal Health. All rights reserved. GM0032 (04/11) Creative\Clients\Elanco\ Presentation PPT\ Presentation (for approval) v14.ppt
 Creative\Clients\Elanco\ Presentation PPT\ Presentation (for approval) v14.ppt.")
78
Preguntas?? Muchas Gracias por su Atención

Presentaciones similares


La porcicultura de México compite por el mercado Mexicano contra la porcicultura más poderosa del mundo: La de Estados Unidos. 2) El mercado.>")


