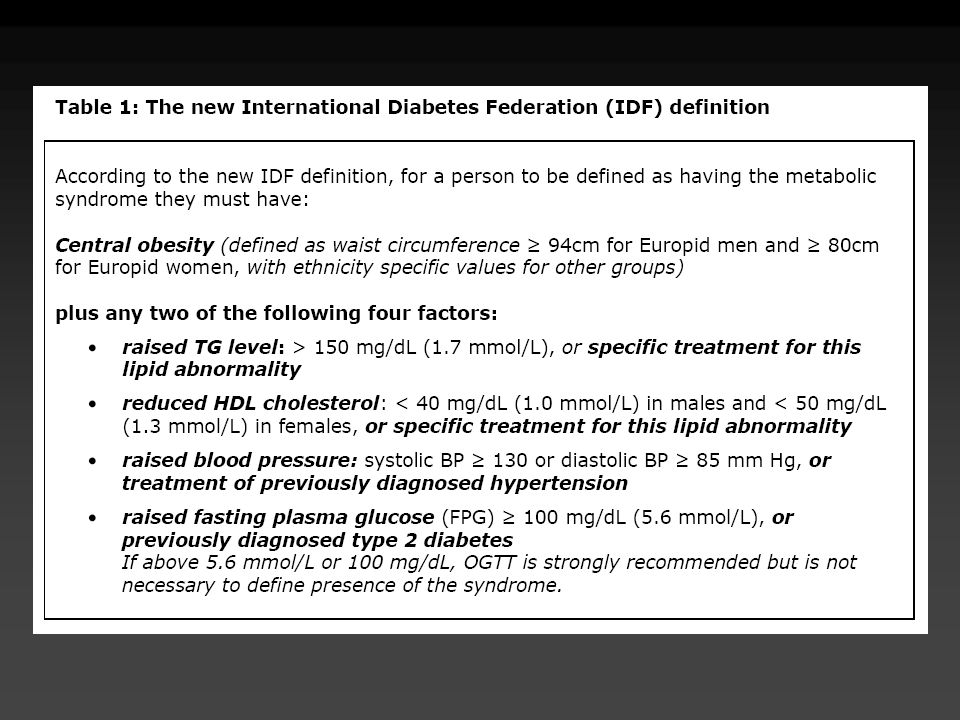
Descargar la presentación
La descarga está en progreso. Por favor, espere

1
MECANISMO DE SECRECIÓN DE INSULINA
SULFONILUREAS MECANISMO DE SECRECIÓN DE INSULINA SULFONILUREAS despolarización GLUCOSA AMINOÁCIDOS cierra (ATP) (ADP) Ca++ (Ca++ ) PROINSULINA METABOLISMO K+ INSULINA & PEPTIDO - C Kahn CR, Weir GC, Eds. Lea & Febiger, 1994, p Feinglos MN, Bethel MA. Med Clin North Am 82:757-90,1998.
 (ADP) Ca++ (Ca++ ) PROINSULINA. METABOLISMO. K+ INSULINA & PEPTIDO - C. Kahn CR, Weir GC, Eds. Lea & Febiger, 1994, p Feinglos MN, Bethel MA. Med Clin North Am 82:757-90,1998.")
2
CARACTERÍSTICAS FARMACOLÓGICAS DE LAS SU
Glimepirida 500 RENAL 60% BILIAR 40% 2 Dosis media equivalente (mg) Dosis diaria máxima (mg) Vida media (h) Duración de la acción (h) Vía de eliminación RENAL 50% BILIAR 50% RENAL 70% BILIAR 30% RENAL 80% BILIAR 20% Medicamento Renal RENAL 70% BILIAR 30% Clorpropamida Glibenclamida Gliclazida Tolbutamida Glipizida 250 5 80 3000 8 20 320 40 4-6 9 36 10 6-12 2-4 24 60 18-24 16-24 Existen distintas SU en el mercado latinoamericano, tanto de primera como de segunda generación, entre las cuales hay diferencias en la vida media, la duración de acción, las vías de eliminación y dosis. Estas diferencias deben ser consideradas al momento de tomar la decisión clínica de usar una SU, en particular para disminuir los efectos adversos. Lebovitz,HE: Oral Antidiabetic Agents. In Joslin’s Diabetes Mellitus. 13th ed. Kahn CR, Weir GC, Eds. Lea & Febiger, 1994, p Zimmerman BR. Endocrinol Met Clin North Am 26(3): ,1997 Feinglos MN, Bethel MA. Med Clin North Am 82:757-90,1998
 Dosis diaria máxima (mg) Vida media (h) Duración de la acción (h) Vía de eliminación. RENAL 50% BILIAR 50% RENAL 70% BILIAR 30% RENAL 80% BILIAR 20% Medicamento. Renal. RENAL 70% BILIAR 30% Clorpropamida. Glibenclamida. Gliclazida. Tolbutamida. Glipizida Existen distintas SU en el mercado latinoamericano, tanto de primera como de segunda generación, entre las cuales hay diferencias en la vida media, la duración de acción, las vías de eliminación y dosis. Estas diferencias deben ser consideradas al momento de tomar la decisión clínica de usar una SU, en particular para disminuir los efectos adversos. Lebovitz,HE: Oral Antidiabetic Agents. In Joslin’s Diabetes Mellitus. 13th ed. Kahn CR, Weir GC, Eds. Lea & Febiger, 1994, p Zimmerman BR. Endocrinol Met Clin North Am 26(3): ,1997. Feinglos MN, Bethel MA. Med Clin North Am 82:757-90,1998.")
3
DOSIS Y CARACTERÍSTICAS FARMACOLÓGICAS DE LAS MEGLITINIDAS
Medicamento Dosis Diaria recomendada en c/comida Dosis Media Equivalente Dosis Diaria Mx (mg) Duración de la Acción Repaglinida 0,5 mg mg 0,5 - 4 mg h Nateglinida 120 mg mg mg h La repaglinida y la nateglinida están indicadas para el control post-prandial de la glucosa. Las dosis recomendadas se aprecian en la diapositiva. Scheen AJ. Drugs 54: ,1997 Dunn CJ, Faulds D. Drugs 60: ,2000 Luna B, Feinglos MN. Am Fam Fhysician 63: ,2001
 Duración de la Acción. Repaglinida 0,5 mg 16 mg 0,5 - 4 mg h. Nateglinida 120 mg 720 mg 120 mg h. La repaglinida y la nateglinida están indicadas para el control post-prandial de la glucosa. Las dosis recomendadas se aprecian en la diapositiva. Scheen AJ. Drugs 54: ,1997. Dunn CJ, Faulds D. Drugs 60: ,2000. Luna B, Feinglos MN. Am Fam Fhysician 63: ,2001.")
4
INHIBIDORES DE ALFA-GLUCOSIDASA (ACARBOSA Y MIGLITOL)
Mejores candidatos Hiperglucemia post-prandial importante No recomendados en Enfermedad hepática o intestinal Dosis inicial 25 mg 1x por 2 a 4 semanas 25 mg 2x por 2 a 4 semanas 25 mg 3x por 2 a 4 semanas 50 mg 3x, si es necesario Ajuste de dosis Semanal, si es necesario o tolerado Método de monitorización Automonitorización, incluyendo post-prandial Efectos adversos: Alteraciones gastrointestinales Los mejores candidatos para acarbosa y miglitol son pacientes obesos con hiperglicemia post-prandial. No se recomiendan en pacientes con enfermedad hepática y/o intestinal. Para una mejor adherencia y tolerancia se sugiere comenzar con 25 mg e ir aumentando gradualmente hasta una dosis promedio de 300 mg. El ajuste de la dosis puede ser semanal y el automonitoreo de la glucosa post-prandial es mandatorio. Los efectos adversos más comunes son gastrointestinales (malestar intestinal, flatulencia, diarrea). Cuando se asocian con hipoglucemiantes orales puede presentarse hipoglucemia. Medical Management of Type 2 Diabetes. 4th ed. Alexandria, Va: American Diabetes Association; 1998:1-139 DeFronzo RA. Ann Intern Med 1999;131:
. Cuando se asocian con hipoglucemiantes orales puede presentarse hipoglucemia. Medical Management of Type 2 Diabetes. 4th ed. Alexandria, Va: American Diabetes Association; 1998: DeFronzo RA. Ann Intern Med 1999;131:")
5
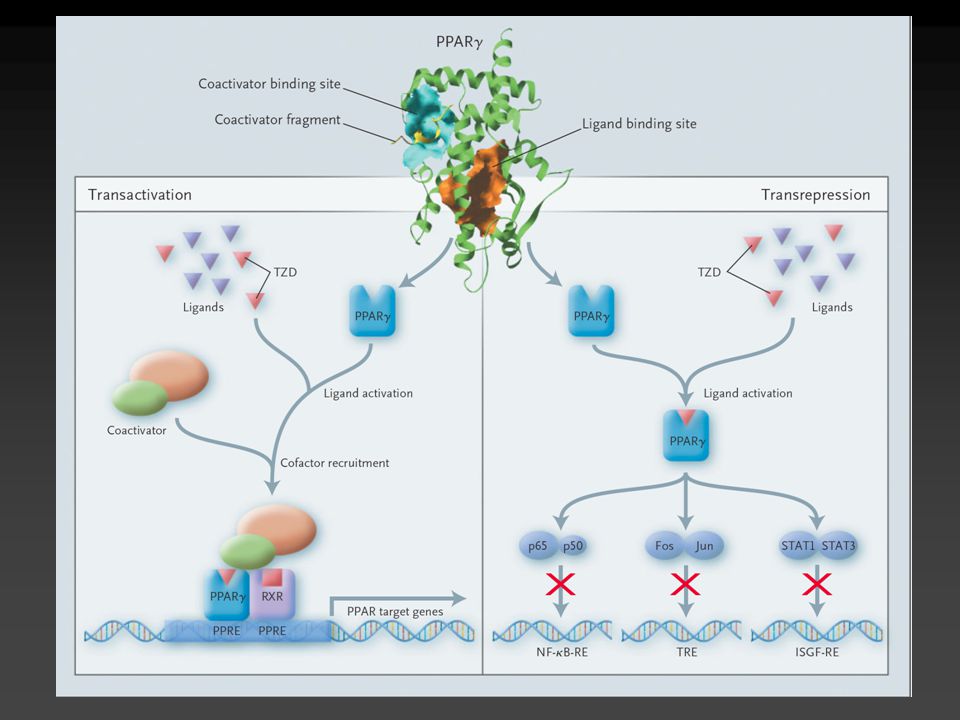
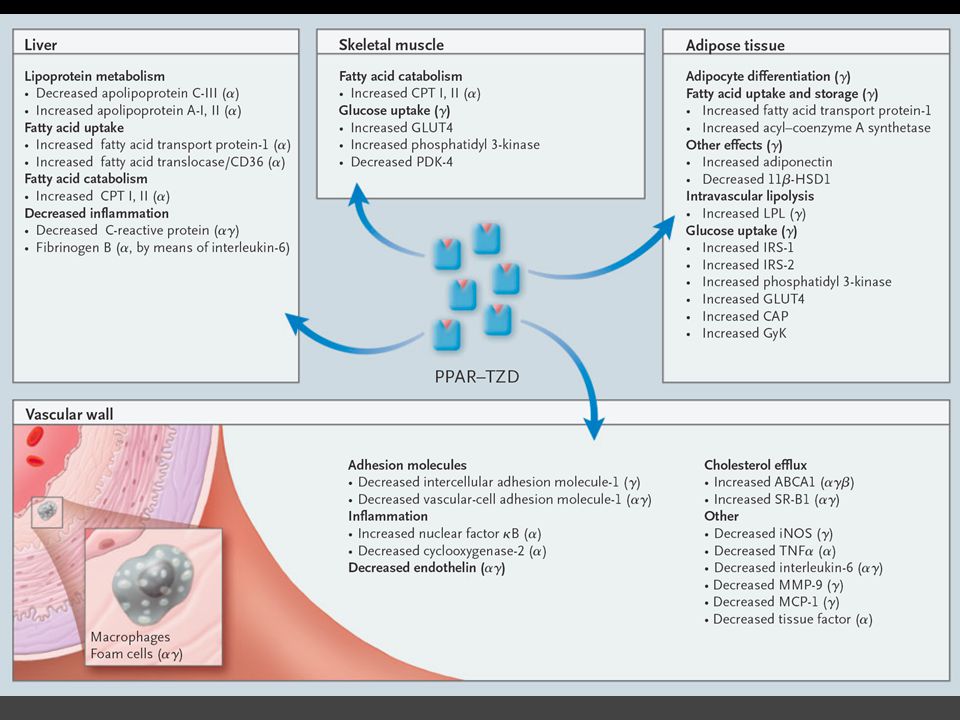
Peroxisome Proliferator Activated Receptor
Factor que activa o reprime transcripción de genes Localizado en adipocitos, hígado, músculo, riñón Incrementado en sujetos con obesidad, diabetes mellitus Correlaciona con concentraciones séricas de insulina Nature 1998; 391: Nature 1998; 391: 82-86

6
PPAR Fibratos Tiazolidinedionas Acidos grasos PPAR-a PPAR-g PPAR-d
Ligandos Fibratos Tiazolidinedionas Acidos grasos PPAR-a PPAR-g PPAR-d Receptor Efecto en: Expresión de lipoproteínas Proliferacion de peroxisomas Síntesis de lipidos Metabolismo de carbohidratos Saltiel AR et al. Diabetes. 1996;45:

9
NEJM 2007; 356:

10
El control de la glucemia es un proceso multiorgánico
Sistema Nervioso Central Ingesta de alimentos y saciedad Regulación hormonal Tejidos Periféricos Diana Recaptación y utilización de la glucosa Hígado Gluconeogénesis Páncreas Células : Secreción de insulina Células : Secreción de glucagón Sistema Digestivo Absorción de glucosa Hormonas Incretinas Flint A, et al. J Clin Invest ;101: ; Unger RH. N Eng J Med. 1971;285: ; Mitrakou A, et al. Diabetes. 1990;39: ; Saltiel AR, et al. Diabetes. 1996;45: 10

11
La hiperglucemia posprandial está relacionada con la secreción alterada de insulina y la supresión del glucagón Glucosa oral 20 Sujetos Control Pacientes con Diabetes Tipo 2 15 Glucosa (mmol/L) 10 DISCUSSION Plasma glucose values for patients with type 2 diabetes were in the hyperglycaemic range postprandially and during fasting. In patients with type 2 diabetes, peak postprandial glucose levels are reached later and take longer to return to baseline. BACKGROUND The 3 curves shown on this slide were derived from a study of 10 subjects with type 2 diabetes and 10 matched control subjects given an oral glucose load. 5 Glucosa oral -60 60 120 180 240 300 420 Tiempo (min) Glucosa oral 360 75 300 60 Insulina (p mol/L) 240 Glucagón (f mol/L) 180 45 120 30 60 15 -60 60 120 180 240 300 -60 60 120 180 240 300 Tiempo (min) Tiempo (min) Mitrakou A, et al. Diabetes. 1990;39: Copyright © 1990 American Diabetes Association. De Diabetes, Vol 39, 1990; Reproducido con permiso de The American Diabetes Association. 11
 10. DISCUSSION. Plasma glucose values for patients with type 2 diabetes were in the hyperglycaemic range postprandially and during fasting. In patients with type 2 diabetes, peak postprandial glucose levels are reached later and take longer to return to baseline. BACKGROUND. The 3 curves shown on this slide were derived from a study of 10 subjects with type 2 diabetes and 10 matched control subjects given an oral glucose load. 5. Glucosa oral Tiempo (min) Glucosa oral Insulina (p mol/L) 240. Glucagón (f mol/L) Tiempo (min) Tiempo (min) Mitrakou A, et al. Diabetes. 1990;39: Copyright © 1990 American Diabetes Association. De Diabetes, Vol 39, 1990; Reproducido con permiso de The American Diabetes Association. 11.")
12
Respuesta insulínica alterada de primera fase en la Diabetes Tipo 2
Sujetos Control Pacientes con Diabetes Tipo 2 Glucosa IV 120 100 100 80 DISCUSSION In contrast to normal insulin release in response to intravenous glucose, there is essentially no first phase insulin response in subjects with type 2 diabetes. BACKGROUND This slide represents acute insulin response to intravenous glucose (20 g) in weight and gender-matched subjects (with diabetes, n=15; without diabetes, n=18). 80 Liberación de Insulina (U/mL) Liberación de Insulina (U/mL) 60 Glucosa IV 60 40 40 20 20 -40 -30 -20 -10 10 20 30 -40 -30 -20 -10 10 20 30 Tiempo (min) Tiempo (min) Porte D. Diabetes. 1991;40; Copyright © 1991 American Diabetes Association. De Diabetes, Vol 40, 1991; Reproducido con permiso de The American Diabetes Association. 12
 in weight and gender-matched subjects (with diabetes, n=15; without diabetes, n=18). 80. Liberación de Insulina (U/mL) Liberación de Insulina (U/mL) 60. Glucosa IV Tiempo (min) Tiempo (min) Porte D. Diabetes. 1991;40; Copyright © 1991 American Diabetes Association. De Diabetes, Vol 40, 1991; Reproducido con permiso de The American. Diabetes Association. 12.")
13
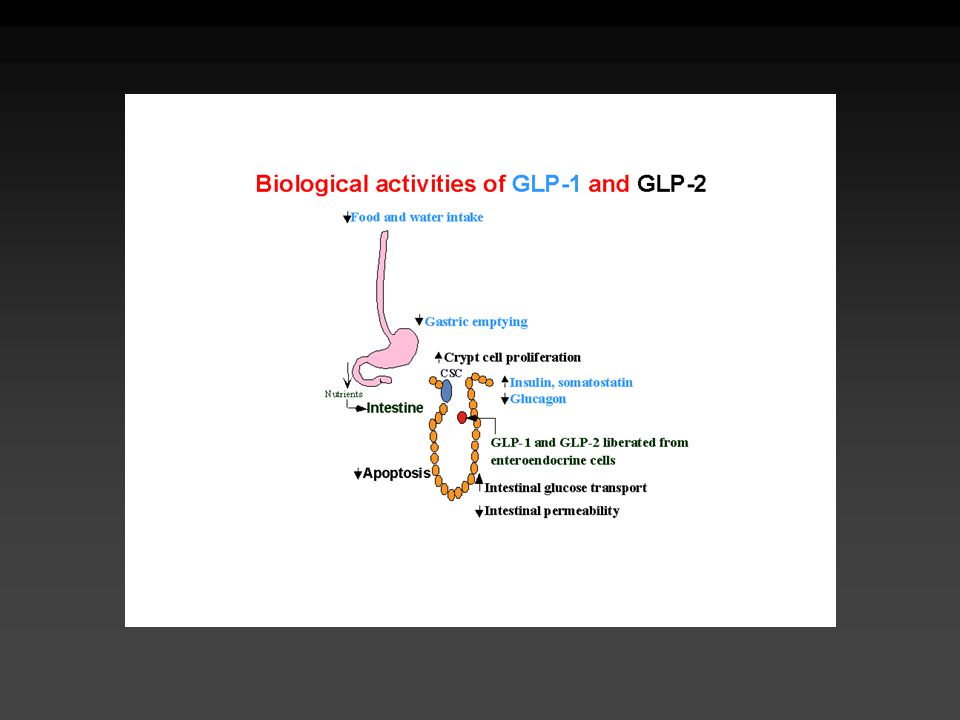
GLP-1: regulación y acciones
Tracto GI GLP-1 células neuroendocrinas en íleon Alimento Inervación neural GLP-1 80 40 Alimento Musculo esquelético Captación de Glucosa Insulina 500 400 300 200 100 Insulina Retardo del Vaciamiento gastrico CNS ingesta de alimento Islotes pancreáticos Disminuye producción hepática de glucosa Glucagon

14
Las incretinas GLP-1 y GIP
Se han identificado dos incretinas principales responsables del efecto incretina: Péptido 1 similar al glucagón (GLP-1) Sintetizado y liberado desde las células L del íleo y cólon Múltiples sitios de acción: células y pancreáticas, tracto GI, SNC y corazón Las acciones son mediadas por receptores Polipéptido insulinotrópico glucodependiente (GIP) Sintetizado y liberado principalmente desde las células K del yeyuno y duodeno Sitio de acción: predominantemente las células pancreáticas; también actúa sobre los adipocitos, células progenitoras neuronales, y osteoblastos BACKGROUND The active form of GLP-1 has 30 amino acids. The active form of GIP has 42 amino acids. Drucker DJ. Diabetes Care. 2003;26: ; Thorens B. Diabetes Metab. 1995;21: ; Baggio LL, Drucker DJ. Gastroenterology. 2007;132: ; Nyberg J, et al. J Neurosci. 2005;25:
 Sintetizado y liberado desde las células L del íleo y cólon. Múltiples sitios de acción: células y pancreáticas, tracto GI, SNC y corazón. Las acciones son mediadas por receptores. Polipéptido insulinotrópico glucodependiente (GIP) Sintetizado y liberado principalmente desde las células K del yeyuno y duodeno. Sitio de acción: predominantemente las células pancreáticas; también actúa sobre los adipocitos, células progenitoras neuronales, y osteoblastos. BACKGROUND. The active form of GLP-1 has 30 amino acids. The active form of GIP has 42 amino acids. Drucker DJ. Diabetes Care. 2003;26: ; Thorens B. Diabetes Metab. 1995;21: ; Baggio LL, Drucker DJ. Gastroenterology. 2007;132: ; Nyberg J, et al. J Neurosci. 2005;25:")
15
Acciones de GLP-1 y GIP en el metabolismo de glucosa e insulina
Secretadas desde las células L en el íleon y el colon Secretado desde las células K en el duodeno Estimula la secreción de insulina dependiente de glucosa de las células beta Efectos significativos en la proliferación y diferenciación de la célula beta (estudios in vitro y en animales) Reducción del apetito y del peso corporal Sin efectos significativos en la saciedad o el peso corporal Inhibe la secreción de glucagon dependiente de glucosa en las células alfa Aparentemente no inhibe la secreción de glucagon de las células alfa Inhibición del vaciamiento gástrico Mínimo efecto en el vaciamiento gástrico GLP-1 and GIP are the Two Major Incretins Characteristics of Incretins It must be released from the intestine in response to ingestion of food, particularly carbohydrates. The circulating concentration of the hormone must be sufficiently high enough to stimulate the release of insulin. The release of insulin by the physiological levels of the hormone occurs only at elevated glucose levels (glucose-dependent). GIP (glucose-dependent insulinotropic factor, originally called gastric inhibitory peptide) and GLP-1 (glucagon-like peptide-1) are the two hormones fulfilling the three characteristics that qualified them as incretin hormones.1 (pg 90, C1, P3.4). Meier JJ et al. Best Pract Res Clin End Met. 2004;18:587–606 Drucker DJ. Diabetes Care. 2003;26:2929–2940. Wideman RD et al. Horm Metab Res. 2004;36:782–786. Reference: 1. Creutzfeldt. 2005; pg. 90 C1, P3,4. 15
 Reducción del apetito y del peso corporal. Sin efectos significativos en la saciedad o el peso corporal. Inhibe la secreción de glucagon dependiente de glucosa en las células alfa. Aparentemente no inhibe la secreción de glucagon de las células alfa. Inhibición del vaciamiento gástrico. Mínimo efecto en el vaciamiento gástrico. GLP-1 and GIP are the Two Major Incretins. Characteristics of Incretins. It must be released from the intestine in response to ingestion of food, particularly carbohydrates. The circulating concentration of the hormone must be sufficiently high enough to stimulate the release of insulin. The release of insulin by the physiological levels of the hormone occurs only at elevated glucose levels (glucose-dependent). GIP (glucose-dependent insulinotropic factor, originally called gastric inhibitory peptide) and GLP-1 (glucagon-like peptide-1) are the two hormones fulfilling the three characteristics that qualified them as incretin hormones.1 (pg 90, C1, P3.4). Meier JJ et al. Best Pract Res Clin End Met. 2004;18:587–606. Drucker DJ. Diabetes Care. 2003;26:2929–2940. Wideman RD et al. Horm Metab Res. 2004;36:782–786. Reference: 1. Creutzfeldt. 2005; pg. 90 C1, P3,")
16
La infusión continua de GLP-1 redujo considerablemente las concentraciones diurnas de glucosa
Salina (pacientes con diabetes) GLP-1 (pacientes con diabetes) Control (sujetos sin diabetes) 16 14 12 DISCUSSION Patients with type 2 diabetes who received a continuous infusion of GLP-1 showed a reduction in mean fasting and postprandial glucose concentrations compared with patients who received a saline infusion. The glucose curve in patients with diabetes receiving GLP-1 was similar to that of the subjects without diabetes. BACKGROUND The primary objective of this study was to determine the feasibility and efficacy of controlling glucose levels in patients with type 2 diabetes by continuous infusion of GLP-1. Seven patients with type 2 diabetes received, in a 3-way crossover design: a 19-hour (h) continuous intravenous (IV) infusion of GLP-1 (1.2 pmol/kg/min administered from 2200 to 1700 hours), an overnight IV infusion of GLP-1 (1.2 pmol/kg/min from 2200 to 0730 hours), and IV saline (from 2200 to 1700 hours). Six control subjects without diabetes completed the IV saline protocol. Results from the 19-h continuous IV infusions are shown here. All subjects consumed three standard meals during the day (breakfast at 0800, lunch at 1200, and snack at 1500 hours). The investigators concluded that continuous GLP-1 administration may be a useful therapy in type 2 diabetes. 10 Glucosa (mmol/L) 8 6 4 2 Desayuno Comida Snack 22 24 2 4 6 8 10 12 14 16 Tiempo (hora) N = 14; Infusión IV de GLP-1 (1,2 pmol/min/kg). Rachman J, et al. Diabetologia. 1997;40: Reproducido con permiso de Springer-Verlag.
 GLP-1 (pacientes con diabetes) Control (sujetos sin diabetes) DISCUSSION. Patients with type 2 diabetes who received a continuous infusion of GLP-1 showed a reduction in mean fasting and postprandial glucose concentrations compared with patients who received a saline infusion. The glucose curve in patients with diabetes receiving GLP-1 was similar to that of the subjects without diabetes. BACKGROUND. The primary objective of this study was to determine the feasibility and efficacy of controlling glucose levels in patients with type 2 diabetes by continuous infusion of GLP-1. Seven patients with type 2 diabetes received, in a 3-way crossover design: a 19-hour (h) continuous intravenous (IV) infusion of GLP-1 (1.2 pmol/kg/min administered from 2200 to 1700 hours), an overnight IV infusion of GLP-1 (1.2 pmol/kg/min from 2200 to 0730 hours), and IV saline (from 2200 to 1700 hours). Six control subjects without diabetes completed the IV saline protocol. Results from the 19-h continuous IV infusions are shown here. All subjects consumed three standard meals during the day (breakfast at 0800, lunch at 1200, and snack at 1500 hours). The investigators concluded that continuous GLP-1 administration may be a useful therapy in type 2 diabetes. 10. Glucosa (mmol/L) Desayuno. Comida. Snack Tiempo (hora) N = 14; Infusión IV de GLP-1 (1,2 pmol/min/kg). Rachman J, et al. Diabetologia. 1997;40: Reproducido con permiso de Springer-Verlag.")
17
Morfología de Islotes Humanos Preservados con GLP-1 In Vitro
Islotes pancreáticos cultivados en ausencia de GLP-1, perdieron su organización tras 5 días Día 5, el 45% de los islotes en los cultivos control habían perdido su estructura 3-D Sólo el 15% de los islotes tratados con GLP-1 perdieron su estructura 3-D a los 5 días (P <0,01 vs control) Control GLP-1 Día 1 Día 3 Día 5 DISCUSSION GLP-1 added to freshly isolated human islets preserved morphology and inhibited cell apoptosis. BACKGROUND The aim of the study was to investigate the capability of GLP-1 to preserve the viability and function of freshly isolated human islets. Human islets were cultured for 5 days in the presence or absence of GLP-1 (10 nM, added every 12 hours). Islets were collected from donors but were unsuitable for transplantation due to serologic testing or inadequate islet yield. GLP-1 was also found to increase the expression of cell-protective factors (Bcl-2) and decrease the expression of pro-apoptotic factors (caspase-3). Farilla L, et al. Endocrinology. 2003;144: Copyright 2003, The Endocrine Society ©.
 Control. GLP-1. Día 1. Día 3. Día 5. DISCUSSION. GLP-1 added to freshly isolated human islets preserved morphology and inhibited cell apoptosis. BACKGROUND. The aim of the study was to investigate the capability of GLP-1 to preserve the viability and function of freshly isolated human islets. Human islets were cultured for 5 days in the presence or absence of GLP-1 (10 nM, added every 12 hours). Islets were collected from donors but were unsuitable for transplantation due to serologic testing or inadequate islet yield. GLP-1 was also found to increase the expression of cell-protective factors (Bcl-2) and decrease the expression of pro-apoptotic factors (caspase-3). Farilla L, et al. Endocrinology. 2003;144: Copyright 2003, The Endocrine Society ©.")
18
GLP-1 y GIP son degradadas por la enzima DPP-4
Comida Secreción Intestinal de GIP y GLP-1 Enzima DPP-4 GIP-(1-42) GLP-1(7-36) Activos GIP-(3-42) GLP-1(9-36) Inactivo GLP-1 and GIP Are Degraded by the DPP-4 Enzyme GLP-1 and GIP are rapidly metabolized and degraded by the enzyme DPP-4.1-3 GLP-1 and GIP have short biological half-lives. DPP-4 is a widely expressed enzyme present on cells in most tissues, including the kidney, gastrointestinal tract, biliary tract and liver, placenta, uterus, prostate, skin and, of potential relevance to the clinical use of inhibitors, lymphocytes (immune function) and endothelial cells (inactivation of circulating peptides). The expression of DPP-4 in specific tissues or as a circulating soluble form, is widely modulated in the setting of specific diseases or tissue injury and inflammation.4 GLP-2 which is shown to be highly intestinotrophic (proliferates the intestinal epithelium) in animals (mice) is also degraded by DPP-4. There has been reports of cases of glucagonoma and bowel growth which show that massively elevated levels of circulating GLP-2 are associated with mucosal hyperplasia in the jejunum.5 GLP-2 does not have any effect on appetite or food intake in humans.6 (pg 1912, C1, P1). Inactivación Rápida Vida media* GLP-1 ~ 2 minutos GIP ~ 5 minutos Acción de GIP y GLP-1 Deacon CF et al. Diabetes. 1995;44:1126–1131. Meier JJ et al. Diabetes ; 53: References: 1. Deacon CF, Nauck MA, Toft-Nielsen M et al. Both subcutaneously and intravenously administered glucagon-like peptide I are rapidly degraded from the NH2-terminus in type II diabetic patients and in healthy subjects. Diabetes. 1995;44:1126–1131. 2. Kieffer TJ, McIntosh CHS, Pederson RA. Degradation of glucose-dependent insulinotropic polypeptide and truncated glucagon-like peptide 1 in vitro and in vivo by dipeptidyl peptidase IV. Endocrinology. 1995;136:3585–3596. 3. Deacon CF, Johnsen AH, Holst JJ. Degradation of glucagon-like peptide-1 by human plasma in vitro yields an N-terminally truncated peptide which is a major endogenous metabolite in vivo. J Clin Endocrinol Metab. 1995;80:952–957. 4. Drucker DJ. Expert Opin. Investig Drugs. 2003;12:87-100). 5. Byrne MM et al. Intestinal Proliferation and Delayed Intestinal Transit in a Patient with a GLP-1-, GLP-2- and PYY-Producing Neuroendocrine Carcinoma. Digestion. 2001;63(1):61-68. 6. Badman MK, Flier JS. Science. 2005;307: 18
 GLP-1(7-36) Activos. GIP-(3-42) GLP-1(9-36) Inactivo. GLP-1 and GIP Are Degraded by the DPP-4 Enzyme. GLP-1 and GIP are rapidly metabolized and degraded by the enzyme DPP GLP-1 and GIP have short biological half-lives. DPP-4 is a widely expressed enzyme present on cells in most tissues, including the kidney, gastrointestinal tract, biliary tract and liver, placenta, uterus, prostate, skin and, of potential relevance to the clinical use of inhibitors, lymphocytes (immune function) and endothelial cells (inactivation of circulating peptides). The expression of DPP-4 in specific tissues or as a circulating soluble form, is widely modulated in the setting of specific diseases or tissue injury and inflammation.4. GLP-2 which is shown to be highly intestinotrophic (proliferates the intestinal epithelium) in animals (mice) is also degraded by DPP-4. There has been reports of cases of glucagonoma and bowel growth which show that massively elevated levels of circulating GLP-2 are associated with mucosal hyperplasia in the jejunum.5. GLP-2 does not have any effect on appetite or food intake in humans.6 (pg 1912, C1, P1). Inactivación Rápida. Vida media* GLP-1 ~ 2 minutos. GIP ~ 5 minutos. Acción de GIP y GLP-1. Deacon CF et al. Diabetes. 1995;44:1126–1131. Meier JJ et al. Diabetes. 2004; 53: References: 1. Deacon CF, Nauck MA, Toft-Nielsen M et al. Both subcutaneously and intravenously administered glucagon-like peptide I are rapidly degraded from the NH2-terminus in type II diabetic patients and in healthy subjects. Diabetes. 1995;44:1126– Kieffer TJ, McIntosh CHS, Pederson RA. Degradation of glucose-dependent insulinotropic polypeptide and truncated glucagon-like peptide 1 in vitro and in vivo by dipeptidyl peptidase IV. Endocrinology. 1995;136:3585– Deacon CF, Johnsen AH, Holst JJ. Degradation of glucagon-like peptide-1 by human plasma in vitro yields an N-terminally truncated peptide which is a major endogenous metabolite in vivo. J Clin Endocrinol Metab. 1995;80:952– Drucker DJ. Expert Opin. Investig Drugs. 2003;12:87-100). 5. Byrne MM et al. Intestinal Proliferation and Delayed Intestinal Transit in a Patient with a GLP-1-, GLP-2- and PYY-Producing Neuroendocrine Carcinoma. Digestion. 2001;63(1): Badman MK, Flier JS. Science. 2005;307:")
19
Exenatide Derivado del exendin-4 Resistente a la degradación de DPP-4
Se une al receptor de GLP-1 en islotes Mejoría en control glucémico y reducción de peso Promueve la regeneración y la diferenciación de la célula beta en modelos animales Disminución de la apoptosis Eng J . J Biol Chem 1992 Apr 15;267(11): Parkes DG. Metabolism 2001 May;50(5):583-9 Xu G.Diabetes 1999 Dec;48(12): Biochem Biophys Res Commun 2006; 346:
: Parkes DG. Metabolism 2001 May;50(5): Xu G.Diabetes 1999 Dec;48(12): Biochem Biophys Res Commun 2006; 346:")
20
La Infusión Aguda de Exenatida Restauró la Primera Fase de Secreción de Insulina en Pacientes con Diabetes Tipo 2 Sujetos Sanos, Placebo Diabetes Tipo 2, Placebo Diabetes Tipo 2, Exenatida p = 0,0002 p = 0,0002 Exenatida vs Placebo DISCUSSION Exenatide-treated type 2 diabetes patients had an insulin secretory pattern similar to healthy subjects in both first (0-10 min) and second ( min) phases after glucose challenge compared with saline-treated patients with type 2 diabetes Without exenatide treatment, patients with type 2 diabetes had diminished first-phase insulin secretion compared to healthy control subjects In patients who received continuous insulin infusion followed by either exenatide or saline, an increase in insulin secretion was not observed until after glucose challenge was initiated BACKGROUND This Phase 2, randomised, single-blind, single-centre crossover study was designed to determine whether exenatide could restore a more normal pattern of insulin secretion in subjects with type 2 diabetes Thirteen evaluable patients with type 2 diabetes and 12 healthy weight-matched control subjects were evaluated. Fasting subjects received intravenous (IV) insulin infusion to reach euglycaemia, while control subjects received placebo (saline). Four hours later, patients with diabetes received exenatide or placebo and healthy control subjects received placebo. After 3 hours of study medication infusion, an IV glucose tolerance test (IVGTT) was performed. Plasma insulin, plasma C-peptide, insulin secretion rate, and plasma glucagon were measured. Insulin secretion measurements are shown here. Baseline and demographic characteristics were well balanced between treatment groups: 11 male type 2 diabetes; 9 male controls Mean age 56 ± 7 years type 2 diabetes; 57 ± 9 years controls Mean body mass index (BMI) ± 2.4 kg/m2 type 2 diabetes; 32.0 ± 3.0 kg/m2 controls Mean weight 94 ± 13 kg type 2 diabetes; 97 ± 10 kg controls Mean HbA1c 6.6 ± 0.7% type 2 diabetes; 5.5 ± 0.4% controls Exenatida vs Sanos p = 0,0029 Secreción de Insulina (pmol•kg-1•min-1) Tiempo (min) Media (EE); N = 25. Fehse F, et al. J Clin Endocrinol Metab Nov;90(11): Copyright 2005, The Endocrine Society. 20
 and second ( min) phases after glucose challenge compared with saline-treated patients with type 2 diabetes. Without exenatide treatment, patients with type 2 diabetes had diminished first-phase insulin secretion compared to healthy control subjects. In patients who received continuous insulin infusion followed by either exenatide or saline, an increase in insulin secretion was not observed until after glucose challenge was initiated. BACKGROUND. This Phase 2, randomised, single-blind, single-centre crossover study was designed to determine whether exenatide could restore a more normal pattern of insulin secretion in subjects with type 2 diabetes. Thirteen evaluable patients with type 2 diabetes and 12 healthy weight-matched control subjects were evaluated. Fasting subjects received intravenous (IV) insulin infusion to reach euglycaemia, while control subjects received placebo (saline). Four hours later, patients with diabetes received exenatide or placebo and healthy control subjects received placebo. After 3 hours of study medication infusion, an IV glucose tolerance test (IVGTT) was performed. Plasma insulin, plasma C-peptide, insulin secretion rate, and plasma glucagon were measured. Insulin secretion measurements are shown here. Baseline and demographic characteristics were well balanced between treatment groups: 11 male type 2 diabetes; 9 male controls. Mean age 56 ± 7 years type 2 diabetes; 57 ± 9 years controls. Mean body mass index (BMI) 31.7 ± 2.4 kg/m2 type 2 diabetes; 32.0 ± 3.0 kg/m2 controls. Mean weight 94 ± 13 kg type 2 diabetes; 97 ± 10 kg controls. Mean HbA1c 6.6 ± 0.7% type 2 diabetes; 5.5 ± 0.4% controls. Exenatida vs Sanos. p = 0,0029. Secreción de Insulina. (pmol•kg-1•min-1) Tiempo (min) Media (EE); N = 25. Fehse F, et al. J Clin Endocrinol Metab Nov;90(11): Copyright 2005, The Endocrine Society. 20.")
21
Estudios Clínicos de Fase 3: Exenatida Disminuyó la HbA1c a las 30 Semanas
Placebo 2 x día Exenatida 5 µg 2 x día Exenatida 10 µg 2 x día MET SFU MET + SFU 0,5 0,2 0,1 0,1 DISCUSSION At Week 30, compared to placebo, significant HbA1c reductions were seen in patients treated with exenatide across all 3 AMIGO studies The percentage reduction in HbA1c was greater in patients who received an increased exenatide dose of 10 µg compared to those who received 5 µg exenatide throughout the study Exenatide treatment was associated with reduced HbA1c independent of oral therapy (metformin [MET] and/or sulphonylurea [SFU] ) BACKGROUND The 3 AMIGO studies were undertaken to evaluate the ability of exenatide to improve glycaemic control in patients with type 2 diabetes failing to achieve glycaemic control with maximally effective doses of MET, SFU, or MET + SFU Three 30-week, placebo-controlled, double-blind, Phase 3 studies were completed in the United States This slide presents combined data Subjects with type 2 diabetes (currently taking MET, SFU, or MET + SFU) were randomised to placebo (PBO), 5 µg exenatide BID, or 10 µg exenatide twice daily (BID), N = All subjects also continued current medication. MET study: PBO n = 113, baseline HbA1c = 8.2%; exenatide 5 µg n = 110, baseline HbA1c = 8.3%; exenatide 10 µg n = 113, baseline HbA1c = 8.2% SFU study: PBO n = 123, baseline HbA1c = 8.7%; exenatide 5 µg n = 125, baseline HbA1c = 8.5%; exenatide 10 µg n = 129, baseline HbA1c = 8.6% MET + SFU study: PBO n = 247, baseline HbA1c = 8.5%; exenatide 5 µg n = 245, baseline HbA1c = 8.5%; exenatide 10 µg n = 241, baseline HbA1c = 8.5% The Last Observation Carried Forward (LOCF) method was applied to the data Exenatide was associated with reduced HbA1c independent of disease duration Cambio en la HbA1c (%) -0,5 -0,4 -0,5 * * -0,6 * -1 -0,8 -0,8 -0,9 * * * Población ITT; Media (EE); MET (N = 336), SFU (N = 377), MET + SFU (N = 733); *p <0,005 vs placebo. La HbA1c basal media osciló de 8,2% a 8,7% en todas las ramas del estudio. DeFronzo RA, et al. Diabetes Care. 2005;28: ; Buse JB, et al. Diabetes Care. 2004;27: ; Kendall DM, et al. Diabetes Care. 2005;28: 21
 BACKGROUND. The 3 AMIGO studies were undertaken to evaluate the ability of exenatide to improve glycaemic control in patients with type 2 diabetes failing to achieve glycaemic control with maximally effective doses of MET, SFU, or MET + SFU. Three 30-week, placebo-controlled, double-blind, Phase 3 studies were completed in the United States. This slide presents combined data. Subjects with type 2 diabetes (currently taking MET, SFU, or MET + SFU) were randomised to placebo (PBO), 5 µg exenatide BID, or 10 µg exenatide twice daily (BID), N = All subjects also continued current medication. MET study: PBO n = 113, baseline HbA1c = 8.2%; exenatide 5 µg n = 110, baseline HbA1c = 8.3%; exenatide 10 µg n = 113, baseline HbA1c = 8.2% SFU study: PBO n = 123, baseline HbA1c = 8.7%; exenatide 5 µg n = 125, baseline HbA1c = 8.5%; exenatide 10 µg n = 129, baseline HbA1c = 8.6% MET + SFU study: PBO n = 247, baseline HbA1c = 8.5%; exenatide 5 µg n = 245, baseline HbA1c = 8.5%; exenatide 10 µg n = 241, baseline HbA1c = 8.5% The Last Observation Carried Forward (LOCF) method was applied to the data. Exenatide was associated with reduced HbA1c independent of disease duration. Cambio en la HbA1c (%) -0,5. -0,4. -0,5. * * -0,6. * ,8. -0,8. -0,9. * * * Población ITT; Media (EE); MET (N = 336), SFU (N = 377), MET + SFU (N = 733); *p <0,005 vs placebo. La HbA1c basal media osciló de 8,2% a 8,7% en todas las ramas del estudio. DeFronzo RA, et al. Diabetes Care. 2005;28: ; Buse JB, et al. Diabetes Care. 2004;27: ; Kendall DM, et al. Diabetes Care. 2005;28:")
22
Estudios Clínicos de Fase 3: Exenatida Redujo el Peso Corporal a lo Largo de 30 Semanas
Placebo 2 x día Exenatida 5 µg 2 x día Exenatida 10 µg 2 x día MET SFU MET + SFU 10 20 30 10 20 30 10 20 30 DISCUSSION Combined results from all 3 AMIGO studies show progressive reductions in body weight at Week 30 in patients treated with either 5 µg of exenatide or an increased dose of 10 µg exenatide The greatest weight loss was demonstrated in patients who were taking metformin (MET) and received an increased 10 µg dose of exenatide BACKGROUND The 3 AMIGO studies were undertaken to evaluate the ability of exenatide to improve glycaemic control in patients with type 2 diabetes failing to achieve glycaemic control with maximally effective doses of MET, sulphonylurea (SFU), or MET + SFU Three 30-week, placebo-controlled, double-blind, Phase 3 studies were completed This slide presents combined data Subjects with type 2 diabetes (currently taking MET, SFU, or MET + SFU) were randomised to Placebo (PBO), 5 µg exenatide twice daily (BID), or 10 µg exenatide BID, N = All subjects also continued current medication. MET study: PBO n = 113, baseline weight 100 kg; exenatide 5 µg n = 110, baseline weight 100 kg; exenatide 10 µg n = 113, baseline weight 101 kg SFU study: PBO n = 123, baseline weight 99 kg; exenatide 5 µg n = 125, baseline weight 95 kg; exenatide 10 µg n = 129, baseline weight 95 kg MET + SFU study: PBO n = 247, baseline weight 99 kg; exenatide 5 µg n = 245, baseline weight 97 kg; exenatide 10 µg n = 241, baseline weight 98 kg The Last Observation Carried Forward (LOCF) method was applied to the data Weight change was a secondary endpoint No additional diet and exercise counseling was provided to the study patients in the clinical trials -0,5 * * -1,0 * * -1,5 ** * Cambio en el Peso (kg) * * * -2,0 * * ** -2,5 ** -3,0 ** ** -3,5 Tiempo (semana) Tiempo (semana) Tiempo (semana) Población ITT; Media (EE); MET (N = 336), SFU (N = 377), MET + SFU (N = 733); *p <0,05 vs placebo; **p <0,001 vs placebo. El peso basal medio osciló de 95 kg a 101 kg en todas las ramas del estudio. DeFronzo RA, et al. Diabetes Care. 2005;28: ; Buse JB, et al. Diabetes Care. 2004;27: ; Kendall DM, et al. Diabetes Care. 2005;28: Reproducido con permiso de American Diabetes Association. 22
 and received an increased 10 µg dose of exenatide. BACKGROUND. The 3 AMIGO studies were undertaken to evaluate the ability of exenatide to improve glycaemic control in patients with type 2 diabetes failing to achieve glycaemic control with maximally effective doses of MET, sulphonylurea (SFU), or MET + SFU. Three 30-week, placebo-controlled, double-blind, Phase 3 studies were completed. This slide presents combined data. Subjects with type 2 diabetes (currently taking MET, SFU, or MET + SFU) were randomised to Placebo (PBO), 5 µg exenatide twice daily (BID), or 10 µg exenatide BID, N = All subjects also continued current medication. MET study: PBO n = 113, baseline weight 100 kg; exenatide 5 µg n = 110, baseline weight 100 kg; exenatide 10 µg n = 113, baseline weight 101 kg. SFU study: PBO n = 123, baseline weight 99 kg; exenatide 5 µg n = 125, baseline weight 95 kg; exenatide 10 µg n = 129, baseline weight 95 kg. MET + SFU study: PBO n = 247, baseline weight 99 kg; exenatide 5 µg n = 245, baseline weight 97 kg; exenatide 10 µg n = 241, baseline weight 98 kg. The Last Observation Carried Forward (LOCF) method was applied to the data. Weight change was a secondary endpoint. No additional diet and exercise counseling was provided to the study patients in the clinical trials. -0,5. * * -1,0. * * -1,5. ** * Cambio en el Peso (kg) * * * -2,0. * * ** -2,5. ** -3,0. ** ** -3,5. Tiempo (semana) Tiempo (semana) Tiempo (semana) Población ITT; Media (EE); MET (N = 336), SFU (N = 377), MET + SFU (N = 733); *p <0,05 vs placebo; **p <0,001 vs placebo. El peso basal medio osciló de 95 kg a 101 kg en todas las ramas del estudio. DeFronzo RA, et al. Diabetes Care. 2005;28: ; Buse JB, et al. Diabetes Care. 2004;27: ; Kendall DM, et al. Diabetes Care. 2005;28: Reproducido con permiso de American Diabetes Association. 22.")
23
Glucosa en sangre (mmol/L)
Estudio Comparativo de Exenatida/Insulina Glargina: Exenatida Redujo las excursiones posprandiales de Glucosa Exenatida Insulina Glargina Basal Basal 14 Semana 26 14 Semana 26 12 12 Glucosa en sangre (mmol/L) DISCUSSION Exenatide treatment reduced postprandial glucose excursions compared to insulin glargine treatment in patients with type 2 diabetes Insulin glargine-treated patients had lower pre-meal glucose levels but had higher postmeal glucose levels than exenatide-treated patients Baseline fasting plasma glucose (FPG) profiles were similar between the 2 treatment groups (exenatide group, 10.2 mmol/L; insulin glargine group, 10.1 mmol/L) BACKGROUND This randomised, open-label, Phase 3 clinical trial compared the effects of exenatide and insulin glargine on glycaemic control in patients with type 2 diabetes not achieving adequate glycaemic control with combination metformin (MET) and sulphonylurea (SFU) therapy at maximally effective doses Patients were randomised to two study arms. One arm received exenatide 5 µg twice daily (BID) for 4 weeks; the dose was increased to 10 µg BID for the remainder of the study. A second treatment group received insulin glargine at an initial dose of 10 Units/day (U/d), then in self-titrated doses using a fixed-dose algorithm to achieve a fasting blood glucose target level of <100 mg/dL (5.6 mmol/L) on daily glucose monitoring Patients were 30 to 75 years of age and treated with stable and maximally effective doses of MET and SFU for at least 3 months prior to screening General inclusion criteria included a screening HbA1c of 7.0% to 10.0% and a body mass index ( BMI)>25 kg/m2 and <45 kg/m2 Seven-point self-monitored blood glucose profiles (blood glucose measured before and 2 hours after the start of the morning, midday, and evening meals, as well as at 03:00 hours) were performed at baseline and repeated throughout the study at 4, 8, 12, 18, and 26 weeks Overall, mean daily self-monitored blood glucose at endpoint were not different between treatment groups (exenatide: 146 ± 2 mg/dL, insulin glargine: 144 ± 2 mg/dL) 10 10 8 8 6 6 03:00 03:00 Pre-Almuerzo Pre-Cena Pre-Almuerzo Pre-Cena Pre-Desayuno Pre-Desayuno Muestra ITT; se muestra la media ± EE. Heine RJ, et al. Ann Intern Med. 2005;143: Reproducido con permiso de The American College of Physicians. 23
 DISCUSSION. Exenatide treatment reduced postprandial glucose excursions compared to insulin glargine treatment in patients with type 2 diabetes. Insulin glargine-treated patients had lower pre-meal glucose levels but had higher postmeal glucose levels than exenatide-treated patients. Baseline fasting plasma glucose (FPG) profiles were similar between the 2 treatment groups (exenatide group, 10.2 mmol/L; insulin glargine group, 10.1 mmol/L) BACKGROUND. This randomised, open-label, Phase 3 clinical trial compared the effects of exenatide and insulin glargine on glycaemic control in patients with type 2 diabetes not achieving adequate glycaemic control with combination metformin (MET) and sulphonylurea (SFU) therapy at maximally effective doses. Patients were randomised to two study arms. One arm received exenatide 5 µg twice daily (BID) for 4 weeks; the dose was increased to 10 µg BID for the remainder of the study. A second treatment group received insulin glargine at an initial dose of 10 Units/day (U/d), then in self-titrated doses using a fixed-dose algorithm to achieve a fasting blood glucose target level of <100 mg/dL (5.6 mmol/L) on daily glucose monitoring. Patients were 30 to 75 years of age and treated with stable and maximally effective doses of MET and SFU for at least 3 months prior to screening. General inclusion criteria included a screening HbA1c of 7.0% to 10.0% and a body mass index ( BMI)>25 kg/m2 and <45 kg/m2. Seven-point self-monitored blood glucose profiles (blood glucose measured before and 2 hours after the start of the morning, midday, and evening meals, as well as at 03:00 hours) were performed at baseline and repeated throughout the study at 4, 8, 12, 18, and 26 weeks. Overall, mean daily self-monitored blood glucose at endpoint were not different between treatment groups (exenatide: 146 ± 2 mg/dL, insulin glargine: 144 ± 2 mg/dL) :00. 03:00. Pre-Almuerzo. Pre-Cena. Pre-Almuerzo. Pre-Cena. Pre-Desayuno. Pre-Desayuno. Muestra ITT; se muestra la media ± EE. Heine RJ, et al. Ann Intern Med. 2005;143: Reproducido con permiso de The American College of Physicians. 23.")
24
Tratamientos en desarrollo
Análogos GLP-1 Exenatide LAR - Aplicación semanal, estudios fase 2 Liraglutide Análogo de GLP-1 que se une a la albúmina por una cadena lipídica. Dosis única al día. En estudios comparativos como monoterapia se reporta un control glucémico similar a glimepiride y a metformina. Incrementa la replicación in vitro de células beta (50-80%) (November 10, 2005) Elbrond B. Diabetes Care 2002 Aug;25(8): Madsbad S. Diabetes Care 2004 Jun;27(6): Feinglos,MN. Diabetic Medicine 2004; 22:1016. J Endocrinol 2006; 188:
 (November 10, 2005) Elbrond B. Diabetes Care 2002 Aug;25(8): Madsbad S. Diabetes Care 2004 Jun;27(6): Feinglos,MN. Diabetic Medicine 2004; 22:1016. J Endocrinol 2006; 188:")
25
Inhibidores de DPP-4: Potenciadores de la función de las incretinas
ComidaMixta Liberación Intestinal GLP-1 GLP-1 activo Both GLP-1 and glucose-dependent insulinotropic peptide (GIP) are incretins; i.e., gut peptides that are released from the GI tract in response to a meal to potentiate glucose-dependent insulin release.1 The physiologic role of incretin hormones in maintaining glycemic control suggests that the incretin axis is a potential target for therapeutic intervention in type 2 diabetes.1 After their release into the circulation, both GLP and GIP are degraded by the enzyme dipeptidyl peptidase IV (DPP-IV).2 Prevention of the degradation of GLP-1 and GIP to their inactive metabolites via DPP-IV inhibition therefore may represent a rational approach to the treatment of type 2 diabetes.1 DPP-4 GLP-1 inactivo Inhibidor DPP-4 DPP-IV=dipeptidyl peptidase IV Drucker DJ. Expert Opin Invest Drugs 2003;12(1):87–100 Ahrén B Curr Diab Rep 2003;3:365–372. References Drucker DJ. Therapeutic potential of dipeptidyl peptidase IV inhibitors for the treatment of type 2 diabetes. Expert Opin Invest Drugs 2003;12(1):87–100. Ahrén B. Gut peptides and type 2 diabetes mellitus treatment. Curr Diab Rep 2003;3:365–372. 25
 are incretins; i.e., gut peptides that are released from the GI tract in response to a meal to potentiate glucose-dependent insulin release.1 The physiologic role of incretin hormones in maintaining glycemic control suggests that the incretin axis is a potential target for therapeutic intervention in type 2 diabetes.1 After their release into the circulation, both GLP and GIP are degraded by the enzyme dipeptidyl peptidase IV (DPP-IV).2. Prevention of the degradation of GLP-1 and GIP to their inactive metabolites via DPP-IV inhibition therefore may represent a rational approach to the treatment of type 2 diabetes.1. DPP-4. GLP-1. inactivo. Inhibidor. DPP-4. DPP-IV=dipeptidyl peptidase IV. Drucker DJ. Expert Opin Invest Drugs 2003;12(1):87–100. Ahrén B Curr Diab Rep 2003;3:365–372. References. Drucker DJ. Therapeutic potential of dipeptidyl peptidase IV inhibitors for the treatment of type 2 diabetes. Expert Opin Invest Drugs 2003;12(1):87–100. Ahrén B. Gut peptides and type 2 diabetes mellitus treatment. Curr Diab Rep 2003;3:365–")
26
Tratamientos en desarrollo
Inhibidores de DPP-IV Dosis Tratamiento Tiempo HbA1c Vidagliptina 50 mg cada 12 hrs VO Combinado con metformina 12 semanas -0.6 40 semanas -1.1 Sitagliptina Comparado con glipizida 20 mg/día -0.8 vs. –1.0 Ahren B. Diabetes Care 2004 Dec;27(12): Scott R. American Diabetes Association 65th Scientific Sessions 2005; 41-O
: Scott R. American Diabetes Association 65th Scientific Sessions 2005; 41-O.")
27
Exenatide Reduced PPG Concentrations To a Greater Extent Than Sitagliptin
Baseline Exenatide Sitagliptin Primary Endpoint -30 30 60 90 120 150 180 210 240 160 200 280 HL Refs DeFronzo_Curr_Med_Res_Opin_2008_p7,9,12,25,29_ms.doc Amylin_BCA403_SDS_ _p42,43,44.pdf Amylin_BCA403_SDS_2.2.3_p53,54,55.pdf Amylin_BCA403_SDS_2.1.8_p41.pdf ADA_Diabetes_Care_2008_pS18.pdf DISCUSSION Compared to PPG concentrations at baseline, reductions in PPG concentrations over time were greater with exenatide treatment than with sitagliptin treatment1 The 2-hour PPG concentration (LS mean ± SE) for the ITT population was significantly lower with exenatide than with sitagliptin (166 ± 7 mg/dL vs 210 ± 7 mg/dL; P <0.0001) The change in 2‑hour PPG concentration from baseline (LS mean ± SE) for the ITT population was ‑91 ± 7 mg/dL for exenatide vs ‑47 ± 7 mg/dL for sitagliptin (P <0.0001)2 The 2-hour PPG concentration (LS mean ± SE) for the evaluable population was significantly lower with exenatide than with sitagliptin (133 ± 6 mg/dL vs 208 ± 6 mg/dL; P <0.0001) The change in 2‑hour PPG concentration from baseline (LS mean ± SE) for the evaluable population was ‑112 ± 6 mg/dL for exenatide vs ‑37 ± 6 mg/dL for sitagliptin (P <0.0001)2 All PPG parameters (area under the curve [AUC], average concentration [Cave], and maximum concentration [Cmax]) were significantly lower with exenatide treatment than with sitagliptin treatment (P <0.0001)1 Exenatide decreased PPG AUC0-240 min (mg • min/dL) by 26% vs sitagliptin (0.74 ± 0.02; geometric LS mean ratio ± SE)2 Exenatide decreased PPG Cave0-240 min (mg/mL) by 26% vs sitagliptin (0.74 ± 0.02; geometric LS mean ratio ± SE)2 The Cave is equal to the corresponding AUC divided by the time period Exenatide decreased Cmax (mg/dL) by 19% vs sitagliptin (0.81 ± 0.03; geometric LS mean ratio ± SE)2 The current ADA peak PPG goal3 for patients with type 2 diabetes is <180 mg/dL BACKGROUND1 This was a Phase 4, double-blind, randomized, double-dummy, crossover, multicenter study composed of a 1-week placebo lead-in period followed by two 2-week treatment periods in patients with type 2 diabetes treated with a stable regimen of MET Patients were randomly assigned to exenatide-sitagliptin or sitagliptin-exenatide treatment sequences Exenatide doses were 5 µg SC BID for the first week, followed by exenatide 10 µg SC BID for the second week Sitagliptin doses were 100 mg PO QAM for 2 weeks The primary endpoint (comparison of the effects of exenatide and sitagliptin on 2-hour PPG concentrations) was analyzed using a mixed-effect model with treatment, treatment sequence, and period as fixed effects, patient-within-sequence as a random effect, and study baseline 2-hour PPG concentration (on Day -1) as a covariate REFERENCES 1. DeFronzo RA, et al. Curr Med Res Opin. 2008; 24: 2. Data on file, Amylin Pharmaceuticals, Inc. 3. ADA. Diabetes Care. 2008;31;(Suppl 1):S12-S54 PPG (mg/dL) * Standard Meal Time (min) Patients with T2D; Evaluable population, n = 61 for all treatment groups; Mean ± SE; * LS mean ± SE, P<0.0001 Adapted from DeFronzo RA, et al. Curr Med Res Opin. 2008;24(10) ; Data on file, Amylin Pharmaceuticals, Inc. 27 27
 for the ITT population was significantly lower with exenatide than with sitagliptin (166 ± 7 mg/dL vs 210 ± 7 mg/dL; P <0.0001) The change in 2‑hour PPG concentration from baseline (LS mean ± SE) for the ITT population was ‑91 ± 7 mg/dL for exenatide vs ‑47 ± 7 mg/dL for sitagliptin (P <0.0001)2. The 2-hour PPG concentration (LS mean ± SE) for the evaluable population was significantly lower with exenatide than with sitagliptin (133 ± 6 mg/dL vs 208 ± 6 mg/dL; P <0.0001) The change in 2‑hour PPG concentration from baseline (LS mean ± SE) for the evaluable population was ‑112 ± 6 mg/dL for exenatide vs ‑37 ± 6 mg/dL for sitagliptin (P <0.0001)2. All PPG parameters (area under the curve [AUC], average concentration [Cave], and maximum concentration [Cmax]) were significantly lower with exenatide treatment than with sitagliptin treatment (P <0.0001)1. Exenatide decreased PPG AUC0-240 min (mg • min/dL) by 26% vs sitagliptin (0.74 ± 0.02; geometric LS mean ratio ± SE)2. Exenatide decreased PPG Cave0-240 min (mg/mL) by 26% vs sitagliptin (0.74 ± 0.02; geometric LS mean ratio ± SE)2. The Cave is equal to the corresponding AUC divided by the time period. Exenatide decreased Cmax (mg/dL) by 19% vs sitagliptin (0.81 ± 0.03; geometric LS mean ratio ± SE)2. The current ADA peak PPG goal3 for patients with type 2 diabetes is <180 mg/dL. BACKGROUND1. This was a Phase 4, double-blind, randomized, double-dummy, crossover, multicenter study composed of a 1-week placebo lead-in period followed by two 2-week treatment periods in patients with type 2 diabetes treated with a stable regimen of MET. Patients were randomly assigned to exenatide-sitagliptin or sitagliptin-exenatide treatment sequences. Exenatide doses were 5 µg SC BID for the first week, followed by exenatide 10 µg SC BID for the second week. Sitagliptin doses were 100 mg PO QAM for 2 weeks. The primary endpoint (comparison of the effects of exenatide and sitagliptin on 2-hour PPG concentrations) was analyzed using a mixed-effect model with treatment, treatment sequence, and period as fixed effects, patient-within-sequence as a random effect, and study baseline 2-hour PPG concentration (on Day -1) as a covariate. REFERENCES. 1. DeFronzo RA, et al. Curr Med Res Opin. 2008; 24: Data on file, Amylin Pharmaceuticals, Inc. 3. ADA. Diabetes Care. 2008;31;(Suppl 1):S12-S54. PPG (mg/dL) * Standard Meal. Time (min) Patients with T2D; Evaluable population, n = 61 for all treatment groups; Mean ± SE; * LS mean ± SE, P< Adapted from DeFronzo RA, et al. Curr Med Res Opin. 2008;24(10) ; Data on file, Amylin Pharmaceuticals, Inc")
28
CARACTERÍSTICA EHHNC CAD Más frecuente en: DM-2 DM-1 Problema predominante Hipovolemia Acidosis Glucemia Usualmente > 600 mg/dl Usualmente > 250 mg/dl Osmolaridad sérica > 320 mOsm/ml Usualmente < 320 mOsm/ml Cetonuria Puede estar presente (+) +++ (> 80 mg/dl) Cetonemia Suele ser negativa > 50 mg/dl Generalmente ausente pH < 7.3 y HCO3 < 15 mEq/lt Estado de conciencia Suele estar alterado Puede ser normal Factores clínicos acompañantes Focalización neurológica* Elevación de amilasa y lipasa pancreáticas**, hipertrigliceridemia*** Factores predisponentes más frecuentes Infecciones, eventos cardiovasculares Omisión de tratamiento, infecciones, eventos cardiovasculares, alcohol
 +++ (> 80 mg/dl) Cetonemia. Suele ser negativa. > 50 mg/dl. Generalmente ausente. pH < 7.3 y HCO3 < 15 mEq/lt. Estado de conciencia. Suele estar alterado. Puede ser normal. Factores clínicos acompañantes. Focalización neurológica* Elevación de amilasa y lipasa pancreáticas**, hipertrigliceridemia*** Factores predisponentes más frecuentes. Infecciones, eventos cardiovasculares. Omisión de tratamiento, infecciones, eventos cardiovasculares, alcohol.")
30
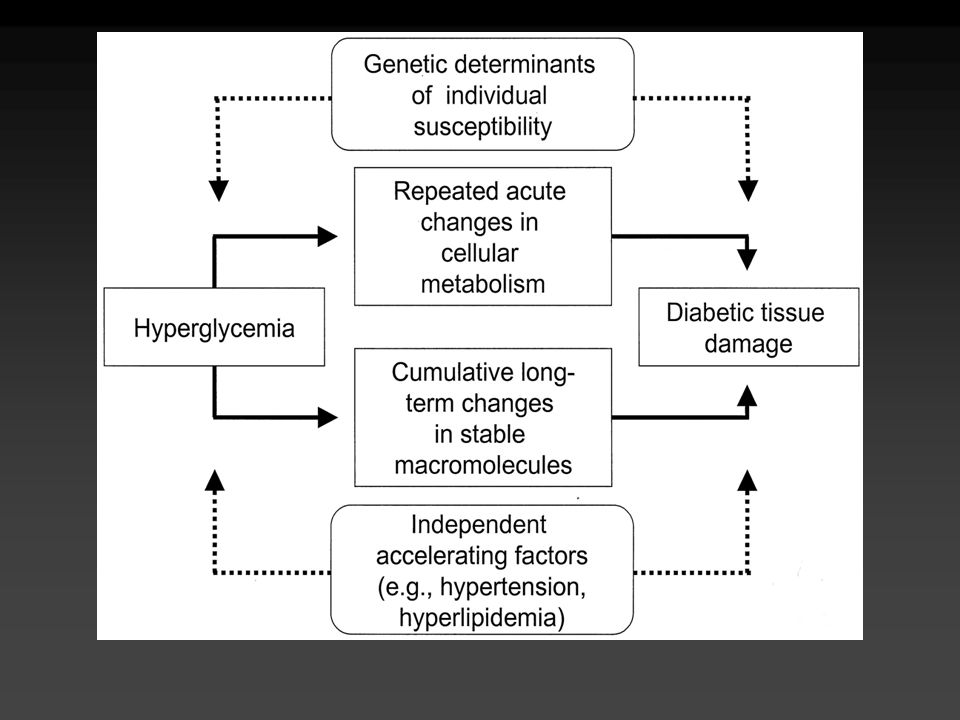
MECANISMOS IMPLICADOS EN EL DAÑO RENAL Y LA EXPANSION MESANGIAL INDUCIDOS POR HIPERGLUCEMIA
Sperling MA. Type 1 Diabetes.Ethiology and Treatment Humana Press

31
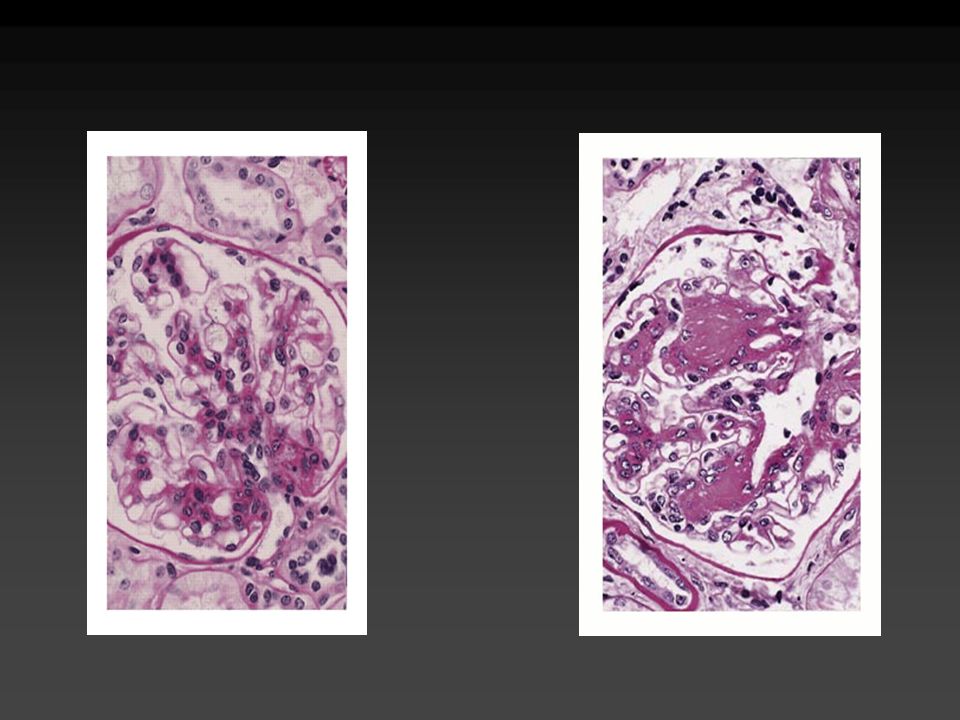
PATOLOGIA GLOMERULAR Y TUBULOINTERSTICIAL
FACTORES HEMODINAMICOS Y NO HEMODINAMICOS EN LA FISIOPATOLOGIA DE LA NEFROPATIA DIABETICA FACTORES METABOLICOS FACTORES HEMODINAMICOS GLUCOSA HORMONAS VASOACTIVAS (Angiot. II, endotelina) HIPERTENSION SISTEMICA INTRAGLOMERULAR AGES ROS POLIOLES MOLECULAS DE SEÑALIZACION INTRACELULAR Y OTROS FACTORES PKC, MAPK, NFB, FACTORES DE CRECIMIENTO CITOCINAS: TGF, IL-1, PDGF PATOLOGIA GLOMERULAR Y TUBULOINTERSTICIAL
 HIPERTENSION. SISTEMICA. INTRAGLOMERULAR. AGES. ROS. POLIOLES. MOLECULAS DE SEÑALIZACION INTRACELULAR Y OTROS FACTORES. PKC, MAPK, NFB, FACTORES DE CRECIMIENTO CITOCINAS: TGF, IL-1, PDGF. PATOLOGIA GLOMERULAR Y TUBULOINTERSTICIAL.")
32
VIA DE LOS PRODUCTOS FINALES DE GLUCOSILACION AVANZADA (AGEs)
HIPERGLUCEMIA GLUCACION NO ENZIMATICA PRODUCTOS DE AMADORI + RECEPTOR DE AGE ACTIVACION DE SEÑALES CELULARES: PKC MAPK NFB PERDIDA DE FENOTIPO AUMENTO DE PROTEOLISIS TERMOLABILIDAD ALTERACION DE FUNCION PROTEICA Y FUNCION GENICA PERMEABILIDAD PROTEINICA

34
ESTADIOS CLINICOS DE LA NEFROPATIA EN LA DIABETES TIPO 1
ESTADIO A 5 AÑOS ESTADIO A 2 AÑOS ENGROSAMIENTO DE LA MBG GLOMERULAR, EXPANSION MESANGIAL HIPERFILTRACION, NEFROMEGALIA MICROALBUMINURIA REVERSIBLE CON MEJORIA DE LA GLUCEMIA MICROALBUMINURIA SOLO CON EJERCICIO ESTADIO A 15 AÑOS ESTADIO A 20 AÑOS NEFROPATÍA INCIPIENTE NEFROPATIA CLINICA MICROALBUMINURIA INICIALMENTE INTERMITENTE, DESPUES PERSISTENTE MACROALBUMINURIA, FILTRACION GLOMERULAR DESCENDENTE ESTADIO A 30 AÑOS NEFROPATIA TERMINAL ELEVACION PROGRESIVA DE AZOADOS. REQUIERE Tx SUBSTITUTIVO EN 2-3 AÑOS

35
Detección temprana de nefropatía
A partir de 3-5 años del diagnóstico, anualmente DM-1 DM-2 Desde el momento del diagnóstico, anualmente Albuminuria > 30 mg/día IECA’s, BRAT-II, Ca-antagonistas Control de HTAS Tratamiento de dislipidemias Control glucémico Considerar restricción de proteínas Albuminuria > 300 mg/día Referencia al nefrólogo

36
Retina normal

37
Retinopatía no proliferativa

38
Retinopatía no proliferativa severa

39
Retinopatía proliferativa

40
Retinopatía proliferativa con fibrosis

41
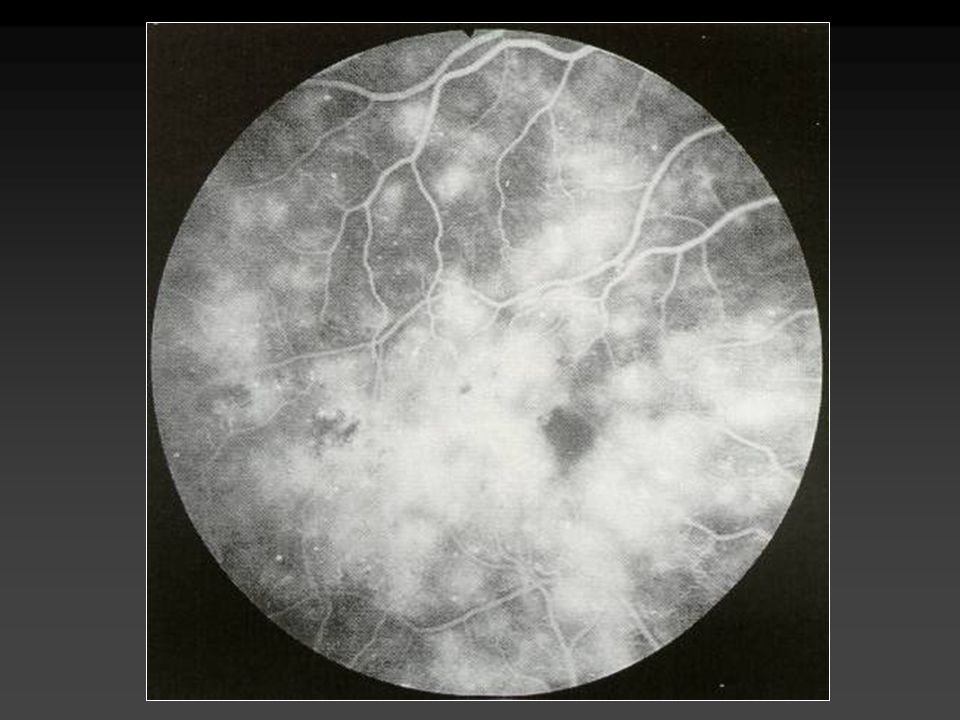
Edema macular

45
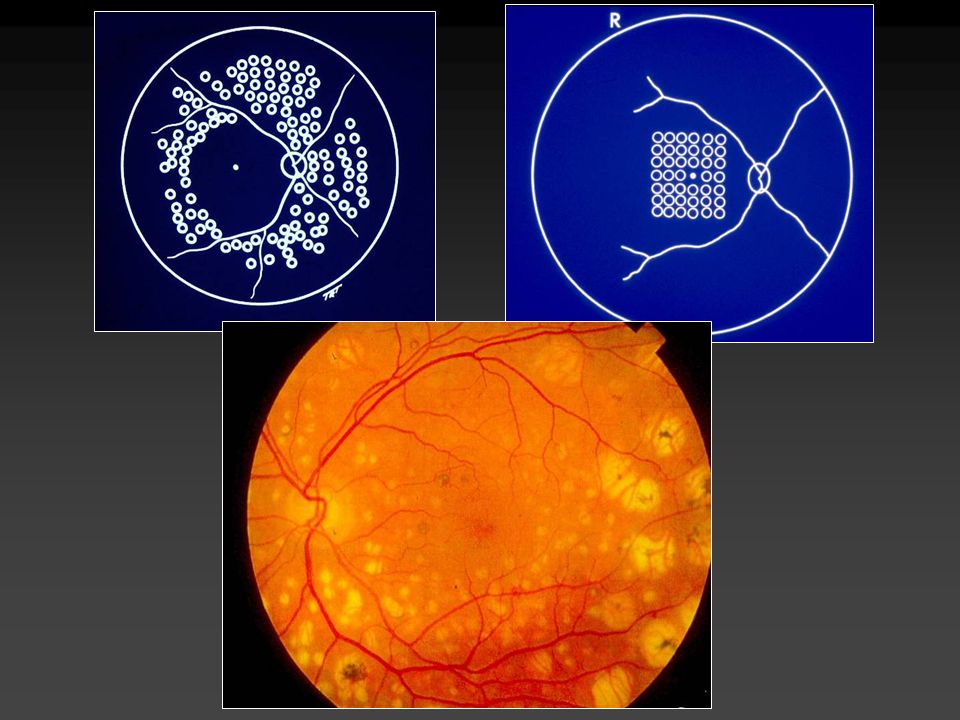
Detección temprana de retinopatía
A partir de 3-5 años del diagnóstico, anualmente, por oftalmólogo DM-1 DM-2 Desde el momento del diagnóstico, anualmente, por oftalmólogo Retinopatía pre-proliferativa, o sin retinopatía Vigilancia semestral-anual Control glucémico Control de HTAS Cataratas Disminución de agudeza visual aguda Proliferación vascular retiniana Manejo especializado por oftalmólogo

51
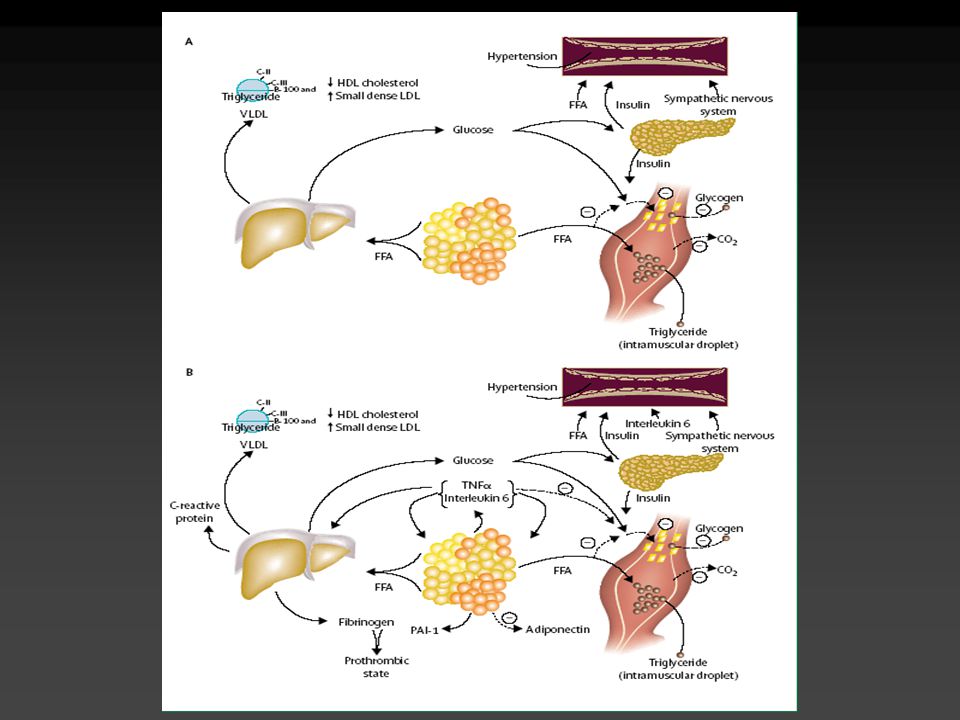
Am J Cardiovasc Drugs 2004; 4: 269-80
Fisiopatogenia de la relación de ICC y DM-2. Tenenbaum A, Fisman EZ: Am J Cardiovasc Drugs 2004; 4:

52
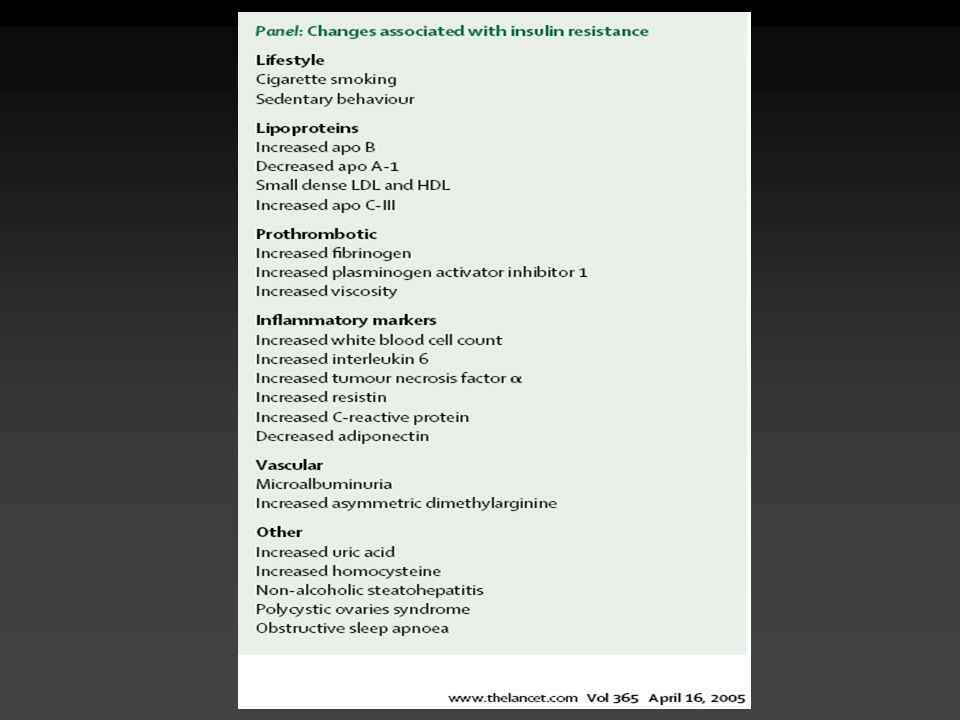
Grundy SM: JACC 2006; 47 (6):
:")
53
Grundy SM: JACC 2006; 47 (6):
:")
Presentaciones similares


>")


>")


