Descargar la presentación
La descarga está en progreso. Por favor, espere

1
“Systems Biology”: el nuevo Desafío
Universidad de Talca 4ta Jornada de Investigación y Asistencia Técnica “Systems Biology”: el nuevo Desafío J.A. Asenjo Centre for Biochemical Engineering and Biotechnology Systems Biology and Cell Dynamics Seminars University of Chile Diciembre 2005

2
Biotecnología de Futuro: un Desafío para Chile

3
Systems Biology

4
We haven’t the money, so we’ve got to think
Ernest Lord Rutherford,

6
Edward Jenner (1749 –1823): “cowpox” – smallpox – Vacuna viruela
1850 Luis Pasteur: Microorganismos: fermentación no es espontánea levaduras fermentación Esterilización (descubrió los microorganismos) (Enzimas) azúcar levadura CO2 + H2O alcohol 1928: Alejandro Flemming : Penicilina 1939: Florey, Chain purificación de penicilina y producción masiva USA-Pfizer Producción de ácido cítrico 1945: Premio Nobel: Flemming, Florey, Chain
 (Enzimas) azúcar. levadura. CO2 + H2O. alcohol. 1928: Alejandro Flemming : Penicilina. 1939: Florey, Chain purificación de penicilina y producción masiva. USA-Pfizer Producción de ácido cítrico. 1945: Premio Nobel: Flemming, Florey, Chain.")
7
60’s - 70’s Ingeniería Genética
80’s INSULINA: Ingeniería genética de E.coli y S.cerevisiae Insulina comercial recombinante Hoy: Eli-Lilly Novo-Nordisk 90’s: tpA Vacunas: Contra hepatítis B (Merck, Chiron) Sida 1990 Sally y Dolly Terapia celular y génica Enzimas criofílicas
 Sida Sally y Dolly. Terapia celular y génica. Enzimas criofílicas.")
8
Biotecnología Nueva Biología Molecular Proteínas “Clonadas”
Ingeniería de Proteínas Genómica Funcional Ingeniería Metabólica (Metabolómica) Nuevos Productos Terapéuticos Nuevas Vacunas Nuevas Enzimas Industriales Nuevos Microorganismos Cultivo de Tejidos, Terapia Génica
 Nuevos Productos Terapéuticos. Nuevas Vacunas. Nuevas Enzimas Industriales. Nuevos Microorganismos. Cultivo de Tejidos, Terapia Génica.")
12
The architecture of a knowledge based expert system
The architecture of a knowledge based expert system. (taken from Asenjo, Herrera and Byrne, 1989) Facts Rules Knowledge base Working memory Knowledge acquisition subsystem Control Inference Inference engine User interface Explanation Expert or engineer
 Facts. Rules. Knowledge base. Working. memory. Knowledge. acquisition. subsystem. Control. Inference. Inference engine. User. interface. Explanation. Expert or. engineer.")
13
Determination of the Resolution Between Two Peaks
V1 V2 W1 W2 Absorbance Time V2-V1 ½(W1+W2) RS = SC a RS h = DF DF SC a RS
 RS = SC a RS. h = DF DF. SC a RS.")
14
The model of database components for main protein contaminants in one of the production streams to be used in the selection of optimal separation operation CHARGE PROTEINS PRODUCT CONTAMINANT 1 CONTAMINANT 2 CONTAMINANT 3 CONTAMINANT 4 CONTAMINANT N pH 4.0 pH 4.5 pH 9.5 pH 10.0 PROPERTY CONCENTRATION MOLECULAR WEIGHT ISOELECTRIC POINT HYDROPHO- BICITY CONTAMINANT 5

15
Concentration, molecular weight, hydrophobicity and charge at different pHs, for the main proteins (“contaminants” of the product) in Escherichia coli. Data from Woolston (1994) Charge4 (Coulomb per molecule x 1E25) pI 1 4.67 4.72 4.85 4.92 5.01 5.16 5.29 5.57 5.65 6.02 7.57 8.29 8.83 g/litre weight 11.29 7.06 4.63 5.58 4.83 2.48 7.70 6.80 7.53 6.05 3.89 1.48 0.83 Da Mol wt 2 18,370 85,570 53,660 120,000 203,000 69,380 48,320 93,380 114,450 198,000 30,400 94,670 * hydroph 3 0.71 0.48 0.76 1.50 0.36 0.93 0.63 0.06 pH 4 q A 1.94 2.35 1.83 3.29 4.08 5.22 3.96 10.90 1.09 10.40 0.33 5.17 11.70 pH 4,5 q B 0.25 0.29 0.67 1.38 1.83 3.17 3.16 5.81 0.55 5.94 0.03 4.22 7.94 pH 5 q C -0.80 -1.17 0.04 -0.03 1.02 1.12 2.78 0.26 3.15 0.05 3.20 5.39 pH 5,5 q D -1.41 -2.17 -0.30 -0.69 -1.17 -0.72 -0.58 0.77 0.10 1.51 0.05 2.25 3.73 pH 6 q E -1.76 -2.83 -0.49 -1.07 -1.92 -1.90 -1.36 -0.81 -0.03 0.56 0.05 1.46 2.66 pH 6,5 q F -1.97 -3.24 -0.65 -1.34 -2.46 -2.60 -2.18 -0.12 -0.05 0.05 0.87 1.97 pH 7 q G -2.15 -3.50 -0.85 -1.73 -3.07 -3.05 -1.00 -3.32 -0.21 -0.53 0.05 0.50 1.50 pH 7,5 q H -2.33 -3.63 -1.90 -2.30 -3.90 -3.46 -0.95 -4.12 -0.28 -0.99 -0.69 0.30 1.13 pH 8 q I -2.45 -3.68 -1.34 -2.85 -4.98 -3.90 -1.59 -4.45 -0.32 -1.43 -0.97 0.20 0.80 pH 8,5 q J -2.67 -3.64 -1.50 -2.75 -5.65 -4.24 -2.84 -4.31 -0.32 -1.72 -1.57 0.08 0.51 Contaminant Cont_1 Cont_2 Cont_3 Cont_4 Cont_5 Cont_6 Cont_7 Cont_8 Cont_9 Cont_10 Cont_11 Cont_12 Cont_13 * Hydrophobicity expressed as the concentration (M) of ammonium sulphate at which the protein eluted. (Higher values represent lower hydrophobicity). 1 Measured by isoelectric focusing using homogeneous poolyacrylamide gel in Phast System. 2Molecular weight was measured by SDS-PAGE with PhastGel media in Phast System. 3Hydrophobicity was measured by hydrophobic interaction chromatography using a phenyl-superose gel in an FPLC and a gradient elution from 2.0 M to 0.0 M (NH4)2SO4 in 20 mM Tris buffer. 4Charge was measured by electrophoretic titration curve analysis with PhastGel IEF 3-9 in a Phast System.
 pI g/litre. weight Da. Mol wt 2. 18, , , , , , , , , , , ,670. * hydroph pH 4. q A pH 4,5. q B pH 5. q C pH 5,5. q D pH 6. q E pH 6,5. q F pH 7. q G pH 7,5. q H pH 8. q I pH 8,5. q J Contaminant. Cont_1. Cont_2. Cont_3. Cont_4. Cont_5. Cont_6. Cont_7. Cont_8. Cont_9. Cont_10. Cont_11. Cont_12. Cont_13. * Hydrophobicity expressed as the concentration (M) of ammonium sulphate at which the protein eluted. (Higher values represent lower hydrophobicity). 1 Measured by isoelectric focusing using homogeneous poolyacrylamide gel in Phast System. 2Molecular weight was measured by SDS-PAGE with PhastGel media in Phast System. 3Hydrophobicity was measured by hydrophobic interaction chromatography using a phenyl-superose gel in an FPLC and a gradient elution from 2.0 M to 0.0 M (NH4)2SO4 in 20 mM Tris buffer. 4Charge was measured by electrophoretic titration curve analysis with PhastGel IEF 3-9 in a Phast System.")
16
S DFi B C A b D b´ Representation of the peaks of a chromatogram as triangles, showing how the variation in the value of DF leads to different concentrations of the contaminant protein in the product. The triangle on the left corresponds to the product protein and the triangle of the right corresponds to the peak of the protein being separated (contaminant).
.")
17
Estructura de las Proteínas
Estructura Primaria: secuencia lineal de aa Estructura Secundaria: algunos aa interactuan Estructura Terciaria: cadenas de aa interligadas Estructura Nativa: proteína se encuentra activa Proteína denaturada: No tiene actividad No posee puentes disúlfuro Producción & Purificación de Proteínas

18
Proteínas Cuatro niveles de estructura: desde 1 dimensión
a 3 dimensiones Desde análisis estructural a análisis funcional

19
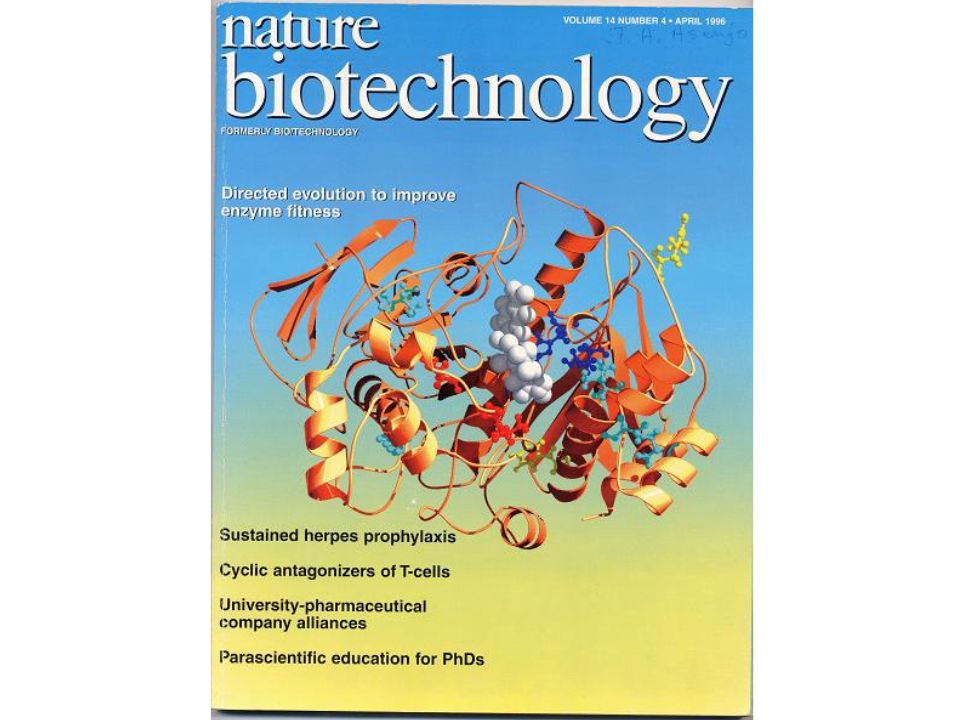
Ingeniería de Proteínas

20
Proteasa criofílica antártica

21
Ingeniería de Proteínas
Proteasas activas a baja temperatura (Criofílicas, Psicrofílicas) para detergentes para industria de alimentos Para aplicaciones médicas
 para detergentes. para industria de alimentos. Para aplicaciones médicas.")
23
Ingeniería de Proteínas
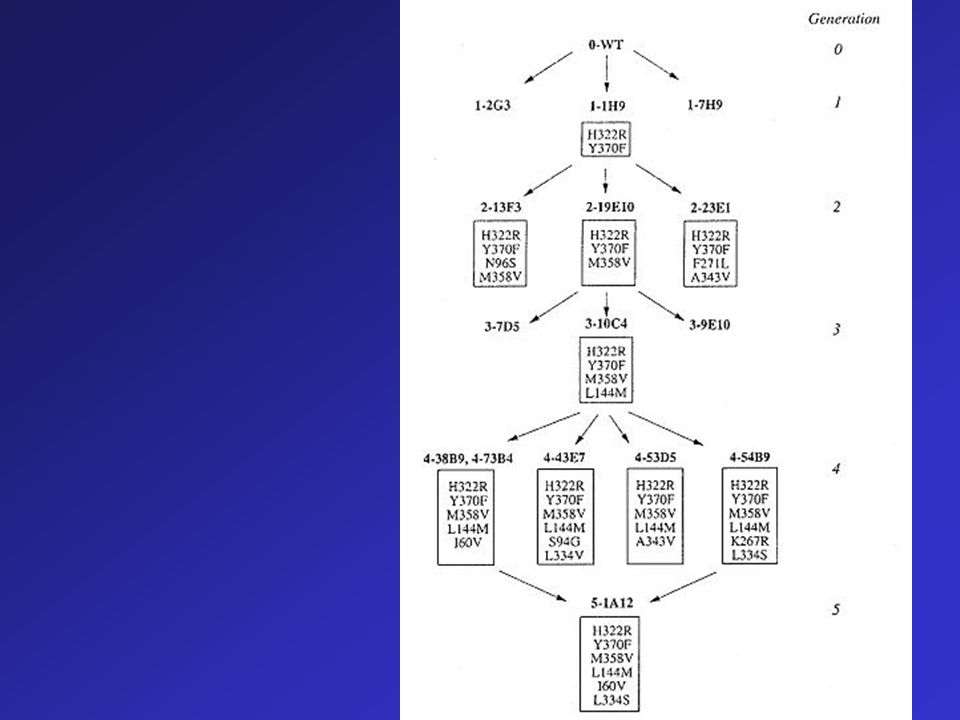
Estudios de Relación Estructura-Función Mutagénesis Sitio-Dirigida Mutagénesis al Azar

26
Actividad vs. Análisis utilizado para “screening”

27
Proteasa criofílica antártica

28
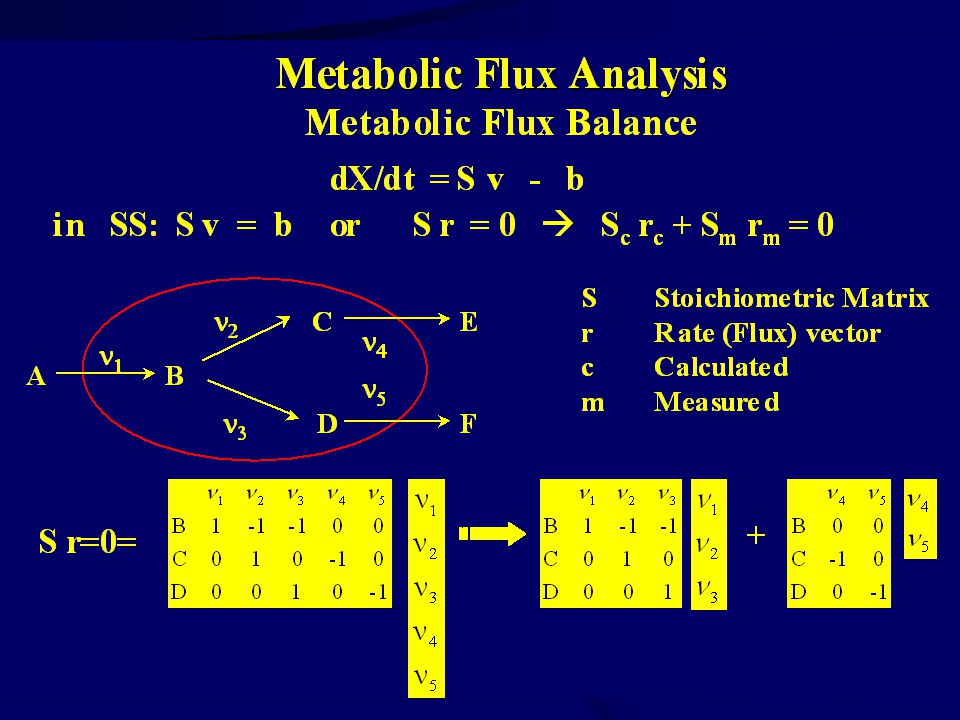
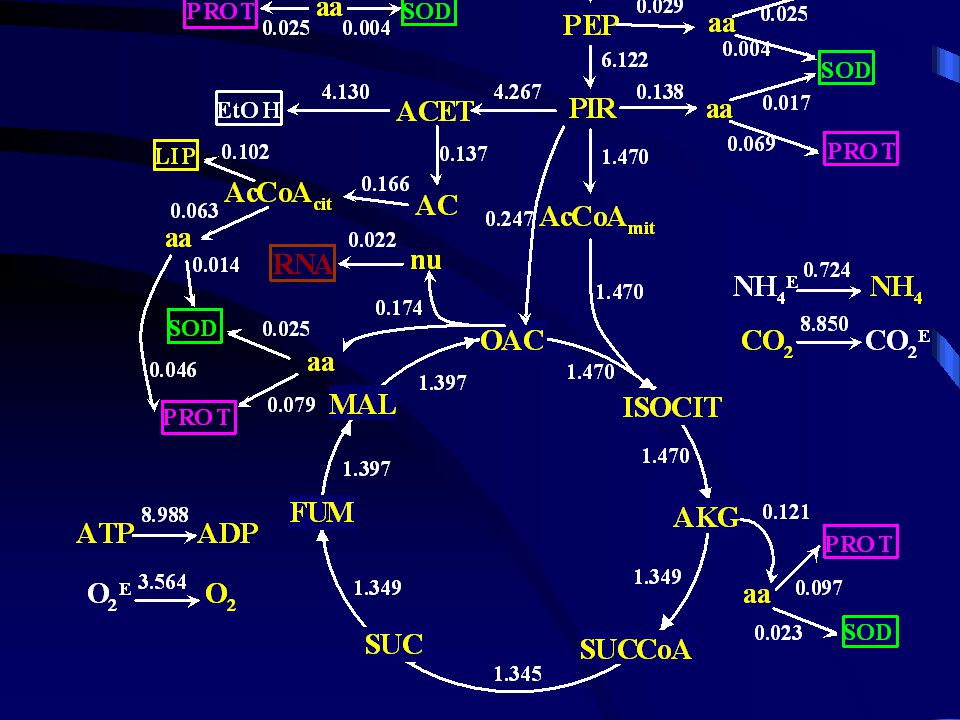
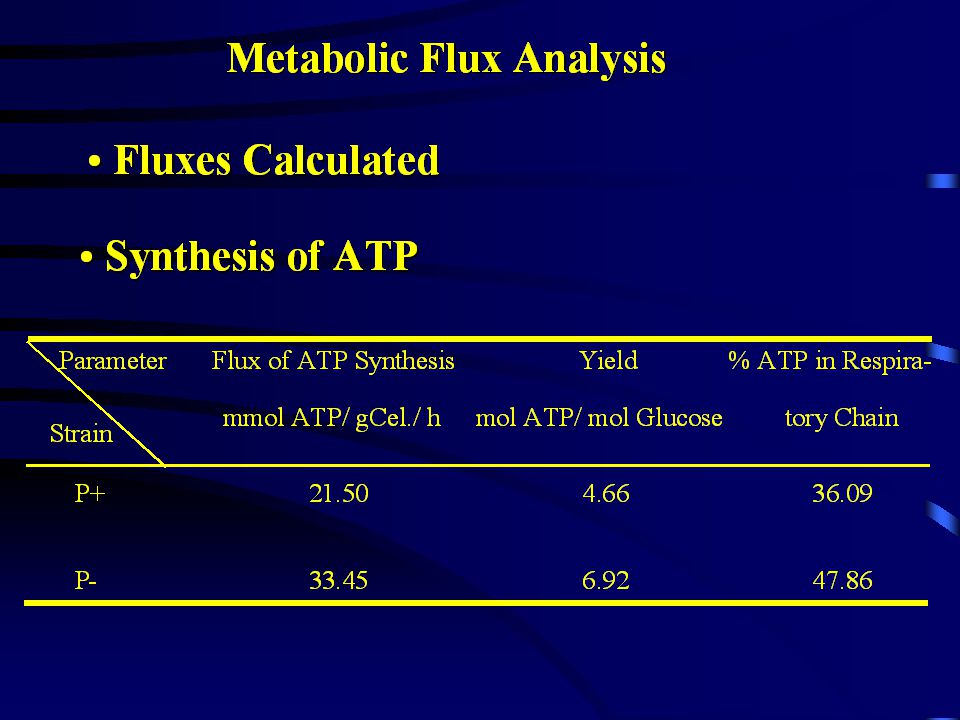
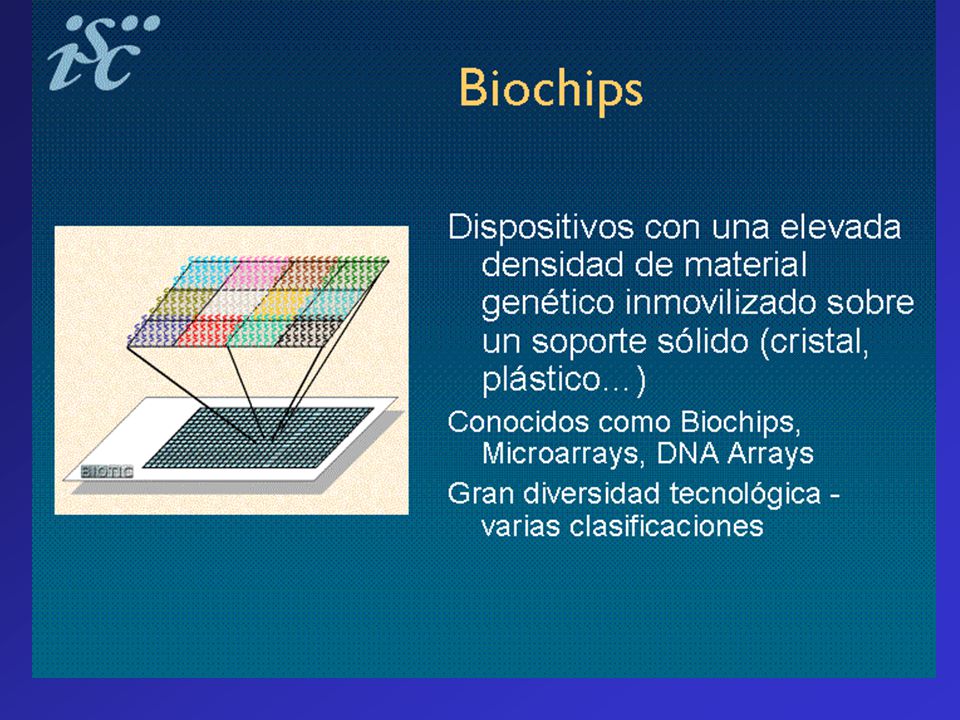
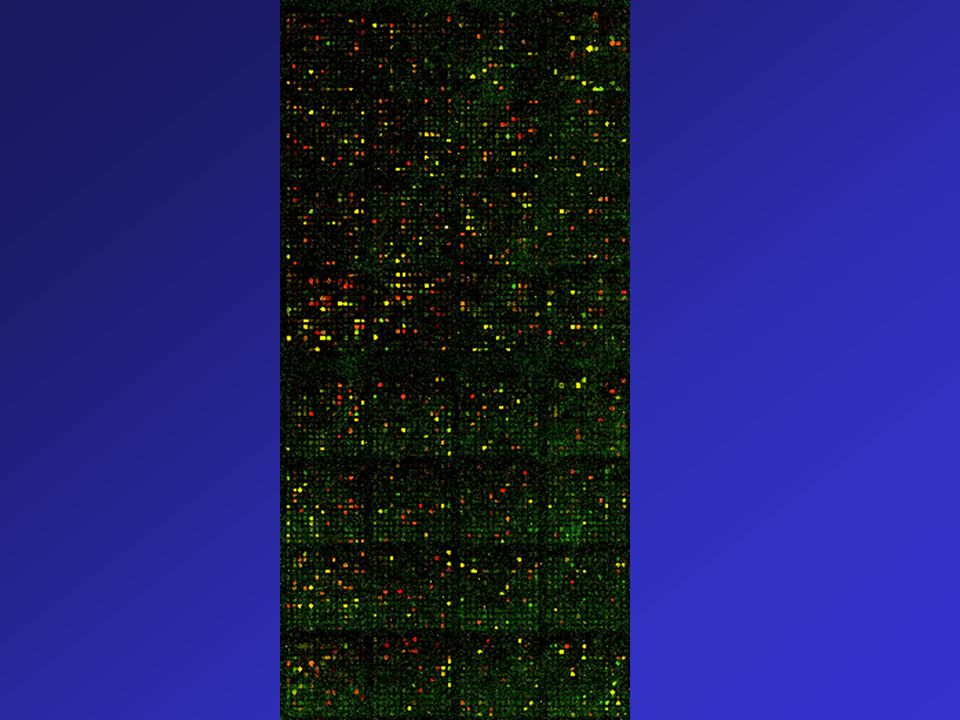
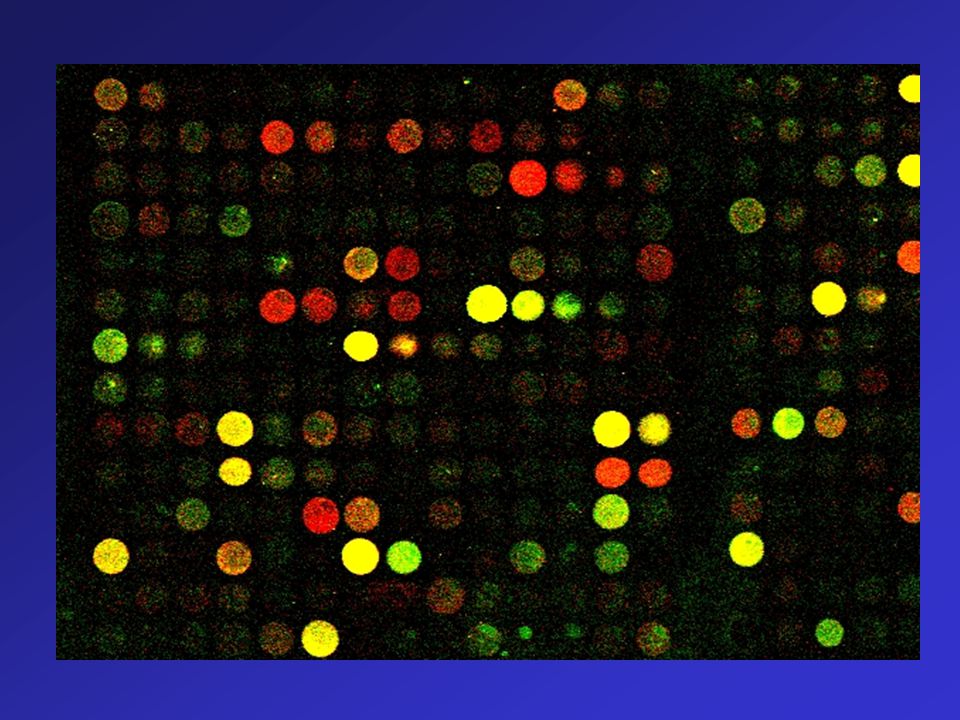
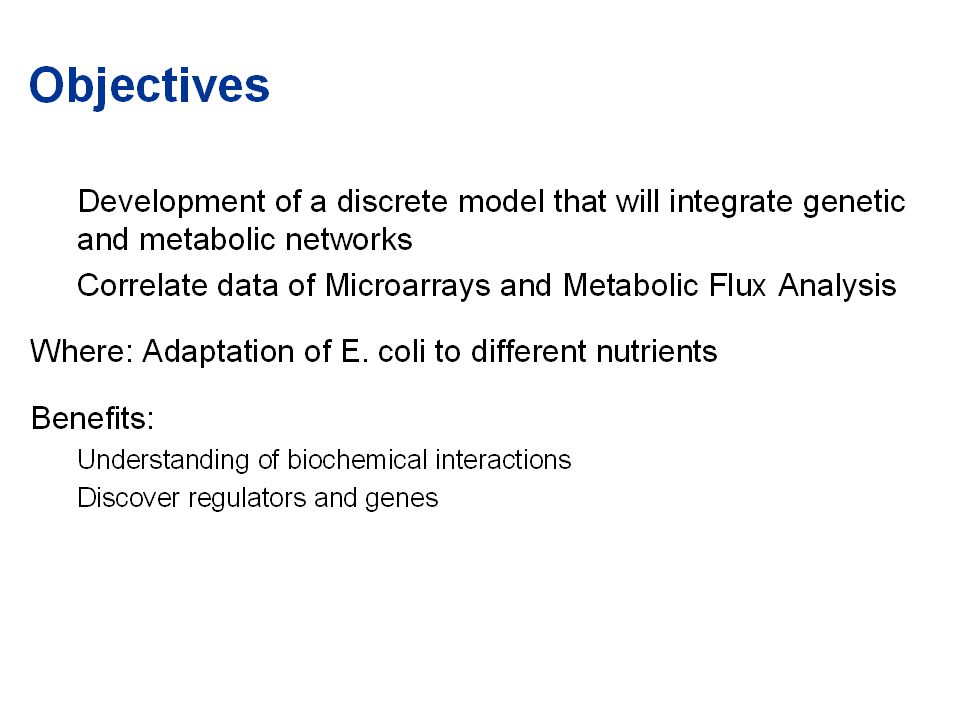
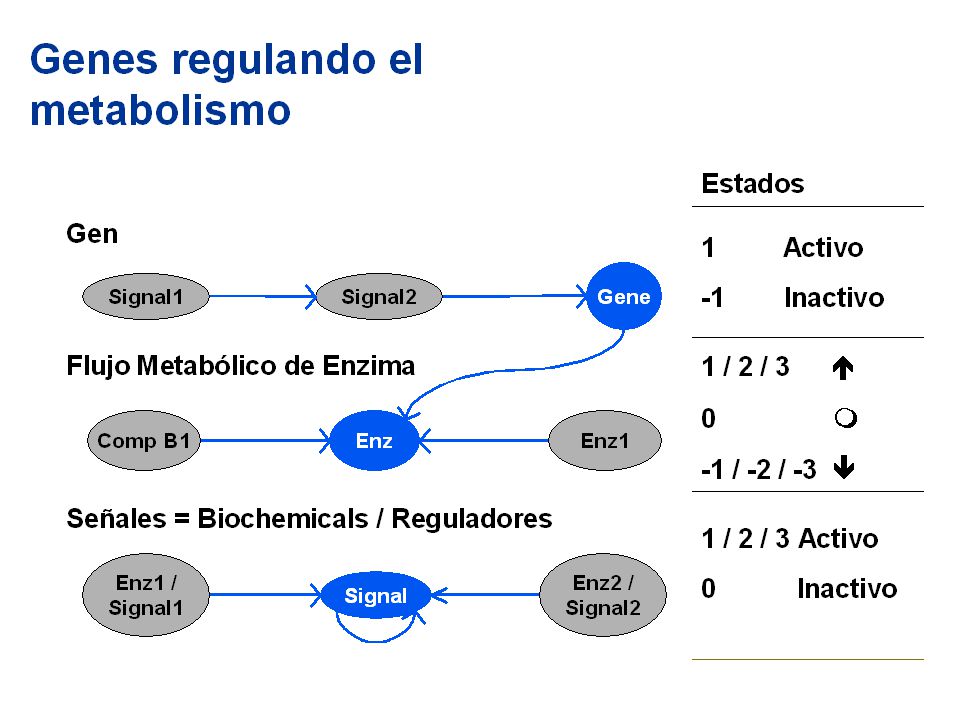
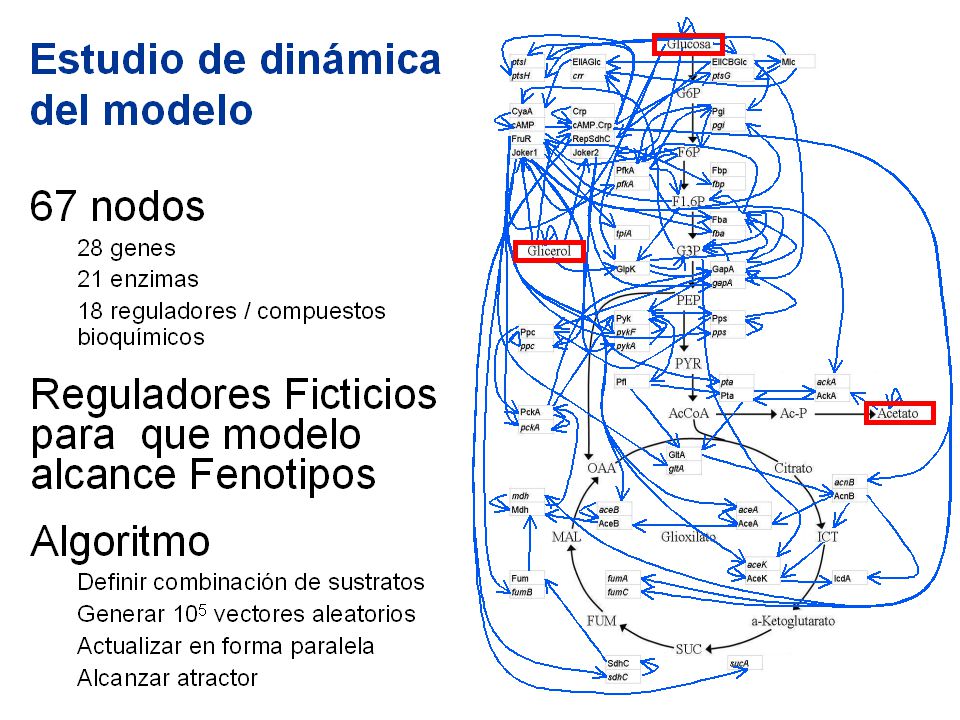
Metabolómica Ingeniería Metabólica
Systems Biology: qué viene después de la Genómica Uso de Análisis de Flujos Metabólicos y Tecnología de Microarrays de Genes

29
Metabolómica

40
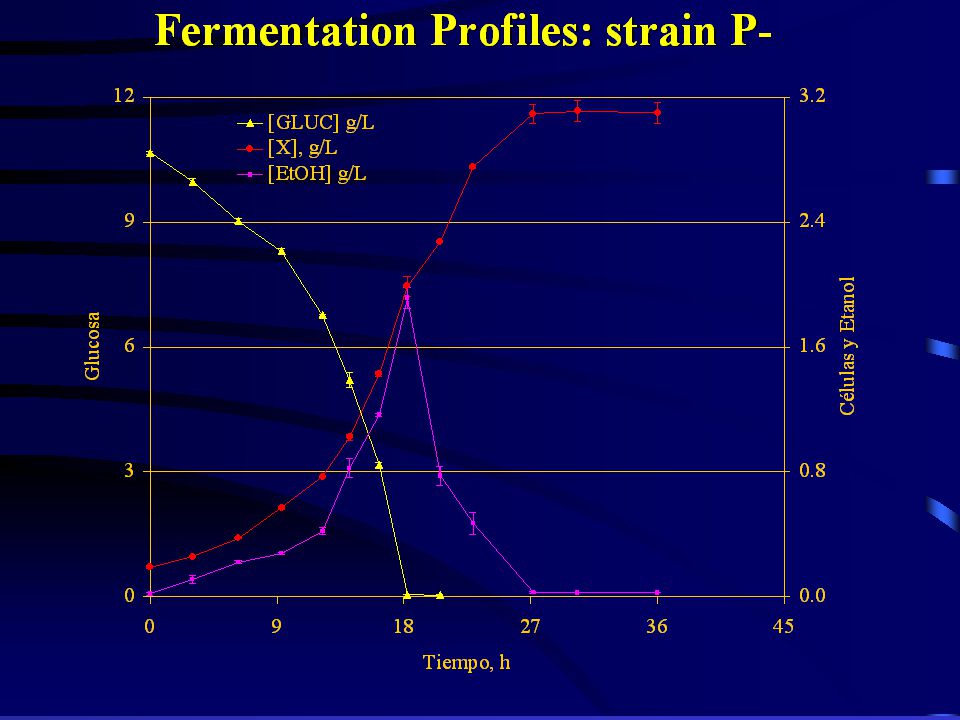
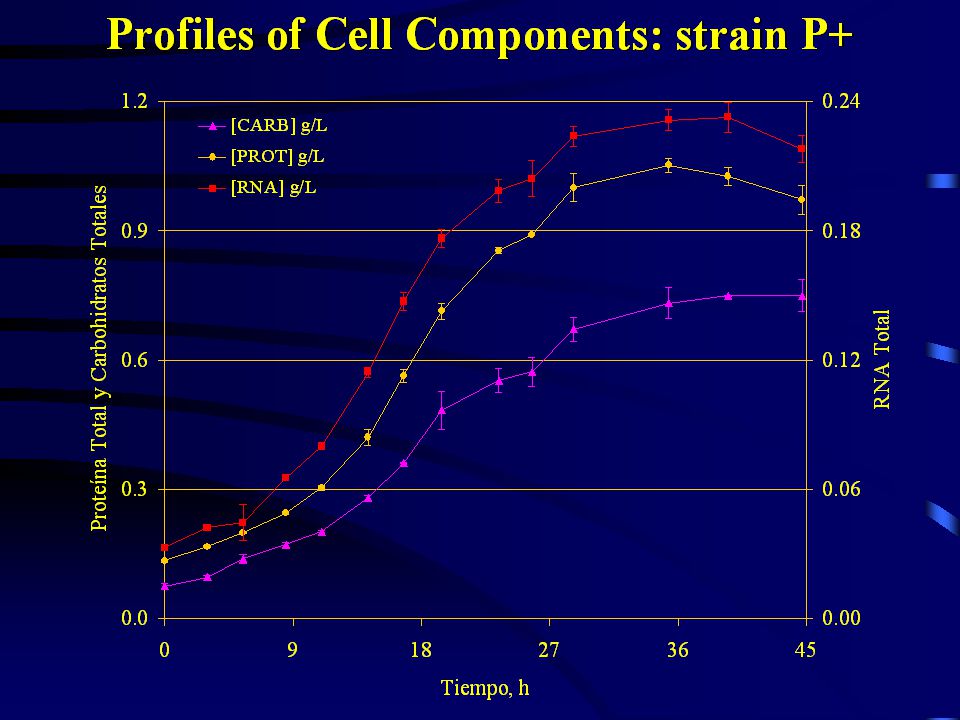
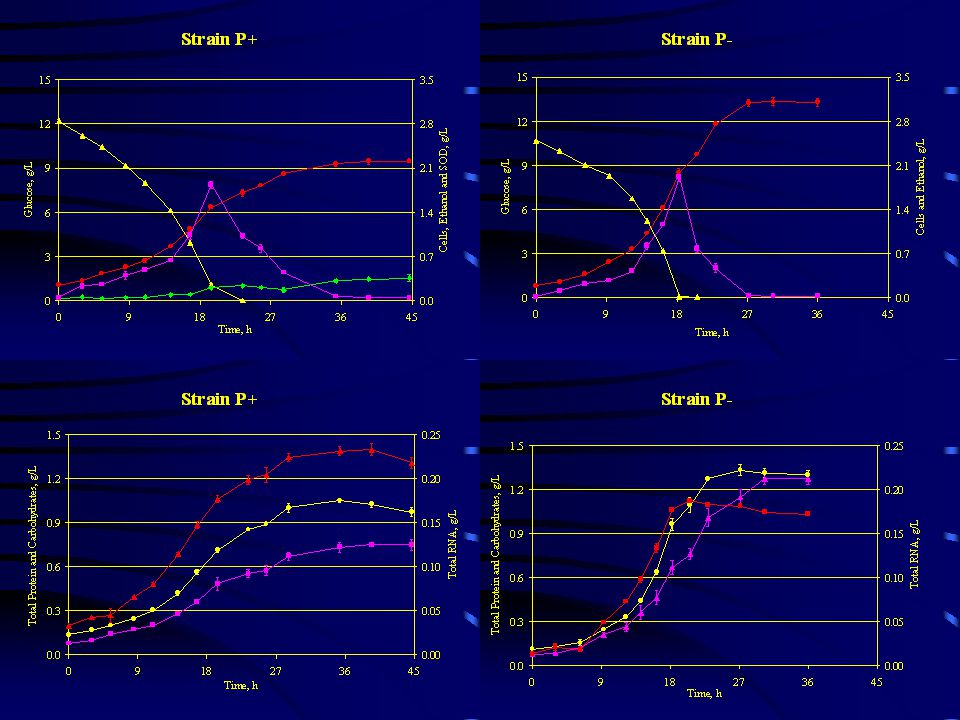
P+ Gluc/Eth

41
P+ Gluc/Eth

46
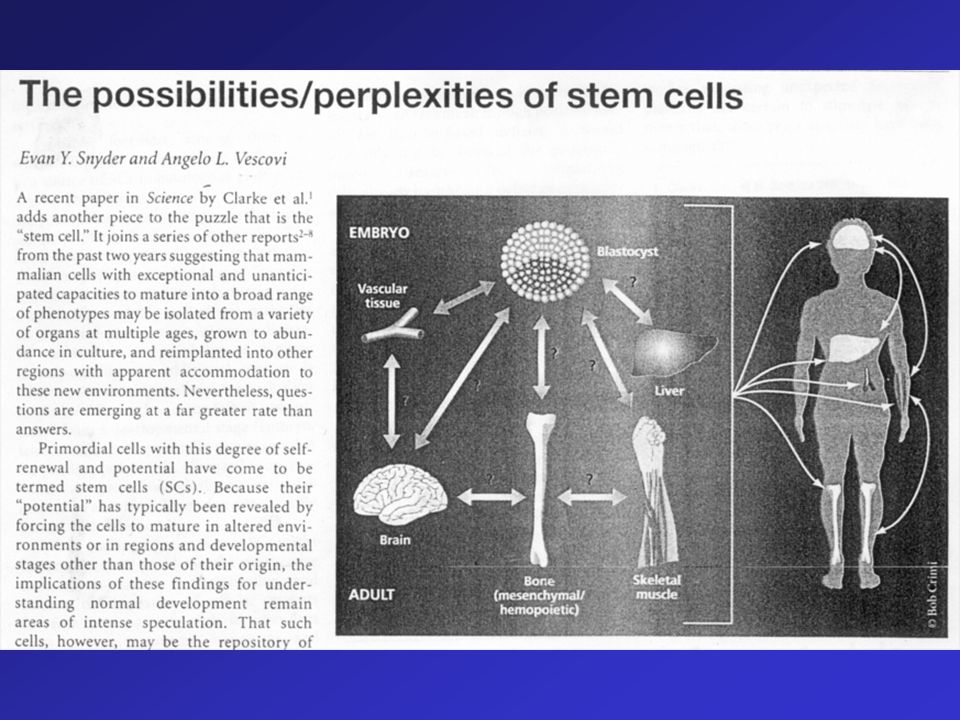
Cultivo de Tejidos - tejidos - células (e.g. sanguíneas) - órganos
 - órganos")
47
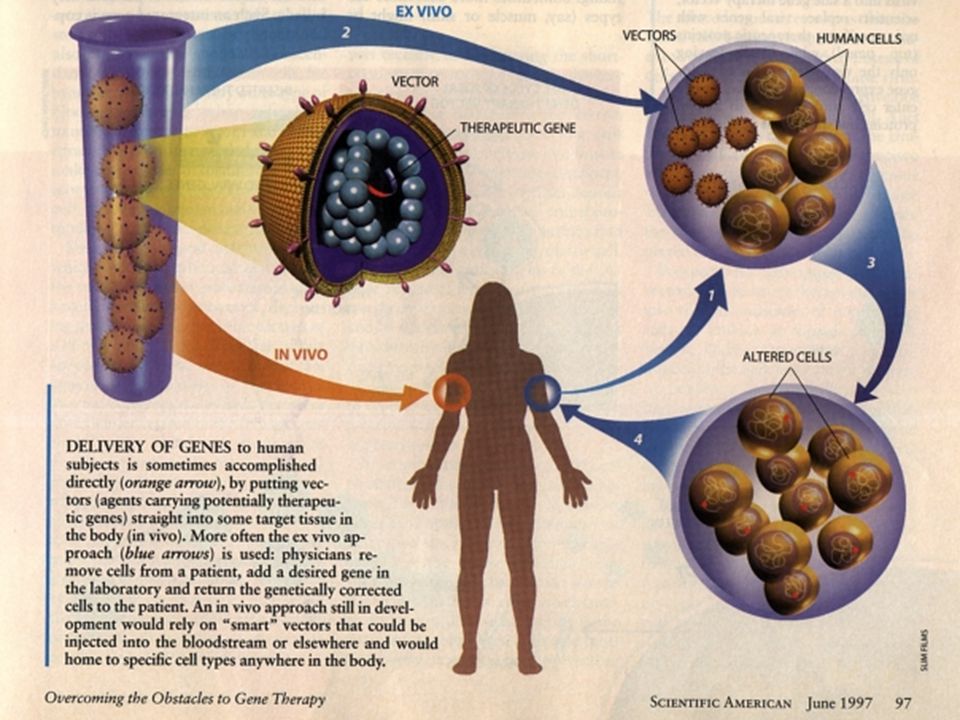
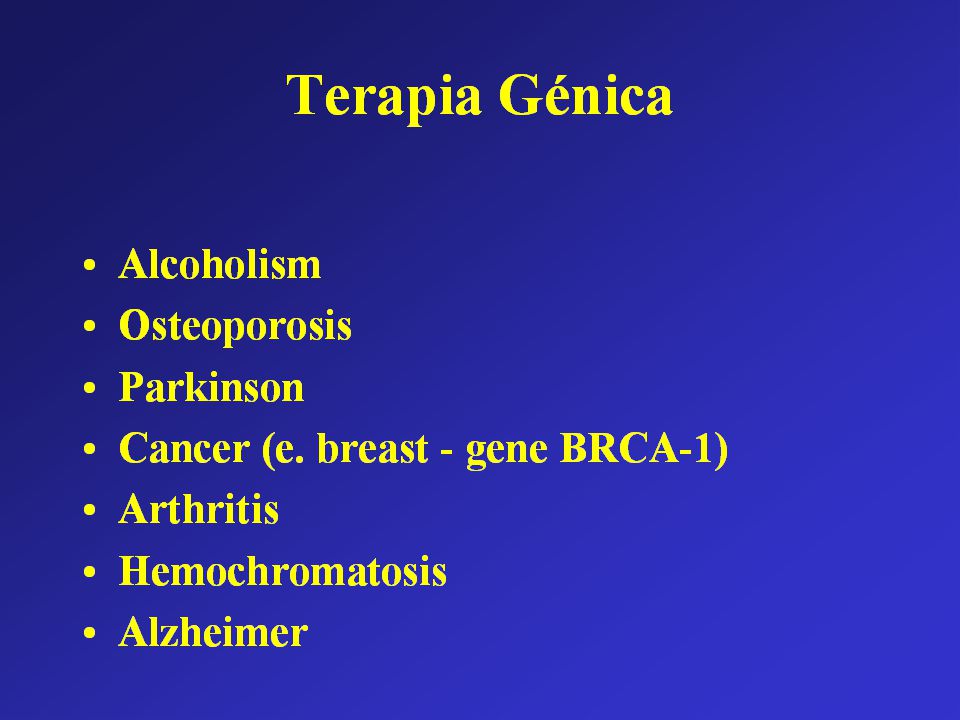
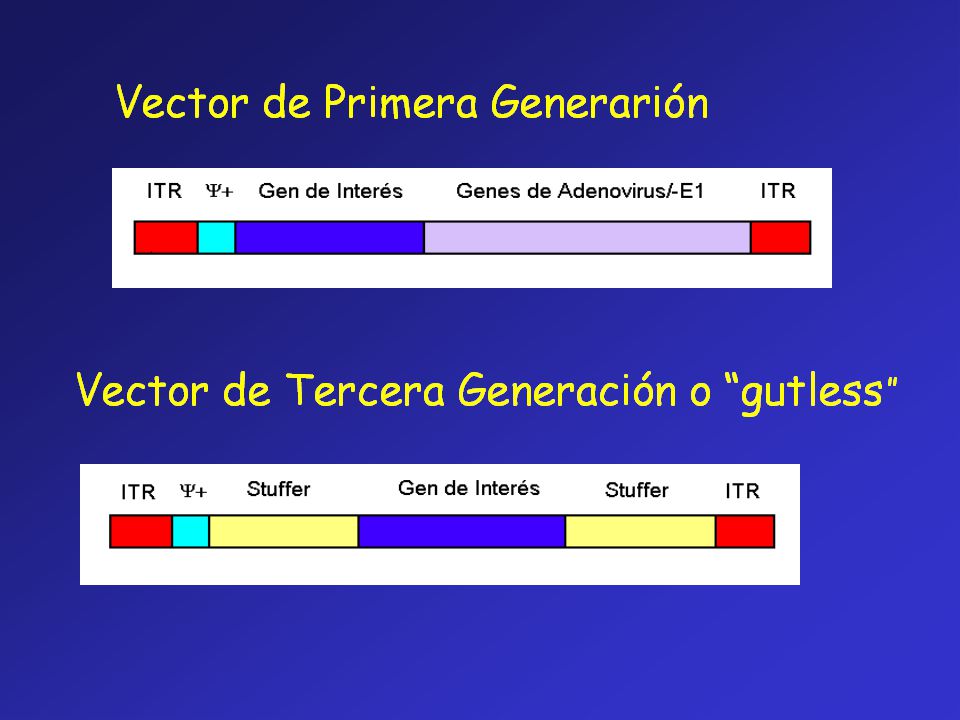
Células para Terapia Celular Vectores para Terapia Génica

50
Reduction of Ethanol Intake after Gene Therapy

53
We haven’t the money, so we’ve got to think
Ernest Lord Rutherford,

Presentaciones similares


 hasta genes completos y plásmidos. Dr. Harald Oderwald Examinador.>")

 en un organismo con el fin de modificar su material genético.>")
>")


