Descargar la presentación
La descarga está en progreso. Por favor, espere

1
J. Mauricio López R. CENAM Time and Frequency Division Statistical Analysis of Measurements (time domain)
.")
2
OUTLINE 1. Introduction 3. Allan Variance (AVAR) 4. AVAR uncertainty 5. Trazability 2. Time and Frequency Measurements 5. Time Deviation

3
Introduction

4
Real Clocks There not exist the perfect clock, all the real clocks are unestable. The output frequency of a clock changes with time. A correct mathematical tool is needed to characterise the frequency instability of oscillators. 33.0 cm 22.0 cm 35.0 cm

5
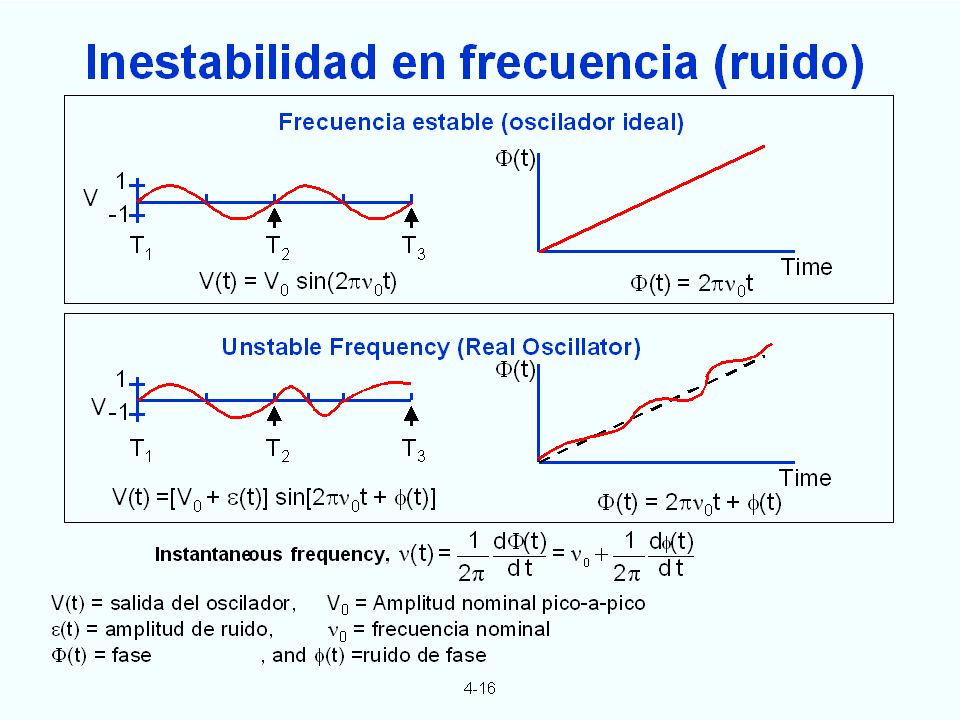
A: amplitude : frequency t: time +A -A Mathematical model for ideal frequency signal

6
V(t) = V 0 sen(2 0 t) V(t) =[V 0 + (t)] sen[2 0 t + (t)] Time Mathematical model for a real frequency signal
![V(t) = V 0 sen(2 0 t) V(t) =[V 0 + (t)] sen[2 0 t + (t)] Time Mathematical model for a real frequency signal](http://images.slideplayer.es/11/3146334/slides/slide_6.jpg "V(t) = V 0 sen(2 0 t) V(t) =[V 0 + (t)] sen[2 0 t + (t)] Time Mathematical model for a real frequency signal")
8
The Allan Variance

9
La Varianza de Allan es la herramienta usada para el análisis en el dominio del tiempo de mediciones de Tiempo y Frecuencia siendo un estimador de la dispersión de las mediciones, determinando así, la estabilidad del oscilador bajo calibración. The Allan Variance is a statistical tool used for the time domain analysis of time and frequency measurements to estimate the noise behind measurements and to determine the stability of an oscillator under calibration.

10
Time Phase difference x t

11
Time Phase difference x t

12
Time Phase difference x t

13
Time Phase difference x t

14
Time Phase difference x t

15
Time Phase difference x t

16
Time Phase difference x t

17
Time Phase difference x t

18
Time Phase difference x t

19
Time Phase difference y1y1 y2y2 y3y3 y4y4 y5y5 y6y6 y7y7 y8y8 x t t1t1 t2t2 t3t3 t4t4 t5t5 t6t6 t7t7 t8t8

20
Time Phase difference y1y1 y2y2 y3y3 y4y4 y5y5 y6y6 y7y7 y8y8 x t t1t1 t2t2 t3t3 t4t4 t5t5 t6t6 t7t7 t8t8

21
Time Phase difference y1y1 y2y2 y3y3 y4y4 y5y5 y6y6 y7y7 y8y8 x t t1t1 t2t2 t3t3 t4t4 t5t5 t6t6 t7t7 t8t8

22
Time Phase difference y1y1 y2y2 y3y3 y4y4 y5y5 y6y6 y7y7 y8y8 x t t1t1 t2t2 t3t3 t4t4 t5t5 t6t6 t7t7 t8t8 Allan Variance

23
Time Phase difference y1y1 y2y2 y3y3 y4y4 y5y5 y6y6 y7y7 y8y8 x t t1t1 t2t2 t3t3 t4t4 t5t5 t6t6 t7t7 t8t8

24
Varianza de Allan para Mediciones de Frecuencia donde: Varianza de Allan Número de datos espaciados 0 i-ésima medición de fase Tiempo de observación = m 0 =2 n cálculos posibles

25
donde: Varianza de Allan Número de datos espaciados 0 Tiempo de observación = m 0 i-ésima medición de fase =2 n cálculos posibles Varianza de Allan para Mediciones de Diferencia de Fase

26
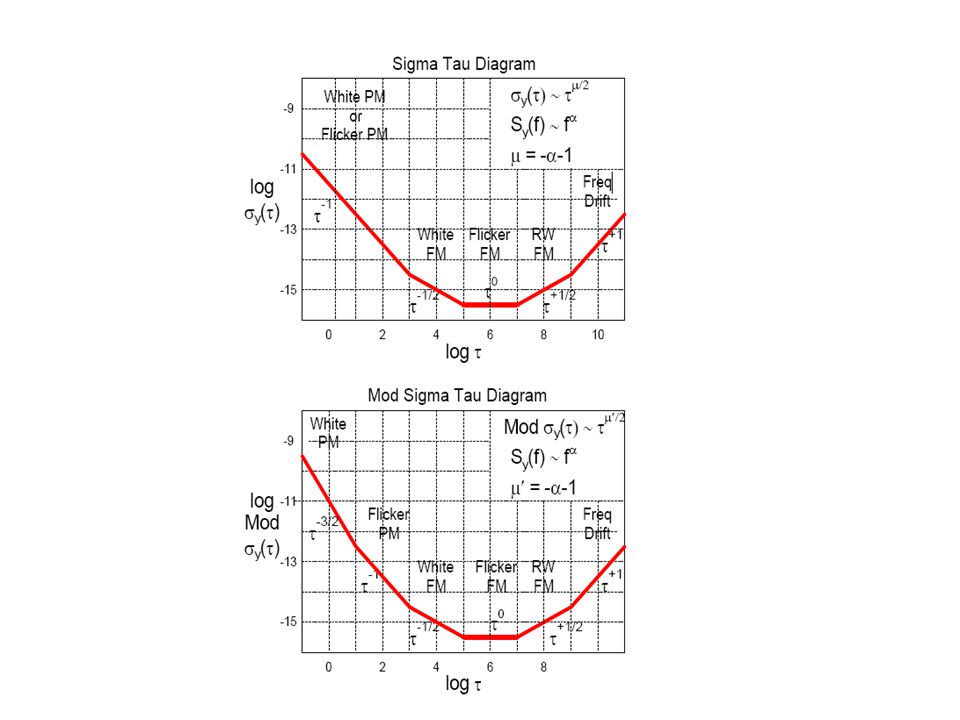
4-25 Por debajo del ruido “fliker”, los cristales de cuarzo tipicamente tienen una dependencia -1 (white phase noise). Los patrones atómicos de frecuencia muestran una dependencia del tipo -1/2 (white frequency noise) para tiempos de promediación cercanos al tiempo de ataque del lazo de amarre, y -1 para tiempos menores del tiempo de ataque. Tipicamente los ’s para el ruido flicker son: 1 s para osciladores de cuarzo, 10 3 s para relojes de rubidio y 10 5 s para Cesio. y()y() -1 00 Tipo de ruido: White phase Flicker phase White freq. Flicker freq. Random walk freq. -1 2 1212 Dependencia temporal de y ( )
 para tiempos de promediación cercanos al tiempo de ataque del lazo de amarre, y -1 para tiempos menores del tiempo de ataque. Tipicamente los ’s para el ruido flicker son: 1 s para osciladores de cuarzo, 10 3 s para relojes de rubidio y 10 5 s para Cesio. y()y() -1 00 Tipo de ruido: White phase Flicker phase White freq. Flicker freq. Random walk freq. -1 2 1212 Dependencia temporal de y ( ).")
27
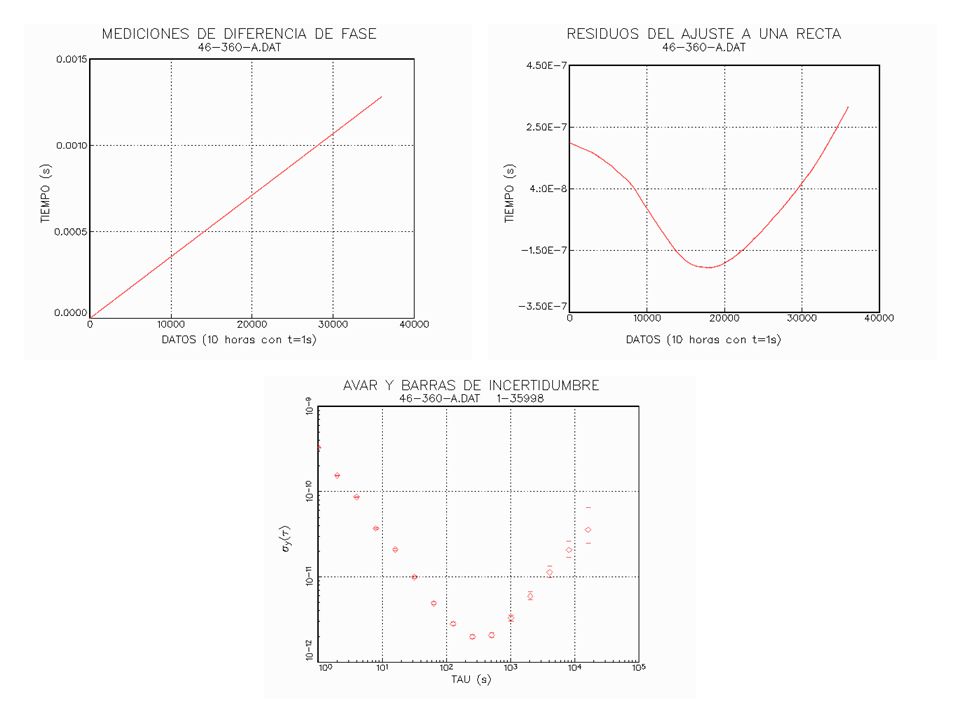
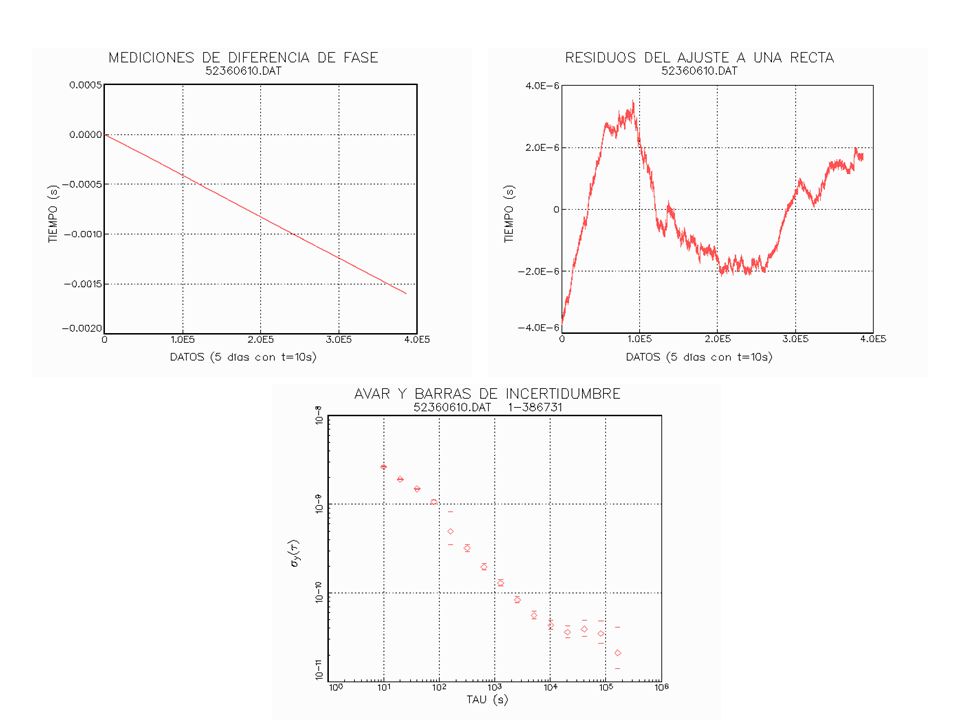
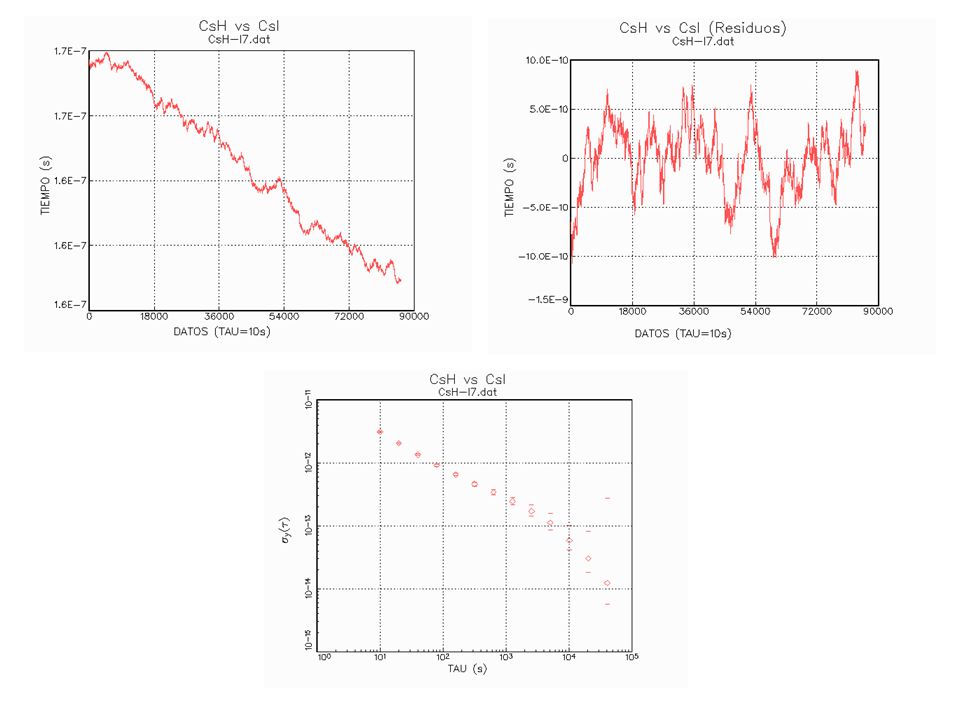
Ejemplos de cálculo de varianza de Allan

31
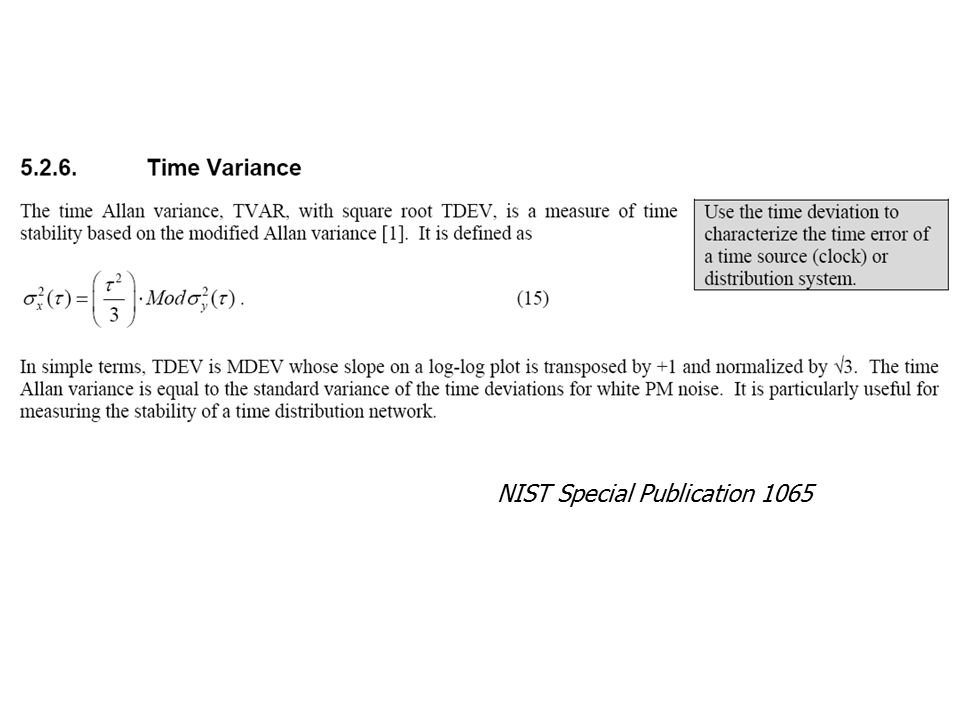
NIST Special Publication 1065

34
Incertidumbre de medición

35
La pendiente del gráfico ofrece información sobre la diferencia fraccional de frecuencia “promedio” entre los osciladores

36
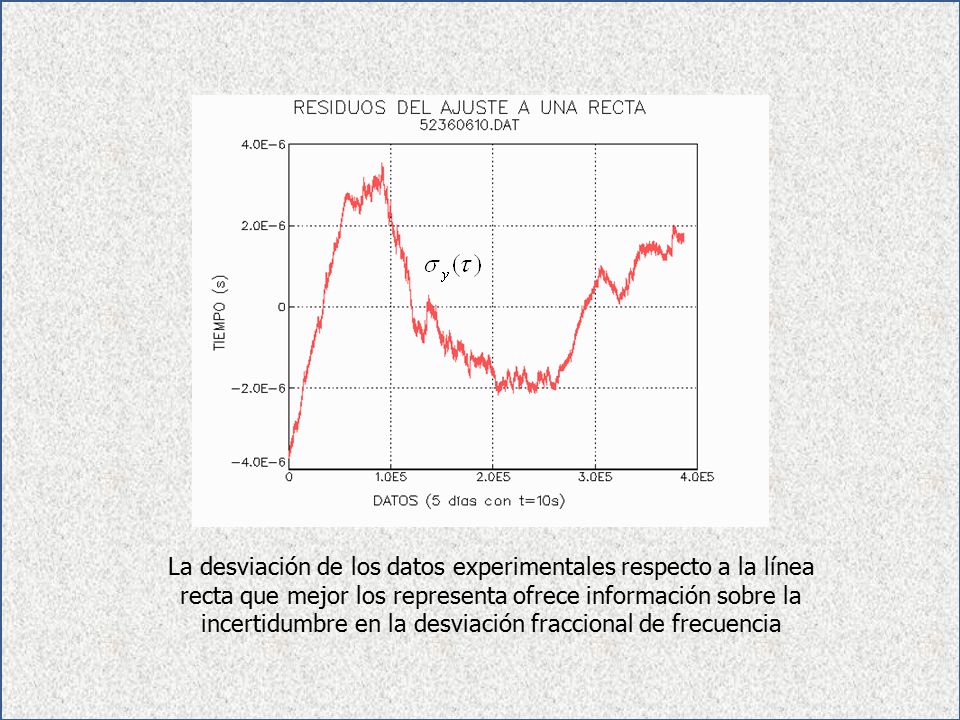
La desviación de los datos experimentales respecto a la línea recta que mejor los representa ofrece información sobre la incertidumbre en la desviación fraccional de frecuencia

37
00

38
11

39
33

41
Frecuencia del oscilador Frecuencia de referencia Factor de cobertura k=2

42
=-2Random walk frequency =-1Flicker frequency =0White frequency =+1Flicker phase =+2White phase y 2 ( ) = -1Random walk frequency = -1Flicker frequency = -1/2White frequency = 0Flicker phase = +1/2White phase Dominio de la frecuencia Dominio del tiempo 0 1 2 3 4 5 6 7 8 -17 -15 -13 -11 -9 log y White PM o flicker PM White FM Flicker FM Random walk FM
 = -1Random walk frequency = -1Flicker frequency = -1/2White frequency = 0Flicker phase = +1/2White phase Dominio de la frecuencia Dominio del tiempo log y White PM o flicker PM White FM Flicker FM Random walk FM")
43
Random walk frequency Flicker frequency White frequency Flicker phase White phase Varianza de Allan Varianza estándar =- -1 Varianza de Allan vs Varianza Estándar

44
Traceability

45
NMI 2 Labs. Sec. Labs. Ind. NMI 1 Labs. Sec. Labs. Ind. BIPM u1u1 u2u2 u´ 1 u´ 2 u´ 0 u0u0 Concepto de Trazabilidad

46
NMI 2 Labs. Sec. Labs. Ind. NMI 1 Labs. Sec. Labs. Ind. BIPM u1u1 u2u2 u´ 1 u´ 2 u´ 0 u0u0 Concepto de Trazabilidad

47
NMI 2 Labs. Sec. Labs. Ind. NMI 1 Labs. Sec. Labs. Ind. BIPM u1u1 u2u2 u´ 1 u´ 2 u´ 0 u0u0 CMC´s Concepto de Trazabilidad

48
NMI 2 Labs. Sec. Labs. Ind. NMI 1 Labs. Sec. Labs. Ind. BIPM u1u1 u2u2 u´ 1 u´ 2 u´ 0 u0u0 CMC´s CMC´s Concepto de Trazabilidad

49
NMI Labs. Sec. DUT BIPM u1u1 u2u2 u0u0 Concepto de Trazabilidad

50
NMI Labs. Sec. DUT BIPM Concepto de Trazabilidad y()0y()0 y()1y()1 y()2y()2
0y()0 y()1y()1 y()2y()2")
51
NMI Labs. Sec. DUT BIPM Concepto de Trazabilidad y()0y()0 y()1y()1 y()2y()2
0y()0 y()1y()1 y()2y()2")
52
NMI Labs. Sec. DUT BIPM Concepto de Trazabilidad y()0y()0 y()1y()1 y()2y()2 y()y()
0y()0 y()1y()1 y()2y()2 y()y().")
53
NMI Labs. Sec. DUT BIPM Concepto de Trazabilidad y()0y()0 y()1y()1 y()2y()2 y()y()
0y()0 y()1y()1 y()2y()2 y()y().")
54
NMI Labs. Sec. DUT BIPM Concepto de Trazabilidad y()0y()0 y()1y()1 y()2y()2
0y()0 y()1y()1 y()2y()2")
55
Frecuencia, f BIPM

56
Frecuencia, f f0f0 BIPM NMI Concepto de Trazabilidad

57
Frecuencia, f f0f0 BIPM NMI f0f0

58
Concepto de Trazabilidad Frecuencia, f f0f0 f1f1 NMI Lab Acred. BIPM

59
Concepto de Trazabilidad Frecuencia, f f0f0 f1f1 BIPM NMI f1f1 Lab Acred.

60
Concepto de Trazabilidad Frecuencia, f f0f0 f1f1 f2f2 BIPM NMIDUT Lab Acred.

61
Concepto de Trazabilidad Frecuencia, f f0f0 f1f1 f2f2 BIPM NMIDUT f2f2 Lab Acred.

62
Concepto de Trazabilidad Frecuencia, f f0f0 f1f1 f2f2 BIPM NMIDUT ff Lab Acred.

63
Concepto de Trazabilidad Frecuencia, f f0f0 f1f1 f2f2 BIPM NMIDUT Lab Acred.

64
Concepto de Trazabilidad y()0y()0 y()1y()1 y()2y()2
0y()0 y()1y()1 y()2y()2 ")
65
J. Mauricio López R. CENAM Time and Frequency Division Statistical Analysis of Measurements (time domain) THANK YOU!!
 THANK YOU!!.")
Presentaciones similares


>")

>")


 Sistema Interamericano de Metrología, SIM Sistema.>")


