Descargar la presentación
La descarga está en progreso. Por favor, espere

1
Jesper Venema – OIT/ETM, San José
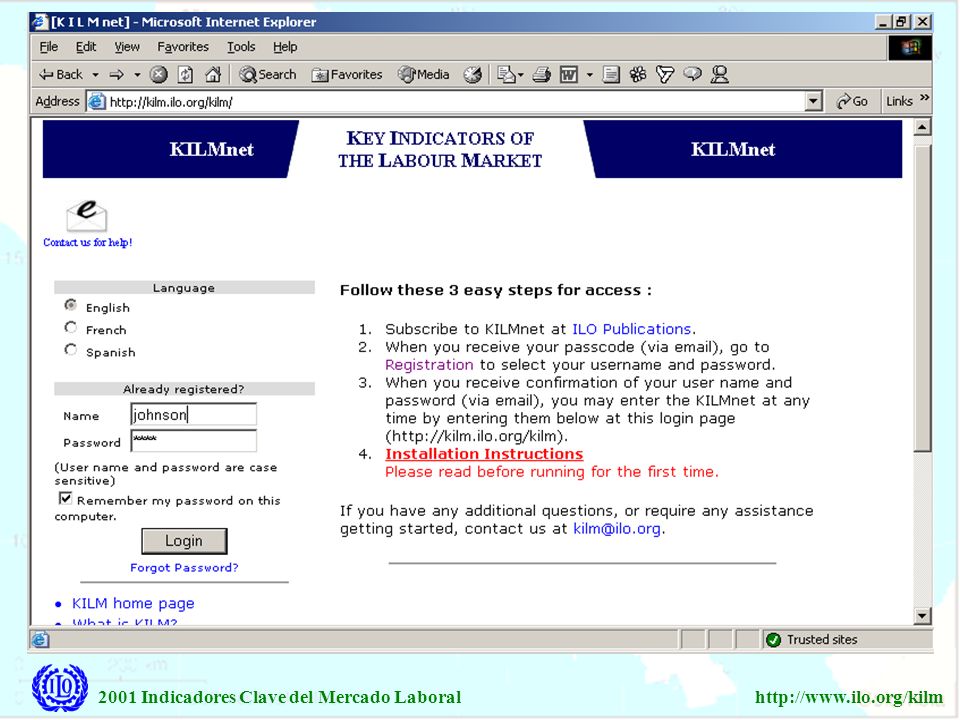
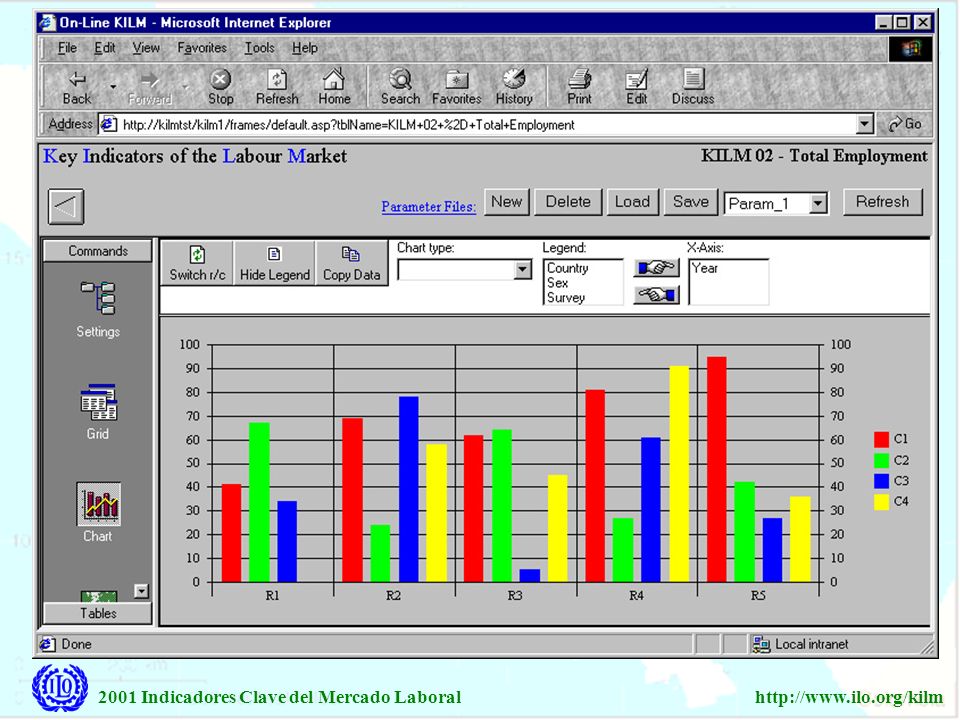
Santa Cruz, Bolivia Mayo 15, 2001 Jesper Venema – OIT/ETM, San José Indicadores Clave del Mercado Laboral K I L M

2
Globalización y avances tecnológicos dirigen un cambio en el mundo laboral
As we enter a new millennium, it is increasingly clear that we are affected as much by global events and developments as by what occurs within our own communities. As the world’s population becomes more interdependent, the need to enhance our understanding of the world of work becomes increasingly important. Our most resent estimates show the global labour force was nearly 2.7 billion with the number of unemployed reaching 160 million, corresponding to a global unemployment rate of 6 per cent. Of the 166 million, 41 percent or 66 million are young women and men. In addition, about 500 million are “working poor” who are unable to earn more than US$1 per day, enough to keep their families out of poverty. This estimate does not reflect the number of individuals that are underempled

3
Preguntas: ¿ A que tipos de actividades económicas se dedica la gente?
¿ Cual es el tamaño y composición de la fuerza de trabajo? ¿ Cuantas horas trabaja la gente y cuanto gana por ese trabajo? ¿ Cuantas personas están sin empleo y están buscando empleo? ¿ Que tipos de desigualdad existen, por ejemplo en términos de ingresos y situaciones de empleo? ¿ Los sueldos siguen los gastos de mantenimiento? ¿ Cual es la situación de los juveniles y las mujeres en el mercado laboral? Timely and focused information on the world’s labour markets is essential – information that can help to answer such questions as: What types of economic activities are countries and people engaged in? Who is doing the work? How many hours do people work and how much do they earn for this work? How many people are without work and looking for work? What types of inequalities exist in terms of work? Are earnings keeping pace with the cost of living? How are women and younger people faring? Answering these questions requires detailed analysis of a large volume of informaton At the national level statistical information is generally developed and analysed by statistical services and labour ministries. The ILO plays a vital role in assembling, analysing and disseminating information through projects such as the Key Indicators of the Labour Market (KILM).
.")
4
Criterios para la selección de indicadores:
El indicador es conceptualmente relevante . Hay datos para el indicador. El indicador es comparable entre países y regiones. In 1997, a collaborative effort involving experts from the ILO and various international and national organisation was undertaken to complete the selection and refinement of the KILM indicators. The indicators were chosen based on three criteria: conceptual relevance, data availability and, where possible, comparability across countries and regions.

5
Cuando se diseña indicadores, se debe buscar un balance entre:
Cobertura Comparabilidad Maximizar la cobertura, es decir proveer el numero mas grande de observaciones para el numero mas grande de países. Armonizar los indicadores entre países y el tiempo (los mismos tipos de fuentes, procedimientos de muestras, metodologías, y definiciones). The collection and dissemination of labour market indicators can present an interesting dilemma. How does one balance a desire to provide the greatest degree of geographical coverage for a specified time period with the need of insuring the greatest level of comparability? It is difficult to achieve a harmonious balance between coverage and comparability. The only realistic way of resolving the problem is to provide as much information as possible while making sure to redflag the accompanying methodological information so as to allow the users a chance of making informed decisions regarding the comparability of the data. In producing the KILM, a special effort was made to include text that relates the "limitations to comparability" for each indicator. Notes on methodology and sources are also placed as explicitly as possible in each data table.
. The collection and dissemination of labour market indicators can present an interesting dilemma. How does one balance a desire to provide the greatest degree of geographical coverage for a specified time period with the need of insuring the greatest level of comparability It is difficult to achieve a harmonious balance between coverage and comparability. The only realistic way of resolving the problem is to provide as much information as possible while making sure to redflag the accompanying methodological information so as to allow the users a chance of making informed decisions regarding the comparability of the data. In producing the KILM, a special effort was made to include text that relates the limitations to comparability for each indicator. Notes on methodology and sources are also placed as explicitly as possible in each data table.")
6
Indicadores Clave del Mercado Laboral
Tasa de participación Tasa de ocupación Empleo por situación Empleo por rama de actividad Trabajadores a tiempo parcial Desempleo por nivel de educación Horas de trabajo Subempleo Empleo en el sector informal Tasa de inactividad Desempleo Niveles educacionales y analfabetismo Desempleo juvenil Índices reales de sueldos industriales Desempleo a largo plazo Sueldos y ingresos por ocupación Costos de compensación por hora Productividad y costos laborales unitarios Flujos en el mercado laboral Pobreza y distribución de ingresos

7
Fuentes de Información
Initial efforts in developing the project concentrated on harvesting information directly from international repositories. In other words, the team did not focus on contacting national sources, but rather the team responsible for the project took advantage of existing compilations of information held by various international organizations. Regional and national data sources were sought directly only when data were unavailable from one of the repositories. The ILO regional offices and multidisciplinary advisory teams (MDTs) assisted by providing access to regional labour market informatoin. The regional offices and MDTs also actively participated in locating and analysing a variety of data from national and regional statistical sources.
 assisted by providing access to regional labour market informatoin. The regional offices and MDTs also actively participated in locating and analysing a variety of data from national and regional statistical sources.")
8
Ningún indicador sobre el mercado laboral puede proveer una vista clara y exacta para los asuntos políticos que cargan los partidos tripartitos. Igual que una consulta medica, se necesita un número de indicadores.

9
Empleo por situación, economías seleccionadas
Indicators of status in employment distinguish between three important and useful categories of the total employed. These are: (a) wage and salaried workers, or employees; (b) self-employed workers; and (c) contributing family workers (also termed unpaid family workers). These three groups of workers are presented as percentages of the total employed for both sexes and for male and female separately There are important differences in status in employment between developed and developing economies. Within developed (industrialized) economies, the proportion of wage and salaried workers is as high as 80 - or even 90 - per cent of the total employed, the self-employed typically account for between 10 to 15 per cent and unpaid family workers are generally quite low. In developing economies, the proportions are much smaller for wage and salaried workers - but with greater variation. For example, Singapore had 86 per cent in wage and salaried employment in 1999 in comparison to Peru at 46 per cent. In Latin American economies, where the major share of new jobs has been in the informal sector, self-employment accounts for 25 to 40 per cent of total employment in the total (or urban) economy.
 wage and salaried workers, or employees; (b) self-employed workers; and (c) contributing family workers (also termed unpaid family workers). These three groups of workers are presented as percentages of the total employed for both sexes and for male and female separately. There are important differences in status in employment between developed and developing economies. Within developed (industrialized) economies, the proportion of wage and salaried workers is as high as 80 - or even 90 - per cent of the total employed, the self-employed typically account for between 10 to 15 per cent and unpaid family workers are generally quite low. In developing economies, the proportions are much smaller for wage and salaried workers - but with greater variation. For example, Singapore had 86 per cent in wage and salaried employment in 1999 in comparison to Peru at 46 per cent. In Latin American economies, where the major share of new jobs has been in the informal sector, self-employment accounts for 25 to 40 per cent of total employment in the total (or urban) economy.")
10
Empleo en el sector informal (porcentaje del empleo total), últimos años
Information for Latin America and the Caribbean shows a different picture. In 11 of the 15 economies for which information by sex are available the share of informal sector employment is higher for men than for women. However, in some of these economies the gap has narrowed during the 1990s. In four economies in that region (Bolivia, Ecuador, Honduras and Peru), the informal sector already has a relatively greater importance for women's employment than for men's. In many economies, especially those in Latin America, information on the informal sector is available for urban areas only. In some economies, information for the informal sector is restricted to urban areas or even major metropolitan areas or capital cities. Of equal significance is the fact that some economies include small-scale or unregistered agricultural activities in their definition of the informal sector, while others do not. The vast majority of agricultural activities in most economies are undertaken in rural areas. In 17 of these economies, employment in the informal, or related, sectors accounts for more than 50 per cent of total employment. These include nine African economies, seven Latin American economies (Brazil, Bolivia, Colombia, Ecuador, Honduras, Paraguay and Peru) and one Asian country. The highest shares (more than 70 per cent) were recorded in Gambia, Ghana, Mali and Uganda. Time-series data that allow for the analysis of change over time are available for only 17 economies. The data show that in virtually all cases the share of informal sector employment has increased during the 1990s; the largest increases for the indicator were observed in Bolivia, Kenya and Venezuela. For Latin American economies, the typical pattern has been an increase of the indicator during the first half of the 1990s, followed by a stagnation or decrease during the latter years. Brazil, Chile, Honduras, Paraguay, Peru, and Venezuela are exceptions to this pattern. For Chile, the indicator remained almost constant, while for Brazil, Honduras, Paraguay, Peru and Venezuela it continued to increase during the whole decade. Menos de 10 % Entre 25 y 49.9 % 70 % o más Entre 10 y 24.9 % Entre 50 y 69.9 %
, the informal sector already has a relatively greater importance for women s employment than for men s. In many economies, especially those in Latin America, information on the informal sector is available for urban areas only. In some economies, information for the informal sector is restricted to urban areas or even major metropolitan areas or capital cities. Of equal significance is the fact that some economies include small-scale or unregistered agricultural activities in their definition of the informal sector, while others do not. The vast majority of agricultural activities in most economies are undertaken in rural areas. In 17 of these economies, employment in the informal, or related, sectors accounts for more than 50 per cent of total employment. These include nine African economies, seven Latin American economies (Brazil, Bolivia, Colombia, Ecuador, Honduras, Paraguay and Peru) and one Asian country. The highest shares (more than 70 per cent) were recorded in Gambia, Ghana, Mali and Uganda. Time-series data that allow for the analysis of change over time are available for only 17 economies. The data show that in virtually all cases the share of informal sector employment has increased during the 1990s; the largest increases for the indicator were observed in Bolivia, Kenya and Venezuela. For Latin American economies, the typical pattern has been an increase of the indicator during the first half of the 1990s, followed by a stagnation or decrease during the latter years. Brazil, Chile, Honduras, Paraguay, Peru, and Venezuela are exceptions to this pattern. For Chile, the indicator remained almost constant, while for Brazil, Honduras, Paraguay, Peru and Venezuela it continued to increase during the whole decade. Menos de 10 % Entre 25 y 49.9 % 70 % o más. Entre 10 y 24.9 % Entre 50 y 69.9 %")
11
Tasa de desempleo, ambos sexos
For many economies, the unemployment rate is probably the best-known labour market measure. Together with the employment-to-population ratio, it provides the broadest indicator of the labour market situation in economies that collect information on the labour force. The 2001 KILM has assembled unemployment information for 127 economies. While the unemployment rate is considered by many to be the single, most informative labour market indicator to provide knowledge about the general performance of the labour market and the economy as a whole, it should not be interpreted as a measure of economic hardship or well-being. Looking at all rates for latest years of all economies, the number of economies with reported rates that were at or above the 7 per cent mark remain high. As expected, economies in the developed (industrialized) grouping continued to have high rates To be sure, 7 per cent may not necessarily be regarded as a high unemployment rate by national policy-makers some economies routinely have had rates in high double digits but for many economies rates that extreme imply that they could be in recession (determined through other means, mostly through national account statistics) or suffering from unhealthy economic conditions. Among the 37 Latin American and Caribbean economies the rates increased in 15, decreased in seven and remained relatively stable in the remaining economies. Menos del 5 por ciento Entre el 5 y el 9.9 por ciento Entre el 10 y 14.9 por ciento Entre el 15 y 25 por ciento Información no disponible
 grouping continued to have high rates To be sure, 7 per cent may not necessarily be regarded as a high unemployment rate by national policy-makers some economies routinely have had rates in high double digits but for many economies rates that extreme imply that they could be in recession (determined through other means, mostly through national account statistics) or suffering from unhealthy economic conditions. Among the 37 Latin American and Caribbean economies the rates increased in 15, decreased in seven and remained relatively stable in the remaining economies. Menos del 5 por ciento. Entre el 5 y el 9.9 por ciento. Entre el 10 y 14.9 por ciento. Entre el 15 y 25 por ciento. Información no disponible.")
12
Tasa de desempleo juvenil, ambos sexos
More than forty per cent of the unemployed in the world were young women and men. The youth unemployment rate was higher than the adult rate in all regions with information available. The incidence of unemployment among young people was generally twice the rate of adult unemployment in the developed (industrialized) economies, the Transition economies, Asia and the Pacific and Latin America and the Caribbean regions. A higher youth unemployment rate is not surprising, however; it simply reflects the fact that the risk of unemployment is higher at labour market entry points than at any other point. But at twice the adult rate, the youth rate is revealing and points to a need to focus on youth unemployment in national labour market policies. In 1999, in Latin America and the Caribbean eight of 17 economies with information on youth unemployment showed rates of at least 25 per cent. At the same time, however, eight economies, mainly in Latin America, show rates that are persistently below 15 per cent throughout the 1990s. Menos del 10 por ciento Entre el 10 y el 19.9 por ciento Entre el 20 y 29.9 por ciento Más del 30 por ciento Información no disponible
 economies, the Transition economies, Asia and the Pacific and Latin America and the Caribbean regions. A higher youth unemployment rate is not surprising, however; it simply reflects the fact that the risk of unemployment is higher at labour market entry points than at any other point. But at twice the adult rate, the youth rate is revealing and points to a need to focus on youth unemployment in national labour market policies. In 1999, in Latin America and the Caribbean eight of 17 economies with information on youth unemployment showed rates of at least 25 per cent. At the same time, however, eight economies, mainly in Latin America, show rates that are persistently below 15 per cent throughout the 1990s. Menos del 10 por ciento. Entre el 10 y el 19.9 por ciento. Entre el 20 y 29.9 por ciento. Más del 30 por ciento. Información no disponible.")
13
Tasas de desempleo, desempleo juvenil y subempleo
30 El Salvador Peru Colombia 25 Subempleo Desempleo juvenil 20 Desempleo juvenil The 17 Asian and Pacific economies with data, where the economic crisis recently hit hard, show that the total unemployment rates increased in 11 economies, even doubling or more in Hong Kong (China), Republic of Korea, Macau (China) and Thailand, to the detriment of both men and women. It is interesting to note, however, that in many of these economies there was a corresponding increase in the labour force, implying that economic hardship was dealt with, in part, by persons previously outside of the labour force (oftentimes women) re-joining the work force in order to offset a loss of household income resulting from unemployment. Also, the unemployment situation in the "crises" economies, seems to have improved in the past couple of years. Men seem to have suffered worse than women in terms of unemployment in economies such as Korea and Macau (China), which indicates that it was probably heavy industry (which is largely male-dominated) that was harder hit in these economies. % 15 Desempleo 10 5 Desempleo Desempleo 1990 1991 1992 1993 1994 1995 1996 1997 1998 1999 Años
, Republic of Korea, Macau (China) and Thailand, to the detriment of both men and women. It is interesting to note, however, that in many of these economies there was a corresponding increase in the labour force, implying that economic hardship was dealt with, in part, by persons previously outside of the labour force (oftentimes women) re-joining the work force in order to offset a loss of household income resulting from unemployment. Also, the unemployment situation in the crises economies, seems to have improved in the past couple of years. Men seem to have suffered worse than women in terms of unemployment in economies such as Korea and Macau (China), which indicates that it was probably heavy industry (which is largely male-dominated) that was harder hit in these economies. % 15. Desempleo Desempleo. Desempleo Años.")
14
Sueldos reales industriales, países seleccionados
The selection of this indicator was prompted by several considerations. Information on average wages represents one of the most important branches of labour market information. Wages are a substantial form of income, accruing to a high proportion of the economically active population, namely persons in paid employment. Information on wage levels is essential in evaluating the living standards and conditions of work and life of this group of workers in both industrialized and developing economies. The need for information on average wages is particularly important in the planning of economic and social development, establishing income and fiscal policies, regulating minimum wages and collective bargaining, and fixing social security contributions and benefits. In addition, international standards have long been developed, adopted and implemented for the concepts, scope and methods of collection, compilation and classification of wages statistics. This should, in principle, facilitate international comparisons. Real wage trends in Latin America are somewhat diverse. In Argentina, the trend for the 1990s is flat. Several economies showed decreases in very recent years (1998 or 1999) that halted a trend of rising wages in the 1990s. There was a generally downward trend for Venezuela. Chile experienced a considerable decline in real wages after 1992, followed by a very slow recovery up to the end of the decade. Countries with steady increases in the later 1990s include Colombia and Costa Rica. Real wages for Honduras and Mexico rose in the early 1990s and fell below 1990 levels later in the decade. The pattern for wages in the Caribbean is varied.
 that halted a trend of rising wages in the 1990s. There was a generally downward trend for Venezuela. Chile experienced a considerable decline in real wages after 1992, followed by a very slow recovery up to the end of the decade. Countries with steady increases in the later 1990s include Colombia and Costa Rica. Real wages for Honduras and Mexico rose in the early 1990s and fell below 1990 levels later in the decade. The pattern for wages in the Caribbean is varied.")
15
Crecimiento del valor añadido por ocupado Economía Total (1980 hasta último año)
Economic growth in an economy or a sector can be ascribed either to increased employment or to more effective work by those who are employed. The latter effect can be described through information on labour productivity. Labour productivity therefore is a key measure of economic performance. The understanding of the driving forces behind it, in particular the accumulation of machinery and equipment, improvements in organization as well as physical and institutional infrastructures, improved health and skills of workers (“human capital”) and the generation of new technology, is important for formulating policies to support economic growth. Such policies may focus on regulations on industries and trade, institutional innovations, government investment programmes in infrastructures as well as human capital, technology or any combination of these. Labour productivity estimates can serve to develop and monitor the effects of labour market policies. For example, high labour productivity is often associated with high levels or particular types of human capital, indicating priorities for specific education and training policies. Likewise, trends in productivity estimates can be used to understand the effects of wage settlements on rates of inflation or to ensure that such settlements will compensate workers for (part of) realized productivity improvements. Between 1980 and 1999, average productivity growth in these Asian economies was about 2.4 percentage points faster than for the OECD economies and the productivity gap relative to the United States improved by more than 5 percentage points. Rechazado Menos del 30 % crecimiento Entre el 30 y 40 % “” Entre el 40 y 80 % ”” 80 % y más “” Información no disponible
 and the generation of new technology, is important for formulating policies to support economic growth. Such policies may focus on regulations on industries and trade, institutional innovations, government investment programmes in infrastructures as well as human capital, technology or any combination of these. Labour productivity estimates can serve to develop and monitor the effects of labour market policies. For example, high labour productivity is often associated with high levels or particular types of human capital, indicating priorities for specific education and training policies. Likewise, trends in productivity estimates can be used to understand the effects of wage settlements on rates of inflation or to ensure that such settlements will compensate workers for (part of) realized productivity improvements. Between 1980 and 1999, average productivity growth in these Asian economies was about 2.4 percentage points faster than for the OECD economies and the productivity gap relative to the United States improved by more than 5 percentage points. Rechazado. Menos del 30 % crecimiento. Entre el 30 y 40 % Entre el 40 y 80 % 80 % y más Información no disponible.")
16
Artículos científicos
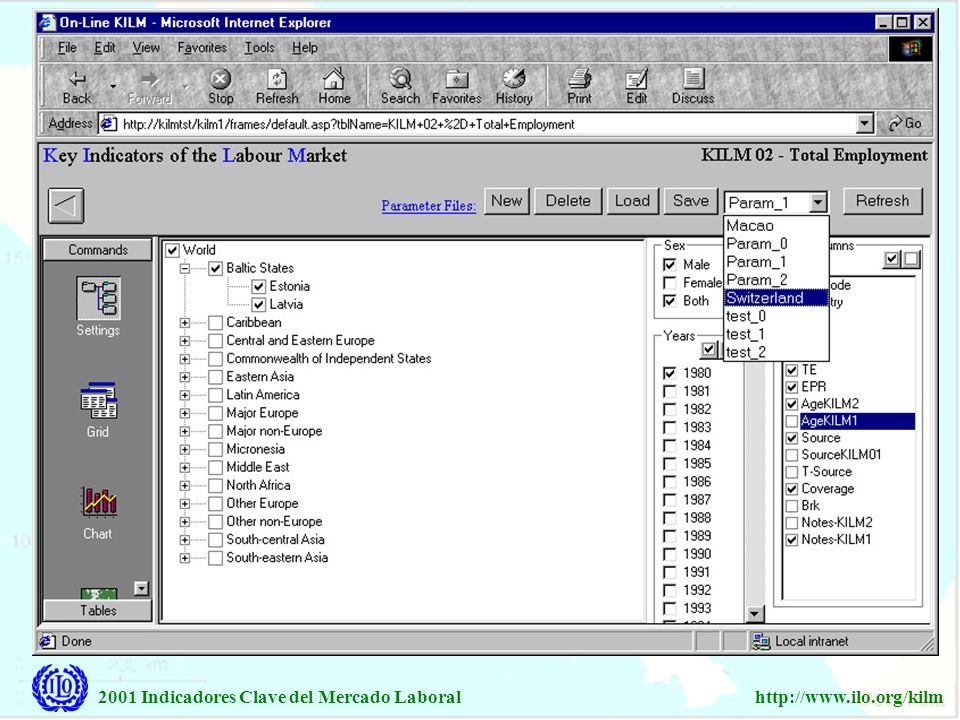
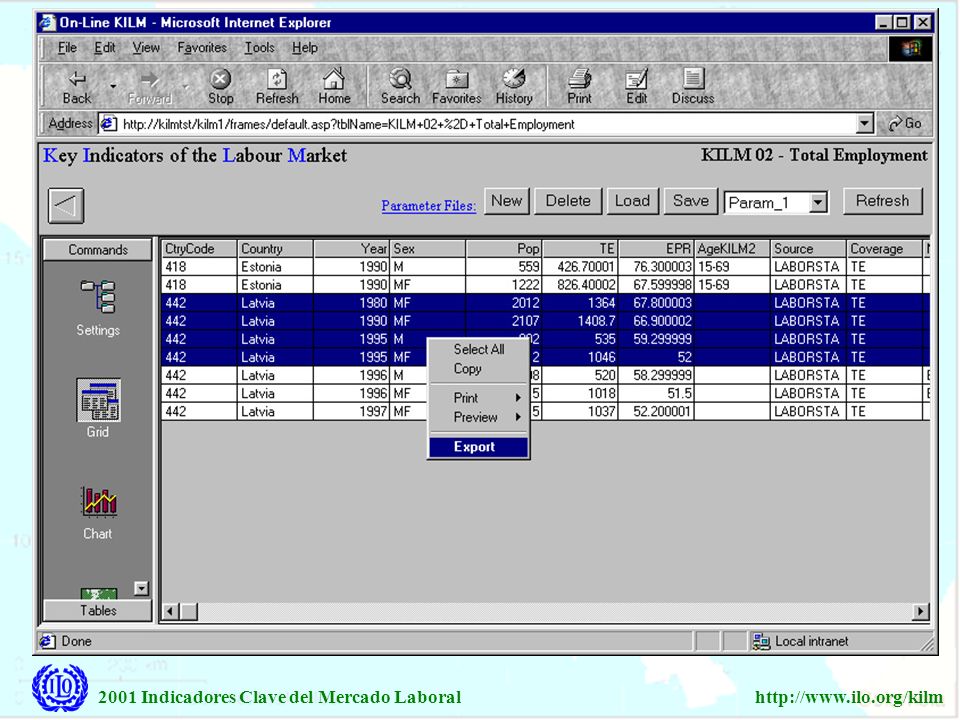
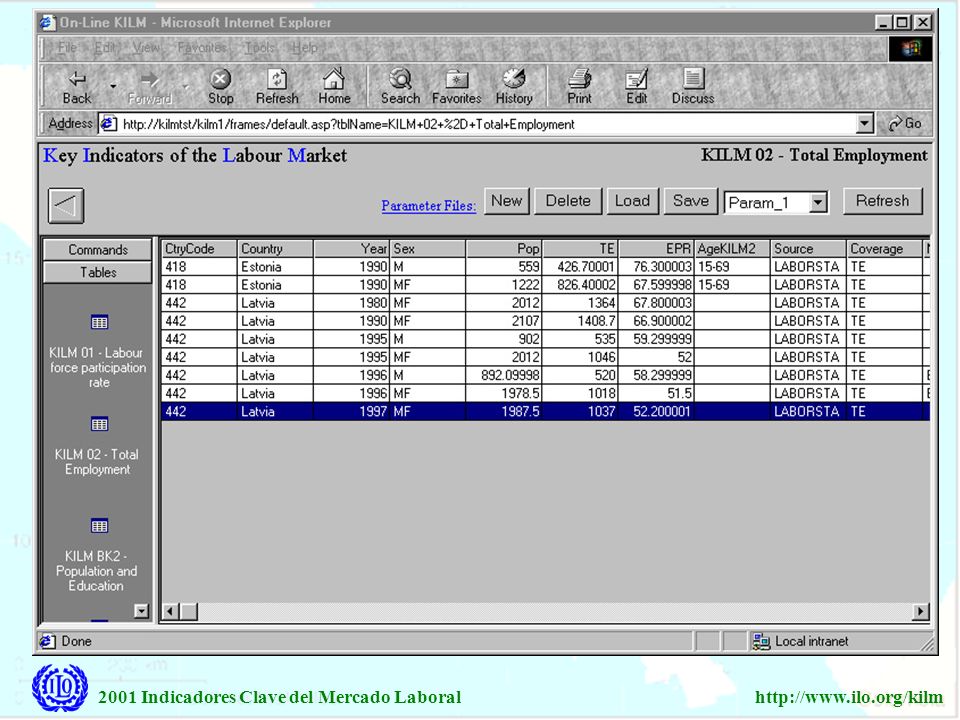
Productos Publicación In order to meet the needs of users, the ILO is making the KILM information available in a variety of formats. The main KILM products are the publication, CD-ROM that will be accompanied by a country profile report. The CD-ROM version of KILM provide an interactive software that allows users to select the indicators by country, year, type of source, or other user-defined criteria that correspond to specific research needs. It duplicates the bound publication while adding features unavailable in the print version such as data for the years of The 1999 Country Profiles report provides users with an easy and fast reference guide to the set of indicators by country. Other KILM products include an internet website and an intranet website that allows for the interactive exchange of data between the ILO field offices and headquarters. Sitio web CD-ROM Artículos científicos

23
PROYECTO SUBREGIONAL PARA CENTROAMÉRICA
Establecer red de indicadores laborales y guías metodológicas a través del Internet Sacar indicadores e información metodológica Comentar sobre indicadores y experimentar con indicadores nuevos, especialmente relevantes para la sub-región.

24
PROYECTO SUBREGIONAL PARA CENTROAMÉRICA
Cooperación técnica Establecimiento de Sistemas de Información Laboral automatizadas Previsto para: Honduras: Ministerio de Trabajo PRESUPUESTO ANUAL: USD Panamá: Ministerio de Trabajo Cuba: Oficina Nacional de Estadísticas

25
Desarollo de Sistemas de Información
Formulación, Monitoreo y Evaluación de Políticas Colección de información Colección de información Disseminación de información Análisis Análisis Formulación, Monitoreo y Evaluación de Políticas Disseminación de información

26
Jesper Venema – OIT/ETM, San José
Santa Cruz, Bolivia Mayo 15, 2001 Jesper Venema – OIT/ETM, San José Indicadores Clave del Mercado Laboral K I L M

Presentaciones similares


 Martín Cicowiez (CEDLAS) Pablo Sauma (Consultor CEPAL) Presentación elaborada para el primer.>")


