Descargar la presentación
La descarga está en progreso. Por favor, espere

1
Enfermedad Cardiovascular en Pacientes con Insuficiencia Renal Crónica
Jorge M Diego, MD, Profesor Asistente de Medicina Clínica Escuela de Medicina de la Universidad de Miami

3
Mortalidad por Enfermedad Cardiovascular (ECV) según Edad, Raza, Sexo en Pacientes con Insuficiencia Renal Terminal (IRT) y en la Población General % Mortaidad Anual Edad (año) Hombre GP Mujer GP Raza Negra GP Caucásica GP Hombre en Diálisis Mujer en Diálisis Raza Negra en Diálisis Raza Caucásica en Diálisis 25-34 35-44 45-54 55-64 65-74 75-84 >85 100 10 1 0.1 0.01 Población General Población en Diálisis NKF Task Force on Cardiovascular Disease. Am J Kidney Dis. 1998;32(suppl 3):S115.Sarnak MJ, Levey AS. Am J Kidney Dis. 2000;35(suppl 1):S117-S131.
 Hombre GP. Mujer GP. Raza Negra GP. Caucásica GP. Hombre en Diálisis. Mujer en Diálisis. Raza Negra en Diálisis. Raza Caucásica en Diálisis > Población General. Población en Diálisis. NKF Task Force on Cardiovascular Disease. Am J Kidney Dis. 1998;32(suppl 3):S115.Sarnak MJ, Levey AS. Am J Kidney Dis. 2000;35(suppl 1):S117-S131.")
4
Factores Propuestos asociados con el Aumento de Riesgo CV en IRC
Tradicionales Edad Sexo Masculino Hipertensión Diabetes Dislipidemia Fumador No-Tradicionales Hiperparatiroidismo Secundario o desordenes mineral-óseo Urémico Aclaramiento bajo Albuminuria Albúmina sérica baja Anemia Elasticidad vascular reducida Homocisteína Inflamación Estrés Oxidativo Procoagulación Anavekar NS, et al. Kidney Int. 2004;66(suppl 92):S11-S15.
:S11-S15.")
7
Phosphorus Secondary Hyperparathyroidism Vascular Calcification
Progression of Renal Disease

8
70% de los Pacientes tienen un fósforo elevado
5% 10% 15% 20% 25% 1-2.9 3-3.9 4-4.9 5-5.9 6-6.9 7-7.9 8-8.9 9-9.9 10-17 Fósforo sérico (mg/dL) Porcentaje de Pacientes CMAS (1990) mean = 6.2 DMMS (1993) Pacientes con nivel arriba del valor normal Elevated serum phosphorus levels are very common among hemodialysis patients. In fact, 70% of patients have a serum phosphorus level above 1.61 mmol/L. This begs the question, “Are we doing a good enough job managing hyperphosphatemia?” In the 6407 patients (on hemodialysis for at least 1 year) studied by Block et al1: 70% had serum phosphorus levels >1.61 mmol/L 50% had serum phosphorus levels >1.94 mmol/L 39% had serum phosphorus levels >2.10 mmol/L 30% had serum phosphorus levels >2.26 mmol/L 10% had serum phosphorus levels >2.91 mmol/L The mean serum phosphorus level was 2.00 mmol/L.1 1. Block GA, et al. Am J Kidney Dis. 1998;31: Block G. et al Am. J. Kidney Dis. 31(4): (1998)
 Porcentaje de Pacientes. CMAS (1990) mean = 6.2. DMMS (1993) Pacientes con nivel arriba del valor normal. Elevated serum phosphorus levels are very common among hemodialysis patients. In fact, 70% of patients have a serum phosphorus level above 1.61 mmol/L. This begs the question, Are we doing a good enough job managing hyperphosphatemia In the 6407 patients (on hemodialysis for at least 1 year) studied by Block et al1: 70% had serum phosphorus levels >1.61 mmol/L. 50% had serum phosphorus levels >1.94 mmol/L. 39% had serum phosphorus levels >2.10 mmol/L. 30% had serum phosphorus levels >2.26 mmol/L. 10% had serum phosphorus levels >2.91 mmol/L. The mean serum phosphorus level was 2.00 mmol/L Block GA, et al. Am J Kidney Dis. 1998;31: Block G. et al Am. J. Kidney Dis. 31(4): (1998)")
9
Aumento de los Niveles de Fósforo Asociados a un Riesgo Mayor de Mortalidad
* 2.02 * 1.67 * 1.48 * 1.43 * 1.25 * 1.28 * 1.24 * 1.18 * 1.1 Increased serum levels of phosphorus, calcium, and parathyroid hormone (PTH) are each associated with increased mortality risk among individuals with end-stage renal disease (ESRD).1 Each 1 mg/dL increase in serum P is associated with increased mortality risk by a mean of 6%.2 Patients with serum phosphorus levels >7.9 mg/dL have a 34% increase in relative mortality risk.2 1. Block GA, et al. J Am Soc Nephrol Aug;15(8): 2. Block GA et al. Am J Kidney Dis. 1998;31: Correjido al nivel de albumina Riesgo Relativo en análisis de variable multiples: edad, genero, raza, diabetes, tiempo en dialisis, peso, URR, albumina, creatinina, pre-BUN, bicarbonato, Hg, ferritina, aluminium Adaptado de Block GA, et al. J Am Soc Nephrol Aug;15(8):
 are each associated with increased mortality risk among individuals with end-stage renal disease (ESRD).1. Each 1 mg/dL increase in serum P is associated with increased mortality risk by a mean of 6%.2. Patients with serum phosphorus levels >7.9 mg/dL have a 34% increase in relative mortality risk Block GA, et al. J Am Soc Nephrol Aug;15(8): Block GA et al. Am J Kidney Dis. 1998;31: Correjido al nivel de albumina. Riesgo Relativo en análisis de variable multiples: edad, genero, raza, diabetes, tiempo en dialisis, peso, URR, albumina, creatinina, pre-BUN, bicarbonato, Hg, ferritina, aluminium. Adaptado de Block GA, et al. J Am Soc Nephrol Aug;15(8):")
10
Kestenbaum B, et al. JASN 16: 520-528, 2005
Fósforo sérico y riesgo de muerte por todas causas en 6730 pacientes con IRC fases III-V prediálisis Kestenbaum B, et al. JASN 16: , 2005 * * * * * Riesgo relativo mg/dL Muertes 100 pt-años. *p<0.05 adjustado: edad; sexo; raza; diabetes; ECV (CAD, CVA, CHF); fallo renal agudo; ingesta y nivel de calcio; hemoglobina; aclaramiento, valor máximo y valor recíproco de creatinina.
; fallo renal agudo; ingesta y nivel de calcio; hemoglobina; aclaramiento, valor máximo y valor recíproco de creatinina.")
11
Fósforo sérico y el riesgo de calcificación coronaria en pacientes con IRC pre-diálisis
MSCT CACS < 400 (n = 74) CACS > 400 (n = 22) Fósforo es un determinante importante en la calcificación severa de las coronarias aun despues de controlar diferencias en edad, diabetes, y función renal. Tomiyama C, Neph Dial Trans, 21: ; 2006
 CACS > 400. (n = 22) Fósforo es un determinante importante en la calcificación severa de las coronarias aun despues de controlar diferencias en edad, diabetes, y función renal. Tomiyama C, Neph Dial Trans, 21: ;")
12
NKF-K/DOQI™ “Existe un conflicto básico en la patofisiología del calcio la cual se debe resolver en los pacientes con IRC, e.j. el conflicto entre la supresión adecuada y el control de la PTH, y la sobrecarga excesiva de calcio lo cual trae como resultado daños en los tejidos. La resolución de dicho conflicto incluye el uso de ensayos cuidadosamente diseñados para evaluar los asuntos básicos que estan siendo debatidos ampliamente en la actualidad.” Pautas de la K/DOQI para el Metabolismo y Enfermedad Ósea. Am J Kidney Dis 2003;42(4 Suppl 3):1-201.
:")
14
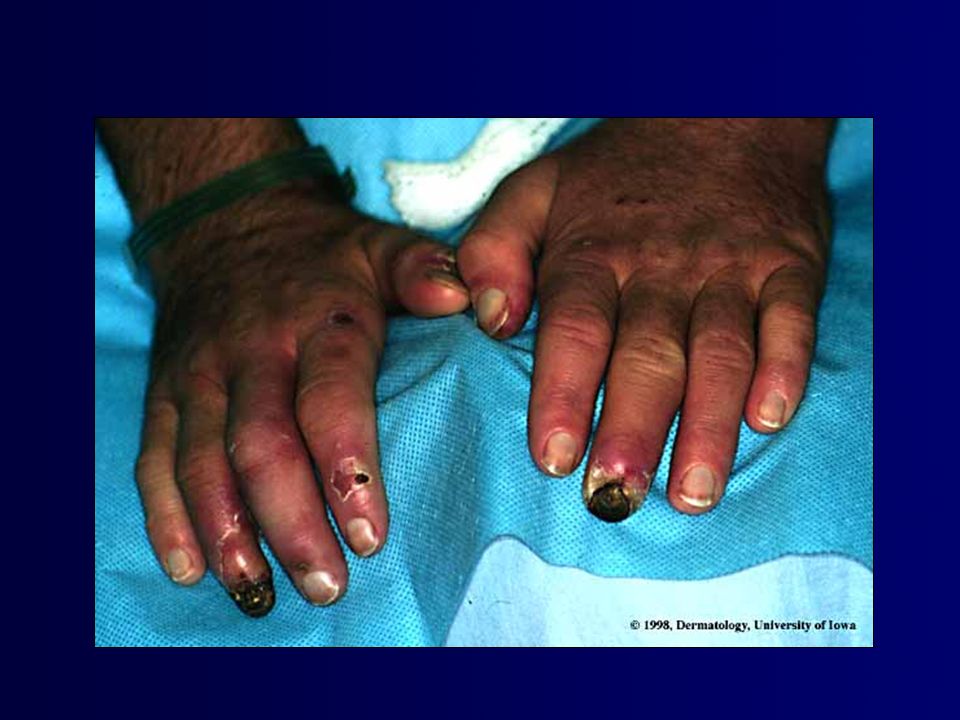
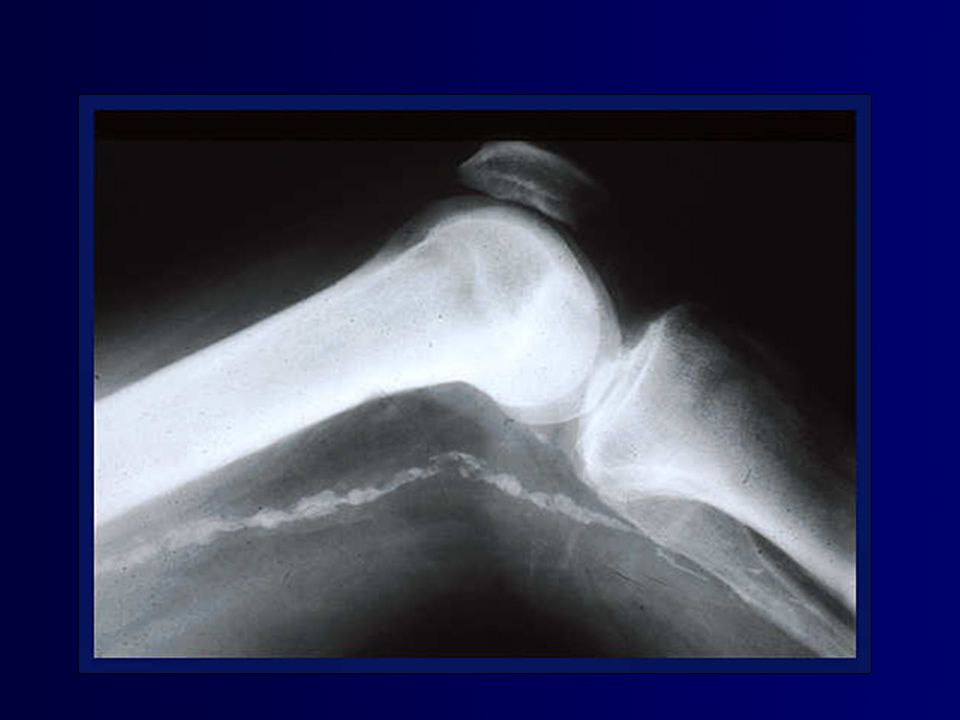
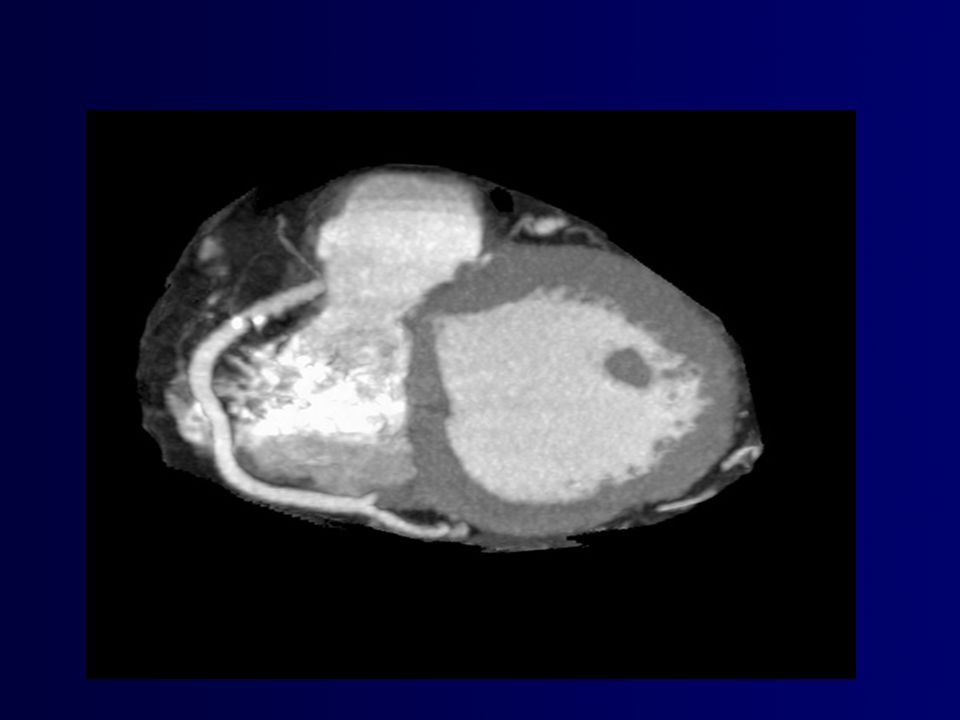
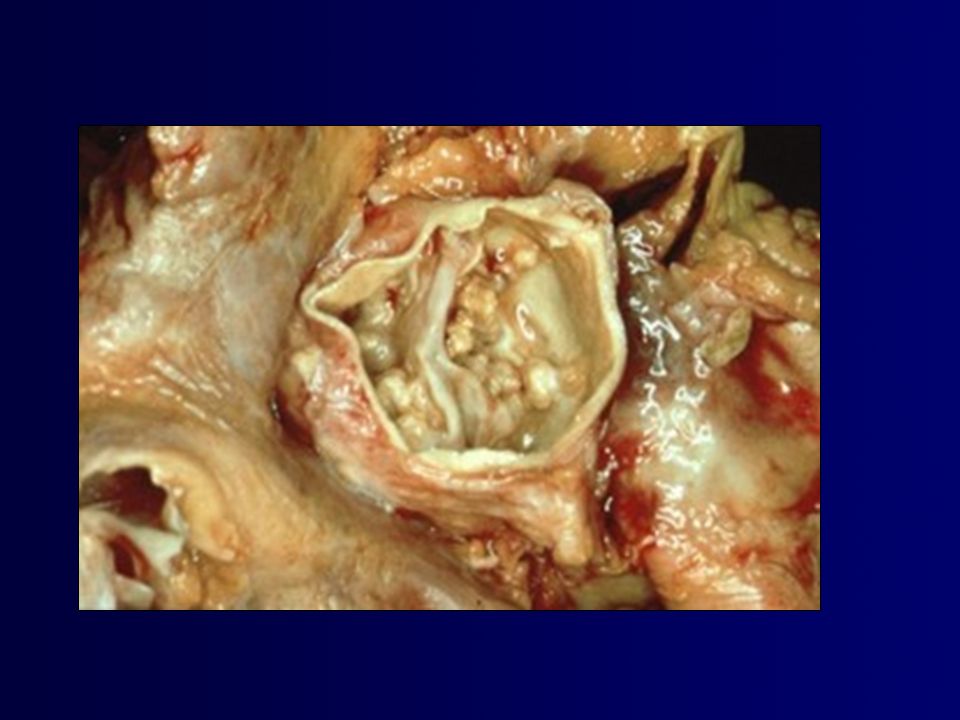
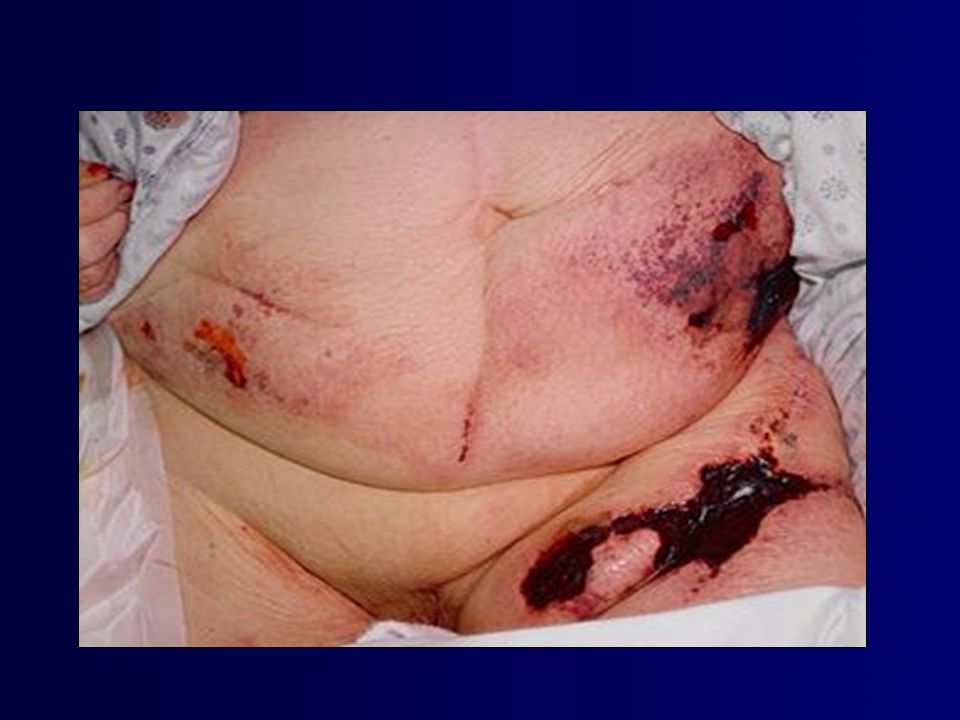
Efectos Patológicos de la Calcificación de Tejidos
Tipo de Calcificación Efectos Patológicos Miocardial y valvular Bloqueo atrioventricular, fallo cardíaco, hipertensión pulmonar, arritmia, hipertrofía ventricular inzquierda y derecha Arterias Periferales Necrosis ósea y del tejido suave, amputación Arteriolas Arteriolopatía urémica calcificante (calcifilaxis) Pulmonar Tos, disnea, defectos restrictivos, difusión disminuída, hipoxia Key Point: Soft-tissue calcification can affect many tissues, including the heart, peripheral blood vessels, and lungs. Deposition of calcium in these tissues can result in a wide range of adverse events. Depending on the location and severity of calcification, patients may experience a range of morbid effects, some of which can be severe and potentially life threatening. Myocardial and valvular calcification have the potential to result in atrioventricular block, cardiac failure, pulmonary hypertension, arrhythmia, and left and right ventricular hypertrophy. Calcification of peripheral arteries may result in bone and soft tissue necrosis and requirement for amputation. Calcification of skin arterioles may result in calcific uremic arteriolopathy. Pulmonary deposition of calcium may lead to cough, dyspnea, restrictive defects, decreased diffusion, and hypoxia.1-5 1. Akmal M, Barndt RR, Ansari AN, Mohler JG, Massry SG. Excess PTH in CRF induces pulmonary calcification, pulmonary hypertension and right ventricular hypertrophy. Kidney Int. 1995;47: 2. Drüeke TB. A clinical approach to the uraemic patient with extraskeletal calcifications. Nephrol Dial Transplant. 1996;11(suppl 3):37-42. 3. Hsu CH. Are we mismanaging calcium and phosphate metabolism in renal failure? Am J Kidney Dis. 1997;29: 4. Janigan DT, Hirsch DJ, Klassen GA, MacDonald AS. Calcified subcutaneous arterioles with infarcts of the subcutis and skin (“calciphylaxis”) in chronic renal failure. Am J Kidney Dis. 2000;35: 5. Rostand SG, Sanders C, Kirk KA, Rutsky EA, Fraser RG. Myocardial calcification and cardiac dysfunction in chronic renal failure. Am J Med. 1988;85: Akmal M, et al. Kidney Int. 1995;47: Drüeke TB. Nephrol Dial Transplant. 1996;11(suppl 3):37-42. Hsu CH. Am J Kidney Dis. 1997;29: Janigan DT, et al. Am J Kidney Dis. 2000;35: Rostand SG, et al. Am J Med. 1988;85:
 Pulmonar Tos, disnea, defectos restrictivos, difusión disminuída, hipoxia. Key Point: Soft-tissue calcification can affect many tissues, including the heart, peripheral blood vessels, and lungs. Deposition of calcium in these tissues can result in a wide range of adverse events. Depending on the location and severity of calcification, patients may experience a range of morbid effects, some of which can be severe and potentially life threatening. Myocardial and valvular calcification have the potential to result in atrioventricular block, cardiac failure, pulmonary hypertension, arrhythmia, and left and right ventricular hypertrophy. Calcification of peripheral arteries may result in bone and soft tissue necrosis and requirement for amputation. Calcification of skin arterioles may result in calcific uremic arteriolopathy. Pulmonary deposition of calcium may lead to cough, dyspnea, restrictive defects, decreased diffusion, and hypoxia Akmal M, Barndt RR, Ansari AN, Mohler JG, Massry SG. Excess PTH in CRF induces pulmonary calcification, pulmonary hypertension and right ventricular hypertrophy. Kidney Int. 1995;47: Drüeke TB. A clinical approach to the uraemic patient with extraskeletal calcifications. Nephrol Dial Transplant. 1996;11(suppl 3): Hsu CH. Are we mismanaging calcium and phosphate metabolism in renal failure Am J Kidney Dis. 1997;29: Janigan DT, Hirsch DJ, Klassen GA, MacDonald AS. Calcified subcutaneous arterioles with infarcts of the subcutis and skin ( calciphylaxis ) in chronic renal failure. Am J Kidney Dis. 2000;35: Rostand SG, Sanders C, Kirk KA, Rutsky EA, Fraser RG. Myocardial calcification and cardiac dysfunction in chronic renal failure. Am J Med. 1988;85: Akmal M, et al. Kidney Int. 1995;47: Drüeke TB. Nephrol Dial Transplant. 1996;11(suppl 3): Hsu CH. Am J Kidney Dis. 1997;29: Janigan DT, et al. Am J Kidney Dis. 2000;35: Rostand SG, et al. Am J Med. 1988;85:")
17
Estudio multiétnico de ateroesclerosis (n=439): Calcificaciones cardiovasculares de acuerdo al fósforo sérico en pacientes con IRC 3-4 < >4 Fósforo sérico, mg/dL Adeney KL, et al. ASN 2007 Ajustando a la edad, sexo, raza, fumar, obesidad, diabetes, presión diastólica, LDL, PCR, albúmina urinaria y cistatina-C

19
Tasa de calcio coronario Medio
Aumento en el Riesgo de Calcificación Cardiovascular en Pacientes en Diálisis 2500 No CAD 2000 CAD Diálisis 1500 Tasa de calcio coronario Medio 1000 Analysis of 49 hemodialysis patients by Braun et al1 using electron beam computed tomography demonstrated that the mean cardiac calcification score was more than 10-fold higher in hemodialysis patients than in nondialysis control patients with documented or suspected cardiovascular disease. The magnitude of the age-related calcification of coronary arteries was 2.5-fold to 5-fold higher in the dialysis patients. The calcium score was calculated from the number of calcifications, the surface area involved, and the highest density values versus average values. A weighted density score is determined based on the peak CT number in specific calcium deposits. To obtain the calcium score, the area of calcification is multiplied by the weighted density scores. To determine the total coronary calcium score, the results from the left main artery, the descending and the circumflex branches of the left coronary artery, and the right coronary artery are then combined.2 1. Braun J, et al. Am J Kidney Dis. 1996;27: 2. Rumberger JA, et al. Mayo Clin Proc. 1999;74: 500 28-39 40-49 50-59 60-69 Edad (Años) (n=49) Adapted from Braun J, et al. Am J Kid Dis. 1996;27:
 (n=49) Adapted from Braun J, et al. Am J Kid Dis. 1996;27:")
20
Tomografia Computarizada por Haz de Electrones [EBCT] y Sobrevida en Hemodiálisis Crónica
CACS Media = 200 P=0.015 n=104 Matsuoka M. Clin Exp Nephrol 2004;8:54-58
![Tomografia Computarizada por Haz de Electrones [EBCT] y Sobrevida en Hemodiálisis Crónica](http://slideplayer.es/slide/123222/2/images/20/Tomografia+Computarizada+por+Haz+de+Electrones+%5BEBCT%5D+y+Sobrevida+en+Hemodi%C3%A1lisis+Cr%C3%B3nica.jpg "CACS Media = 200. P= n=104. Matsuoka M. Clin Exp Nephrol 2004;8:")
22
Calcificación valvular detectada por ecocardiografía (>1 mm of ecos-brillantes) al inicio de diálisis y sobrevida libre de eventos cardiovasculares en pacientes con IRT ASN 2007

24
Calcificación Vascular en IRC
Goodman W, AJKD, Vol 43; pp , March 2004

25
MEDICINA CLÍNICA NUCLEAR
Scintigrafía Ósea Tc-99m. MEDICINA CLÍNICA NUCLEAR Volúmen 28, Número 2, pp 144–145:2003

26
Inductors (+) and Inhibitors (–) of Vascular Calcifications
CBfa1 BMP2 Osteonectin PO4 + + Leptin Dexamethasone Osteocalcin + + + + ALP PTH 7-84 + Collagen I Fibronectin + TNF-α + + Oncostatin LDLox + + + Ca Klotho-/- - - - Pyrophosphate - Fetuin - - - Osteopontin MGP - Osteoprotegerin BMP7 Collagen IV - PTHrP PTH 1-34

27
Asociación de niveles bajos de fetuina-A (AHSG) en súero con la mortalidad total y cardiovascular en patientes en diálisis crónica (IRT): Tercios de la distribución: High o alto=0·72–1·83 g/L Medium o medio=0·55–0·71 g/L Low o bajo =0·20–0·54 g/L. Ketteler M, et al. Lancet 2003, 361:

28
Al agregar fetuina-A purificada (AHSG) en el súero de pacientes en diálisis crónica (n=8), con la meta de alcanzar niveles sanguineous fisiológicos (0·5–1·0 g/L) , se reduce la precipitación de cálcio con fósforo a niveles normales Ketteler M, et al. Lancet 2003, 361:

29
Hyperphosphatemiamia
Bone Morphogenetic Proteins in Vascular Calcification Keith A. Hruska, Suresh Mathew, Georges Saab Circ. Res. 2005;97; Hyperphosphatemiamia ADM Bone BMP-7 BMP-2-2 V calcification

30
Giachelli et al. J Am Soc Nephrol. 2004;15:2961.
Model for the Effects of Elevated Ca and P on VSMC Matrix Mineralization Giachelli et al. J Am Soc Nephrol. 2004;15:2961. 30 Giachelli et al. J Am Soc Nephrol. 2004;15:2961.

31
Calcificaciones Vascular y Fósforo Inorgánico

32
Fósforo/Calcio mM or (mg/dL)
Calcificación en medio de cultivo de células humanas de músculo liso inducida por desordenes minerales 250 150 100 50 200 Normal P/Alto Ca Alto P/Alto Ca Alto P/Normal Ca 2/2.0 2/2.2 2/2.4 (6.19/9.64) (6.19/8.82) (6.19/8.02) 2/1.8 (6.19/7.21) Calcio mg/mg protein (7.43/7.21) 1.6/1.8 2.4/1.8 (4.96/7.21) 1.2/1.8 1.2/2.8 (3.71/11.22) 1.2/2.4 (3.71/9.64) (3.71/7.21) mM (mg/dL) Fósforo/Calcio mM or (mg/dL) P, Fósforo; Ca, calcium Yang H, Giachelli C. Kidney Int 2004;66:
 (6.19/8.82) (6.19/8.02) 2/1.8. (6.19/7.21) Calcio mg/mg protein. (7.43/7.21) 1.6/ /1.8. (4.96/7.21) 1.2/ /2.8. (3.71/11.22) 1.2/2.4. (3.71/9.64) (3.71/7.21) mM. (mg/dL) Fósforo/Calcio mM or (mg/dL) P, Fósforo; Ca, calcium. Yang H, Giachelli C. Kidney Int 2004;66:")
33
Inhibición del cotransportador sodio-fósforo (NPC, Pit-1) con acido fosfonofórmico y calcificación vascular ASN 2007

35
Calcificación Arterial Media (AMC) en ERT: Impacto en mortalidad total y cardiovascular
Pulse pressure (mmHg) ( ) Diabetes (yes, no) ( ) CaCo3 (g elemental Ca/day) ( ) AMC (yes, no)a ( ) London GM et al. Nephrol Dial Transplant 2003
 ( ) Diabetes (yes, no) ( ) CaCo3 (g elemental Ca/day) ( ) AMC (yes, no)a ( ) London GM et al. Nephrol Dial Transplant")
36
Hydrogel of cross linked poly allylamime hydrochloride

38
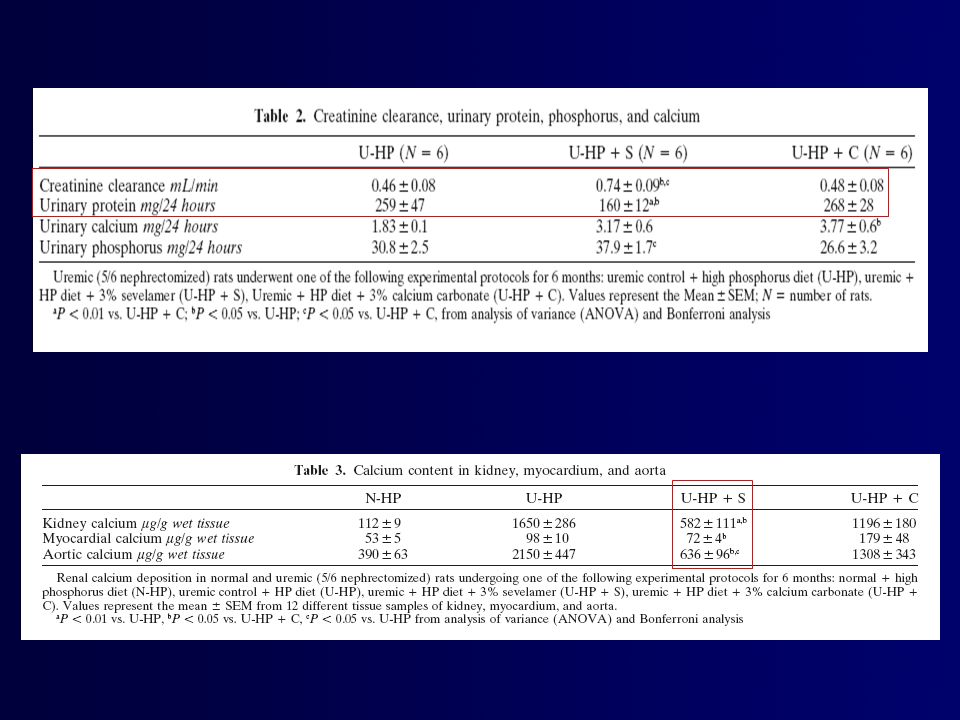
Protocol (Uremia 6 months)
Biochemistry (Creat, Ca, P, CaxP product, pH, HCO3-, GFR, Uprot, UCa, UP) } UHP Uremia Secondary HP (PTH, PTGw; PCNA, TGFa and EGFR content) UHP + C 3% 1 wk UHP + S 3% 6 mo Ca deposition (Kidney,Myocard. Aorta) HP diet = 0.9% P Histology (H/E, PAS, von Kossa, Alizarin Red S)
 } UHP. Uremia. Secondary HP. (PTH, PTGw; PCNA, TGFa and EGFR. content) UHP + C 3% 1 wk. UHP + S 3% 6 mo. Ca deposition. (Kidney,Myocard. Aorta) HP diet = 0.9% P. Histology. (H/E, PAS, von Kossa, Alizarin Red S)")
39
Effects of Sevelamer and CaCO3 on Serum Calcium
Normal Control Sevelamer CaCO3 mg/dl

40
Effects of Sevelamer and CaCO3 on Serum Phosphorus
Normal Control Sevelamer CaCO3 p<0.01 mg/dl p<0.01

41
Effects of Sevelamer and CaCO3 on Serum PTH in Rats after 6 Months of Uremia
pg/ml

42
Effects of Sevelamer and CaCO3 on Creatinine Clearance (Uremia = 6 months)
p<0.05 p<0.05 ml/min

43
Effects of Sevelamer and CaCO3 on Urinary Protein Excretion in Rats after 6 Months of Uremia
mg/24h

44
Effects of CaCO3 and Sevelamer on Kidney Calcification (3 Months After the Onset of Renal Failure)
")
45
Effects of Calcium Carbonate and Sevelamer on Kidney Calcification
HP HP+CaCO3 3% HP+Sevelamer 3% Uremia = 3 months

46
Effects of Sevelamer and CaCO3 on Calcium Deposition in Rat Myocardium
mg/g wet tissue p<0.01 Normal Control Sevelamer CaCO3 Uremia 6 months

47
Effects of Calcium Carbonate and Sevelamer on Intramyocardium Arterial Calcification
U-HP+C U-HP+S U-HP+C U-HP+S Uremia = 6 months

48
X PO4 PO4 PO4 UHP UHP + C 3% UHP + S 3% PTH PTH PTH GFR GFR GFR UProt
UCa UCa UCa

49
Reversal of the Adynamic Bone Disorder and Decreased Vascular Calcification in Chronic Kidney Disease by Sevelamer Carbonate Therapy J Am Soc Nephrol 18: 122–130, 2007. Suresh Mathew,* Richard J. Lund,† Frank Strebeck,* Kimberly S. Tustison,* Theresa Geurs,*and Keith A. Hruska*† *Renal Division, Department of Pediatrics, Washington University School of Medicine, St. Louis, Missouri; and †Renal Division, Department of Medicine, Creighton University, Omaha, Nebraska

50
IRC

51
Osteoid Volume

53
Estudio de Tratamiento-a-Meta* Diseño del Estudio
Si P >5.5 mg/dL Vitamina D si PTH >300 pg/mL Tratamiento Prolongado Washout Sevelamer Randomizado 2 semanas 12 semanas 40 semanas Tratamiento Prolongado Washout Quelante de Calcio In the Treat-to-Goal study, patients were enrolled in the USA and Europe and randomized to treatment with sevelamer hydrochloride or a calcium-based phosphate binder (calcium acetate or calcium carbonate) for 52 weeks. Patients underwent a 2-week washout period during which all treatment with phosphate binders was withheld. Those who developed hyperphosphatemia (serum phosphorus >5.5 mg/dL) during this washout period were eligible for randomization. During the first 12 weeks of treatment, doses of sevelamer or calcium were titrated every 3 weeks in order to achieve serum phosphorus levels of mg/dL and serum calcium levels of mg/dL. During the extended treatment period of 40 weeks, doses of phosphate binders and vitamin D were titrated to maintain serum phosphorus and calcium ranges within targets. Intact parathyroid hormone (PTH) level was maintained within a target range of pg/mL. Subjects underwent electron beam tomography (EBT) imaging procedures at day 0 and at 26 and 52 weeks to assess coronary and aortic calcification. Dósis de Titración: P= mg/dL Ca <10.5 mg/dL Dósis de Titración: P= mg/dL Ca < 10 mg/dL PTH pg/mL BL EBTC 26 semanas EBTC 52 semanas EBTC * “Treat-to-Goal Study” , Chertow GM et al. Kidney Int 2002;62:
 for 52 weeks. Patients underwent a 2-week washout period during which all treatment with phosphate binders was withheld. Those who developed hyperphosphatemia (serum phosphorus >5.5 mg/dL) during this washout period were eligible for randomization. During the first 12 weeks of treatment, doses of sevelamer or calcium were titrated every 3 weeks in order to achieve serum phosphorus levels of mg/dL and serum calcium levels of mg/dL. During the extended treatment period of 40 weeks, doses of phosphate binders and vitamin D were titrated to maintain serum phosphorus and calcium ranges within targets. Intact parathyroid hormone (PTH) level was maintained within a target range of pg/mL. Subjects underwent electron beam tomography (EBT) imaging procedures at day 0 and at 26 and 52 weeks to assess coronary and aortic calcification. Dósis de Titración: P= mg/dL Ca <10.5 mg/dL. Dósis de Titración: P= mg/dL Ca < 10 mg/dL PTH pg/mL. BL EBTC. 26 semanas EBTC. 52 semanas. EBTC. * Treat-to-Goal Study , Chertow GM et al. Kidney Int 2002;62:")
54
Estudio de Tratamiento-a-Meta Demografía en la Línea Basal
Calcio Sevelámero Edad (años) 56 ± 16 57 ± 14 Período en diálisis (años) 2.9 3.6 Género (% masculino) 66% 64% IMC (kg/m2) 26 ± 5 26 ± 5 Baseline demographic and clinical characteristics were similar in both treatment groups. Two-thirds of patients were male and two-thirds were Caucasian. Mean age of patients was 56 16 in the calcium group and 57 14 in the sevelamer group. Median duration of dialysis was 2.9 years in the calcium group and 3.6 years in the sevelamer group. Diabetis 33% 32% Fumador 8% 3% Raza (% blanca) 66% 71% Chertow GM et al. Kidney Int 2002;62:
 56 ± ± 14. Período en diálisis (años) Género (% masculino) 66% 64% IMC (kg/m2) 26 ± ± 5. Baseline demographic and clinical characteristics were similar in both treatment groups. Two-thirds of patients were male and two-thirds were Caucasian. Mean age of patients was 56 16 in the calcium group and 57 14 in the sevelamer group. Median duration of dialysis was 2.9 years in the calcium group and 3.6 years in the sevelamer group. Diabetis. 33% 32% Fumador. 8% 3% Raza (% blanca) 66% 71% Chertow GM et al. Kidney Int 2002;62:")
55
Estudio de Tratamiento-a-Meta Fosfato Sérico
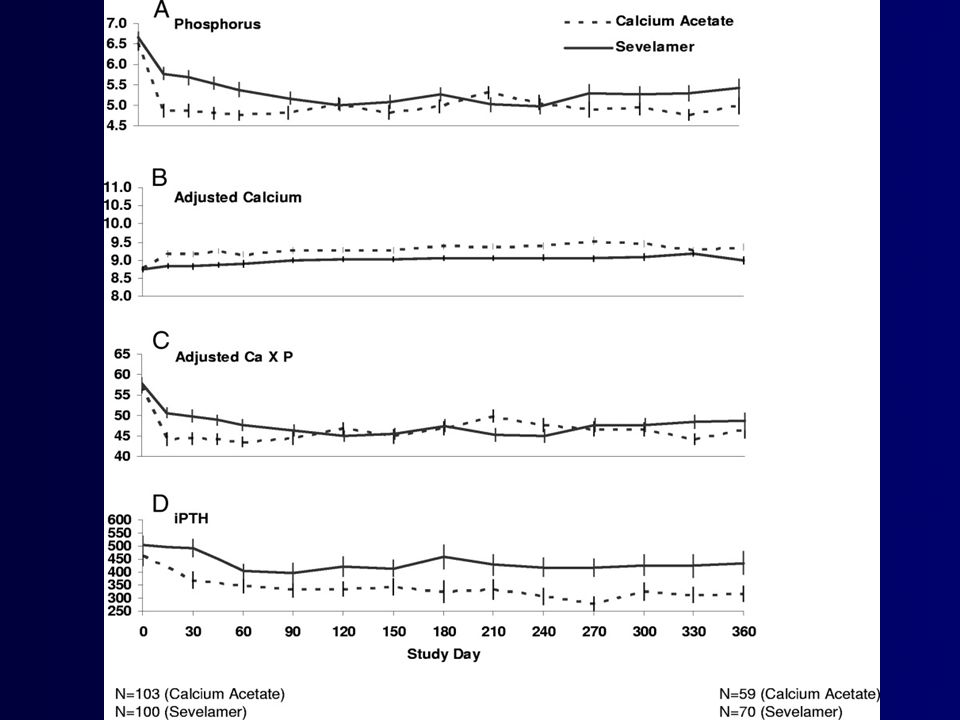
8.0 Sevelamer (S): 6.5 g/día (~tabletas mg ) Acetato de Calcio (C): 4.6 g/día (~tabletas mg ) 7.5 7.0 6.5 Índice de fosfato sérico (mg/dL) S=5.1 6.0 C=5.1 5.5 Sevelamer and calcium provided equivalent control of serum phosphorus, which was reduced to within target range in both treatment groups Mean serum phosphorus was 5.1 mg/dL in both groups after 1 year of treatment. 5.0 4.5 4.0 -3 -1 1 2 3 4 5 6 7 8 9 10 11 12 16 20 24 28 32 36 40 44 48 52 Tratamiento (semanas) Chertow GM et al. Kidney Int 2002;62:
: 6.5 g/día (~tabletas mg ) Acetato de Calcio (C): 4.6 g/día (~tabletas mg ) Índice de fosfato sérico (mg/dL) S= C= Sevelamer and calcium provided equivalent control of serum phosphorus, which was reduced to within target range in both treatment groups. Mean serum phosphorus was 5.1 mg/dL in both groups after 1 year of treatment Tratamiento (semanas) Chertow GM et al. Kidney Int 2002;62:")
56
Estudio de Tratamiento-a-Meta Calcio Sérico
10.5 10.0 9.5 9.0 8.5 S=9.50 C=9.70 S = 9.40 C = 9.30 Índice de calcio sérico (mg/dL) Mean serum calcium was significantly higher in the calcium-treated group compared with the sevelamer-treated group Hypercalcemia was more common in the calcium-treated group. Over the course of the study, 17% of sevelamer subjects and 43% of calcium subjects experienced at least 1 hypercalcemic episode (p=0.0005). Sevelamer Calcio -2 3 6 9 12 16 20 24 28 32 36 40 44 48 52 Estudio (semanas) Chertow GM et al. Kidney Int 2002;62:
 Mean serum calcium was significantly higher in the calcium-treated group compared with the sevelamer-treated group. Hypercalcemia was more common in the calcium-treated group. Over the course of the study, 17% of sevelamer subjects and 43% of calcium subjects experienced at least 1 hypercalcemic episode (p=0.0005). Sevelamer. Calcio Estudio (semanas) Chertow GM et al. Kidney Int 2002;62:")
57
Estudio de Tratamiento-a-Meta Arteria Coronaria y Calcificación Aórtica
Calcio Sevelamer Arteria Coronaria 35 Aorta 30 25* 30 28* 25 24* 25 20 20 % de cambio medio 14* Median % change 15 15 10 6 10 Compared with the sevelamer group, there was significant progression of coronary artery and aortic calcification in the calcium group at both week 26 and week 52. 5 5 5 1 Semana 26 Semana 52 Semana 26 Semana 52 *Dentro del tratamiento P<0.0001; entre grupos en tratamiento P=0.02 Chertow GM et al. Kidney Int 2002;62:

58
Estudio de Tratamiento-a-Meta: 2 Años de Datos Europeos Arteria Coronaria y Calcificación Aórtica
Aorta Sevelámero Calcio 90 83% 80 P<0.0001 70 66% 60 P<0.0001 50 (%) de cambio medio 40 30 20% Significant differences in arterial calcification were maintained after 2 years of treatment. In an analysis of European Treat-to-Goal study patients, there were significant increases of coronary artery and aortic calcification in the calcium group compared with the sevelamer group. In the sevelamer-treated group, the mean percentage changes for arterial and aorta calcification were 20% and -7% respectively, In the calcium-treated group, the mean percentage changes in arterial and aorta calcification were 83% and 66% respectively. 20 10 P=NS P=NS -5 -7% -10 Entre los grupos: P=0.03 (coronaria), P=0.01 (aorta) Asmus HG et al. NDT 2005; 20:
 de cambio medio % Significant differences in arterial calcification were maintained after 2 years of treatment. In an analysis of European Treat-to-Goal study patients, there were significant increases of coronary artery and aortic calcification in the calcium group compared with the sevelamer group. In the sevelamer-treated group, the mean percentage changes for arterial and aorta calcification were 20% and -7% respectively, In the calcium-treated group, the mean percentage changes in arterial and aorta calcification were 83% and 66% respectively P=NS. P=NS % -10. Entre los grupos: P=0.03 (coronaria), P=0.01 (aorta) Asmus HG et al. NDT 2005; 20:")
59
Estudio de Tratamiento-a-Meta Concentración de la Hormona Paratiroidea Intacta
PTH por debajo del objetivo S=30% C=57% P=0.001 400 350 300 250 Concentración media de iPTH (pg/dL) 200 150 Suppression of intact parathyroid hormone (iPTH) below target range was more common in the calcium group compared with sevelamer group at the end of the study (57% vs 30%; p=0.001), despite the protocol-specified reduction or cessation of vitamin D therapy if iPTH was below 150 pg/mL 100 Sevelamer 50 Calcio -2 12 16 20 24 28 32 36 40 44 48 52 Estudio (semanas) Chertow GM et al. Kidney Int 2002;62:
 Suppression of intact parathyroid hormone (iPTH) below target range was more common in the calcium group compared with sevelamer group at the end of the study (57% vs 30%; p=0.001), despite the protocol-specified reduction or cessation of vitamin D therapy if iPTH was below 150 pg/mL Sevelamer. 50. Calcio Estudio (semanas) Chertow GM et al. Kidney Int 2002;62:")
60
Tiempo 0 Seguimiento / Años 1 & 2

61
Cambios en la densidad ósea
6 * 4 5% 2 2% Trabicular % de cabio (unidades Hounsfield ) Sevelamer Calcium salts -2 Cortical -2% -4 -7% -6 * -8 *P<0.05 Raggi P. J Bone Min Res 2005;20:
 Sevelamer. Calcium salts. -2. Cortical. -2% % -6. * -8. *P<0.05. Raggi P. J Bone Min Res 2005;20:")
62
Estudio de Tratamiento-a-Meta Calcificación Coronaria y Densidad Ósea
Sevelamer Calcio 100 20 80 15 60 10 40 Unidades Hounsfield (atenuación) Escala Agatson 5 20 Raggi et al also showed an inverse correlation between bone density and the extent of vascular calcification. The significant reduction in trabecular bone attenuation in calcium-treated patients was accompanied by a concomitant increase in coronary calcium score. In sevelamer-treated patients, changes from baseline in trabecular bone attenuation and coronary calcium score were small, indicating preservation of bone and non-progression of vascular calcification. 5 20 10 40 Cambio en la densidad Ósea trabicular Cambio en el resultado del calcio coronario Raggi P et al. J Bone Min Res 2005; 20:
 Escala Agatson Raggi et al also showed an inverse correlation between bone density and the extent of vascular calcification. The significant reduction in trabecular bone attenuation in calcium-treated patients was accompanied by a concomitant increase in coronary calcium score. In sevelamer-treated patients, changes from baseline in trabecular bone attenuation and coronary calcium score were small, indicating preservation of bone and non-progression of vascular calcification Cambio en la densidad. Ósea trabicular. Cambio en el resultado. del calcio coronario. Raggi P et al. J Bone Min Res 2005; 20:")
63
Estudio de Tratamiento-a-Meta Concentración del Colesterol LDL
140 120 100 80 60 Semana en el estudio -2 12 24 52 Sevelamer Calcio S=121 C=119 S=82 C=121 Colesterol LDL (mg/dL) Treatment with sevelamer is associated with a significant reduction in serum LDL-cholesterol In the Treat-to-Goal study, LDL cholesterol declined significantly in the sevelamer group but not in the calcium group. Chertow GM et al. Kidney Int 2002;62:
 Treatment with sevelamer is associated with a significant reduction in serum LDL-cholesterol. In the Treat-to-Goal study, LDL cholesterol declined significantly in the sevelamer group but not in the calcium group. Chertow GM et al. Kidney Int 2002;62:")
64
Estudio de Tratamiento-a-Meta Lípidos Séricos
Colesterol HDL Apolipoproteína B 5 10 P=0.036 5 P=0.0001 3 Cambio medio de mg/dL 2.1* mg/dL mean change -5 1 -10 -2.8 -15 Treatment with sevelamer is also associated with other improvements in serum lipids and inflammatory markers. Patients undergoing hemodialysis randomized to treatment with sevelamer attained a significant reduction in apolipoprotein B (p<0.0001), β2-microglobulin (p=0.018) and hs-C-reactive protein (p=0.012) Sevelamer was also associated with a significant increase in HDL cholesterol (p=0.036). There was no correlation between hs-CRP lowering and total and LDL cholesterol reduction. This may simply be caused by insufficient statistical power relationship; however, it is possible that sevelamer may have anti-inflammatory properties mediated via other non–lipid mechanisms. -1 -20 -3 -25 Sevelamer Calcio Ferramosca E et al. 2005;149:
, β2-microglobulin (p=0.018) and hs-C-reactive protein (p=0.012) Sevelamer was also associated with a significant increase in HDL cholesterol (p=0.036). There was no correlation between hs-CRP lowering and total and LDL cholesterol reduction. This may simply be caused by insufficient statistical power relationship; however, it is possible that sevelamer may have anti-inflammatory properties mediated via other non–lipid mechanisms Sevelamer. Calcio. Ferramosca E et al. 2005;149:")
65
Estudio de Tratamiento-a-Meta β2-microglobulina, Proteína C-reactiva y Acido Úrico
Hs-CRP 0.2 P=0.018 0.1 5 P=0.012 4.97 Cambio medio de mg/dL 2 -0.09* mg/L mean change -4.8* -0.1 -1 -0.2 -4 -0.3 -7 Ácido Úrico Sevelamer Acetato de Calcio Treatment with sevelamer is also associated with other improvements in serum lipids and inflammatory markers. Patients undergoing hemodialysis randomized to treatment with sevelamer attained a significant reduction in apolipoprotein B (p<0.0001), β2-microglobulin (p=0.018) and hs-C-reactive protein (p=0.012) Sevelamer was also associated with a significant increase in HDL cholesterol (p=0.036). There was no correlation between hs-CRP lowering and total and LDL cholesterol reduction. This may simply be caused by insufficient statistical power relationship; however, it is possible that sevelamer may have anti-inflammatory properties mediated via other non–lipid mechanisms. 0.2 P=0.001 Cambio medio de mg/dL -0.09* 0.4 -0.6 -0.8 Ferramosca E et al. 2005;149: , Garg JP, Arth & Rheum Vol 52, pp ; 2005
, β2-microglobulin (p=0.018) and hs-C-reactive protein (p=0.012) Sevelamer was also associated with a significant increase in HDL cholesterol (p=0.036). There was no correlation between hs-CRP lowering and total and LDL cholesterol reduction. This may simply be caused by insufficient statistical power relationship; however, it is possible that sevelamer may have anti-inflammatory properties mediated via other non–lipid mechanisms P= Cambio medio de mg/dL * Ferramosca E et al. 2005;149: , Garg JP, Arth & Rheum Vol 52, pp ;")
67
Block, G.A. et al. Kidney International, Vol68(4): 1815-1824 (2005)
Efectos del Sevelamer y del calcio en la calcificación arterial coronaria en pacientes nuevos a la hemodiálisis Block, G.A. et al. Kidney International, Vol68(4): (2005) “Estudio RIND”
: (2005) Estudio RIND")
68
Tratamiento Prolongado Tratamiento Prolongado
Efectos del sevelamer y del calcio en la calcificación arterial coronaria en pacientes nuevos a la hemodiálisis Mantener el Ca dializado=2.5 mEq/L Práctica Clínica USUAL Sevelamer Tratamiento Prolongado RANDOMIZAR Dentro de los 90 días de la hemodiálisis Quelante de Calcio Tratamiento Prolongado 0 escáner EBCT 6 meses 12 meses 18meses escáner EBTC n=109 Dósis Tiltrate P<6.5 mg/dL Ca2+ <10.2 mg/dL PTH pg/mL Dósis Tlitrante P<6.5 mg/dL Ca2+ <10.2 mg/dL Los pacientes de Renagel pueden recibir la suplementación con calcio en la noche La concentración de Ca dializado se mantuvo a 2.5 mEq/L (1.25 mmol/L) durante todo el estudio Block GA. Kidney Int 2005;68:
 durante todo el estudio. Block GA. Kidney Int 2005;68:")
69
Características en la Linea Basal
No se observaron diferencias significativas entre el grupo de Sevelámero y el de quelantes cálcicos. Prevalencia más alta de la diabetis que en la población dializada general. Los resultados de CAC fueron distribuídos de forma similar en ambos grupos tratantes: CAC = 0 : Ca 33%, RG 40% CAC : Ca 36%, RG 30% CAC >400 : Ca 31%, RG 30% GA Block, P Raggi, A Bellasi, L Kooienga, DM Spiegel Kid Int, Advanced Online Access, 3 January 2007

70
Nivel del Calcio Sérico Promedio por Quelante
Calcio Sérico Promedio por Mes del Estudio 9.6 mg/dL 9.1 mg/dL Block, GA, Kidney Int; Vol68(4): , 2005
: ,")
71
Control Promedio del Fosfato con Quelantes
Fosfato Sérico Promedio por Mes del Estudio Calcio Elemental = 2.3 g/day Sevelamer = 8 g/day (10 pills) 5.2 mg/dL 5.1mg/dL n = 109 Block, GA, Kidney Int; Vol68(4): , 2005
 5.2 mg/dL. 5.1mg/dL. n = 109. Block, GA, Kidney Int; Vol68(4): ,")
72
Efectos del sevelamer y del calcio en la calcificación arterial coronaria en pacientes nuevos a la hemodiálisis Sevelamer Calcio Fosfato 5.2 (0.9) 5.1 (0.8) Calcio Corregido 9.1 (0.5) 9.6 (0.5) P<0.05 Ca x P 47 (7) 49 (8) PTH 298 (152) 243 (136) LDL 60 (34) 81 (26) Albúmina 3.8 (0.3) 3.8 (0.4) CRP 9.1 (9.7) 10.5 (10.3) Hipercalcemia (Ca >10.2 mg/dL) 22% 54% P<0.0001 Hipercalcemia Severa (Ca >11 mg/dL) 5% 24% P<0.02 Promedio (SD) Block GA. Kidney Int 2005;68:
 5.1 (0.8) Calcio Corregido. 9.1 (0.5) 9.6 (0.5) P<0.05. Ca x P. 47 (7) 49 (8) PTH. 298 (152) 243 (136) LDL. 60 (34) 81 (26) Albúmina. 3.8 (0.3) 3.8 (0.4) CRP. 9.1 (9.7) 10.5 (10.3) Hipercalcemia. (Ca >10.2 mg/dL) 22% 54% P< Hipercalcemia Severa. (Ca >11 mg/dL) 5% 24% P<0.02. Promedio (SD) Block GA. Kidney Int 2005;68:")
73
Efectos del sevelamer y del calcio en la calcificación arterial coronaria en pacientes nuevos a la hemodiálisis P=0.01 El aumento absoluto de CACS promedio a los 18 meses fue 11 veces mayor en los pacientes tratados con calcio, comparado con el grupo tratado con sevelamer Block GA. Kidney Int 2005;68:

74
Efectos del sevelamer y del calcio en la calcificación arterial coronaria de los pacientes nuevos a la hemodiálisis n=45 n=47 n=53 n=45 n=55 n=40 n=54 n=51 Block GA. Kidney Int 2005;68:

75
Efecto mortal de la calcificación coronaria y la selección del quelante de fosfato en pacientes incidentes en hemodiálisis GA Block, P Raggi, A Bellasi, L Kooienga y DM Spiegel Kidney International, 2007

76
Materiales y Métodos 129 patientes nuevos a la hemodiálisis
El estudio piloto fue un ensayo randomizado abierto de 18 meses, para evaluar el efecto de los quelantes de fosfato en la progresión de CAC detectada por EBTC Durante los periodos del estudio los pacientes se mantuvieron en los quelantes de fosfato asignados Después del escáner final, los pacientes recibieron quelantes de fosfato de acuerdo a las recomendaciones de sus nefrólogos 2 pacientes fueron excluídos de este análisis La población final del estudio constaba de 127 pacientes El periodo de seguimiento promedio fue de 44 meses Se desarrollaron las curvas de sobrevivencia Kaplan-Meijer y se utilizó una prueba log-rango para detectar las diferencias en los grupos tratantes y el tiempo transcurrido a la muerte. Todos los resultados menos la muerte fueron censorados

77
Sobrevivencia por resultado de CAC en la línea basal
1.00 0.75 P=0.002 Función de la Distribución de Sobrevivencia 0.50 0.25 CCS = 0 CCS CCS > 400 0.00 6 12 18 24 30 36 42 48 54 60 66 Meses No. en Riesgo CCS = CCS < CCS > Figura 1 Sobrevivencia ajustada por los reultados de CAC en la línea basal. Asociación multivarial ajustada (edad, raza, género, diabetis) entre los resultados de CAC en la línea basal y la sobrevivencia. Valor - P representa la significación en los tres grupos. GA Block, P Raggi, A Bellasi, L Kooienga, DM Spiegel Kid Int, Advanced Online Access, 3 January 2007
 entre los resultados de CAC en la línea basal y la sobrevivencia. Valor - P representa la significación en los tres grupos. GA Block, P Raggi, A Bellasi, L Kooienga, DM Spiegel Kid Int, Advanced Online Access, 3 January")
78
Sobrevivencia por asignación del quelante de fosfato
1.00 P=0.016 0.75 11 muertes Función de la Distribución de Sobrevivencia 0.50 23 muertes 0.25 Sevelamer Calcio 0.00 6 12 18 24 30 36 42 48 54 60 66 Meses No. en Risgo Calcio Sevelámero Figura 2: Asignación Ajustada de la sobrevivencia por quelante de fosfato. Asociación de multivariable ajustada (edad, raza, género, diabetis, historial de la enfermedad cardiovascular ateroesclerótica, proteína C-reactiva, albúmina, resultados de K/V y CAC en la línea basal) entre los quelantes de fosfato Asignación de tratamiento (calcio vs sevelamer) y la sobrevivencia. GA Block, P Raggi, A Bellasi, L Kooienga, DM Spiegel Kid Int, Advanced Online Access, 3 January 2007
 entre los quelantes de fosfato. Asignación de tratamiento (calcio vs sevelamer) y la sobrevivencia. GA Block, P Raggi, A Bellasi, L Kooienga, DM Spiegel Kid Int, Advanced Online Access, 3 January")
79
El Ensayo de los Resultados Clínicos de la Diálisis Revisados (DCOR)
Resúmen de los Resultados de la presentación de la ASN 2005

80
El Estudio DCOR El estudio clínico randomizado prospectivo más grande en la población de hemodiálisis Primer estudio a gran escala head-to-head comparando los resultados clínicos en pacientes randomizados a otras alternativas de quelantes de fosfato Diseño del estudio en un “mundo real” Se aplica ampliamente a través de diferentes prácticas clínicas

81
Diseño del Estudio Diseño del estudio multi-céntrico, abierto , paralelo Pacientes randomizados para recibir sevelamer o un quelante de fosfato calcificado de forma 1:1 Randomización estratificada de acuerdo a la edad, raza, género, y estado de la diabetis 1,000 pacientes por brazo Duración total del tratamiento de por lo menos 3 años Pacientes inscritos desde marzo de 2001 hasta enero de 2002 con el periodo de tratamiento hasta diciembre de 2004 Sample Size Calculation: Assuming a mortality rate of 200 per 1000 patient years in the control group, a two sided test, and a preserved overall significant level of 0.05 A total of 1000 patients per treatment arm would provide 80% power to detect a 22% decrease in all-cause mortality Interim analysis planned and conducted after one year of treatment Study duration increased one year based on aggregate death rate Study Medications Physicians prescribed either Renagel or a calcium-based phosphate binder per randomization (3/4 PhosLo) Blinding not possible: Calcium acetate used as comparator (smell) Calcium predictably increases serum calcium Sevelamer predictably decreases cholesterol
 Blinding not possible: Calcium acetate used as comparator (smell) Calcium predictably increases serum calcium. Sevelamer predictably decreases cholesterol.")
82
Objetivos del Estudio Objetivo Principal Objetivo Secundario
Comparar la relación del uso de Renagel vs el uso de quelantes de fosfato cálcicos con la mortalidad de toda causa en pacientes con hemodiálisis Objetivo Secundario Comparar la relación del uso de Renagel y el uso de quelantes de fosfato cálcicos con: Mortalidad de causa específica Hospitalización por toda causa o por causa específica Cardiovascular, fractura, acceso vascular y enfermedad por infección Gastos de Medicare The DCOR study had two separate data sources: Case Report Form Data: The press release and submitted publication based on these data All-cause and cause-specific mortality All-cause hospitalizations Centers for Medicare and Medicaid Services (CMS) Data: Three year data available 2H 2006 All-cause and cause-specific hospitalizations/morbidity Statistical Methods Survival probabilities (Kaplan-Meier curves) were calculated for time to death by treatment group overall Cox regression models were run to determine relative risks and 95% confidence intervals adjusting for the following pre-specified prognostic factors (age, race, gender, diabetes, cause of ESRD, and dialysis vintage) Treatment interactions with each of the prognostic factors were assessed A statistically significant interaction was required as a gating step prior to subset analysis
 Data: Three year data available 2H All-cause and cause-specific hospitalizations/morbidity. Statistical Methods. Survival probabilities (Kaplan-Meier curves) were calculated for time to death by treatment group overall. Cox regression models were run to determine relative risks and 95% confidence intervals adjusting for the following pre-specified prognostic factors (age, race, gender, diabetes, cause of ESRD, and dialysis vintage) Treatment interactions with each of the prognostic factors were assessed. A statistically significant interaction was required as a gating step prior to subset analysis.")
83
Mortalidad por Toda Causa
0.6 0.5 RR 0.91 ( ), p = 0.30 0.4 Incidence Acumulativa de Mortalidad por Toda Causa 0.3 0.2 Results of the DCOR trial were inconclusive for the primary end-point of all-cause mortality across the entire patient cohort (RR 0.91; p = 0.3) Overall survival curve indicated need for treatment time analysis Cox proportional hazards models assumes that the treatment effect is constant over time. Survival curve indicates otherwise—change in curve beginning at 2 years 0.1 Calcio Sevelamer 0.0 1 2 3 4 Tiempo del Estudio (Años)
, p = Incidence Acumulativa de Mortalidad por. Toda Causa Results of the DCOR trial were inconclusive for the primary end-point of all-cause mortality across the entire patient cohort (RR 0.91; p = 0.3) Overall survival curve indicated need for treatment time analysis. Cox proportional hazards models assumes that the treatment effect is constant over time. Survival curve indicates otherwise—change in curve beginning at 2 years Calcio. Sevelamer Tiempo del Estudio (Años)")
84
Interacciones del Tratamiento
Variable Género [masculino/femenino] Raza [negra/blanca] Edad [< 65 o ≥ 65 años] Diabetis [sí/no] Tipo de Diálisis ≤ or > 2 años Causa de ESRD diabetis, hipertensión, otras Modelo de Regresión Cox Valor-p 0.67 0.84 0.03 0.35 0.83 0.82 Pre-specified analysis of treatment interactions for age, race, gender, diabetes, cause of ESRD, and dialysis vintage Of the pre-specified variables, only age demonstrated a statistically significant treatment interaction

85
Mortalidad por Toda Causa (Pacientes ≥ 65 años)*
0.0 0.1 0.2 0.3 0.4 0.5 0.6 0.7 0.8 RR 0.78 ( ), p = 0.03 Incidencia Acumulativa de la Mortalidad Por toda Causa A subset analysis of patients < or ≥ 65 years was undertaken in accordance with pre-specified statistical plan In this subset of patients, sevelamer therapy resulted in a statistically significant 22% reduction in the relative risk for all cause mortality Calcio Sevelamer 1 2 3 4 Tiempo del Estudio (Años) * Análisis de los pacientes previamente especificado
, p = Incidencia Acumulativa de la Mortalidad. Por toda Causa. A subset analysis of patients < or ≥ 65 years was undertaken in accordance with pre-specified statistical plan. In this subset of patients, sevelamer therapy resulted in a statistically significant 22% reduction in the relative risk for all cause mortality. Calcio. Sevelamer Tiempo del Estudio (Años) * Análisis de los pacientes previamente especificado.")
89
Caglar K, Yilmaz M, Saglam M, et al. CJASN.. 2008;3:61-68
Short-term Treatment with Sevelamer Increases Fetuin-A Concentration and Improves Endothelial Dysfunction in Chronic Kidney Disease Stage 4 Patients Caglar K, Yilmaz M, Saglam M, et al. CJASN ;3:61-68

90
Resúmen del Ensayo DCOR
General: Los resultados del ensayo fueron inconclusos para el punto final primario en la mortalidad por toda causa en el grupo completo de pacientes (p = 0.3) Subconjunto Previamente Especificado: Se observó una reducción estadísticamente significativa del 22% en la mortalidad por toda causa en pacientes ≥ 65 años de edad (p = 0.03) que recibían sevelámero Hospitalización: Se observó una tendencia hacia la reducción de hospitalización por toda causa en pacientes tratados con sevelámero en el grupo completo de pacientes (p = 0.06) La reducción en la hospitalización alcanzó una estadística significativa en pacientes ≥ 65 años de edad que recibían sevelámero (p = 0.03)
 Subconjunto Previamente Especificado: Se observó una reducción estadísticamente significativa del 22% en la mortalidad por toda causa en pacientes ≥ 65 años de edad (p = 0.03) que recibían sevelámero. Hospitalización: Se observó una tendencia hacia la reducción de hospitalización por toda causa en pacientes tratados con sevelámero en el grupo completo de pacientes (p = 0.06) La reducción en la hospitalización alcanzó una estadística significativa en pacientes ≥ 65 años de edad que recibían sevelámero (p = 0.03)")
91
Qué puedo hacer en mi consulta para detectar la calcificación?
Presión Arterial Goodman W, London G, Raggi P et al AJKD 2004

92
Apéndice

93
Cómo se Relacionan estos Métodos?

94
Resultados de Rayos X de la Aorta Abdominal
Características ROC para un resultado + de Rayos X abdominal que prediga una CACS > 30 Sensibilidad= 0.74 Especificidad= 0.77 Bellasi A. et al, KI 2006

96
KDIGO (draft 2008) Given the potential complexity of the pathogenesis and the inability of radiologic techniques to differentiate location of calcification, the approach to all patients with calcification should be to minimize atherosclerotic risk factors and control parameters of CKD-MBD. …..Unfortunately, trials in dialysis patients evaluating such strategies to treat either atherosclerosis or CKD-MBD have not conclusively shown such an intervention positively affects patient-level outcomes Despite this, given the high cardiovascular burden in CKD, such an approach seems appropriate until such definitive studies are done……..

97
Estudio de Caso Grupo 1 Grupo 2 8/800mg Sevelamer 56 años 57 años
Edad: Tiempo en Diálisis: PO4: Ca: CxP: PTH: LDL: CRP: 56 años años 2.9 años años. 5.1 mg/dL mg/dL 9.7 mg/dL mg/dL 49 mg2/dL mg2/dL2 138 pg/mL pg/mL 103 mg/dL mg/dL 17.1 mg/L mg/L Dósis Diaria de Quelante 7/Acetate de Ca 8/800mg Sevelamer Calcio Sevelámero Cambio del Porcentage Medio 5 10 15 20 25 30 28%* 5%

98
Reporte de Caso Mujer de 29 Años con insuficiencia renal crónica sometida a hemodiálisis B. Escáner TC realizado a través del tórax inferior al mismo tiempo que A revela una calcificación miocardial extensa que afecta la pared ventricular izquierda y el septum. Note la cardiomegalia y efusión pleural bilateral. C. Esáner TC 4 meses después de una paratiroidectomía y 4 años, 5 meses después de A y B muestran la ausencia de una efusión miocardial A. Radiografía Posteroanterior realizada en Marzo de 1997 muestra un agrandamiento de la silueta cardíaca. Note la congestión vascular pulmonar y la consolidación aire-espacio en los pulmones medio e inferior bilateralmente Jing J, Am J Radiol. 1998;

99
Resultados de Laboratorio e Historial

100
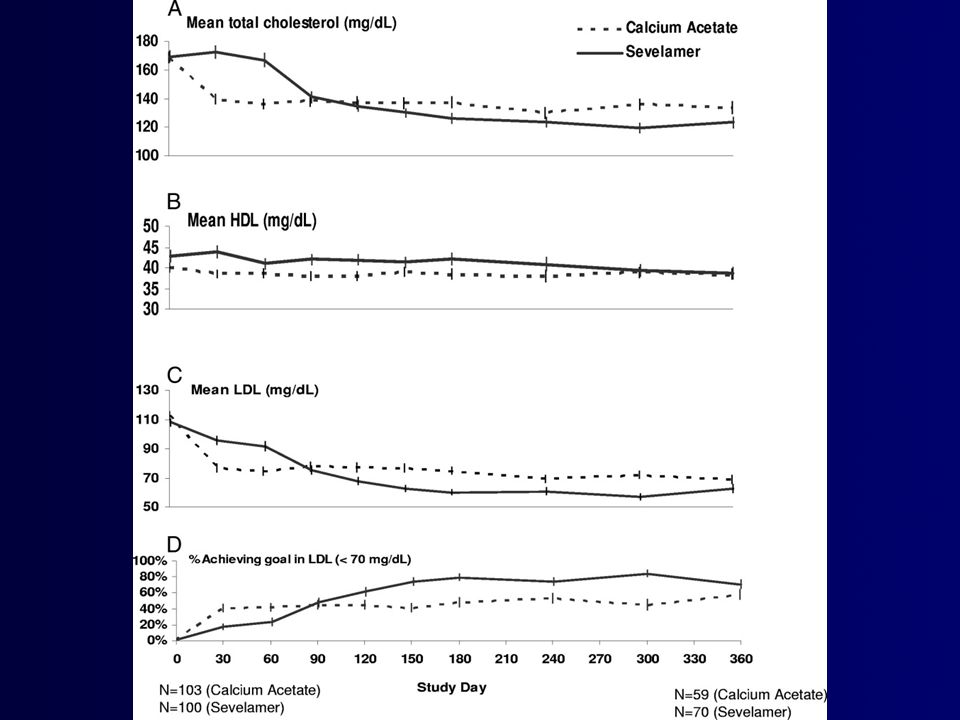
Original Investigation
A 1-Year Randomized Trial of Calcium Acetate Versus Sevelamer on Progression of Coronary Artery Calcification in Hemodialysis Patients With Comparable Lipid Control: The Calcium Acetate Renagel Evaluation-2 (CARE-2) Study Wajeh Qunibi MD1, , , Moustafa Moustafa MD2, Larry R. Muenz PhD3, David Y. He MS3, Paul D. Kessler MD4, Jose A. Diaz-Buxo MD5, Mathew Budoff MD6 and CARE-2 Investigators
 Study. Wajeh Qunibi MD1, , , Moustafa Moustafa MD2, Larry R. Muenz PhD3, David Y. He MS3, Paul D. Kessler MD4, Jose A. Diaz-Buxo MD5, Mathew Budoff MD6 and CARE-2 Investigators.")
Presentaciones similares


 Noviembre de 2004.>")


