Descargar la presentación
La descarga está en progreso. Por favor, espere

3
Overall, 669 patients (16.7%) developed ischemia with exercise. During a mean follow-up of 4.5 3.4 years, 313 patients died, and 183 patients had a MACE before any revascularization procedure. The 5- year mortality and MACE rates were 6.4% and 4.2% in patients without ischemia versus 12.1% and 10.1% in those with ischemia, respectively (p 0.001). In the multivariate analysis, WMSI remained an independent predictor of mortality (hazard ratio [HR]: 2.73, 95% confidence interval [CI]: 1.40 to 5.32, p 0.003) and MACE (HR: 3.59, 95% CI: 1.42 to 9.07, p 0.007). The addition of the EE results to the clinical, resting echocardiographic and exercise hemodynamic data significantly i ncreased the global chi-square of the models for the prediction of mortality (p 0.005) and MACE (p 0.009).
. In the multivariate analysis, WMSI remained an independent predictor of mortality (hazard ratio [HR]: 2.73, 95% confidence interval [CI]: 1.40 to 5.32, p 0.003) and MACE (HR: 3.59, 95% CI: 1.42 to 9.07, p 0.007). The addition of the EE results to the clinical, resting echocardiographic and exercise hemodynamic data significantly i ncreased the global chi-square of the models for the prediction of mortality (p 0.005) and MACE (p 0.009)..")
5
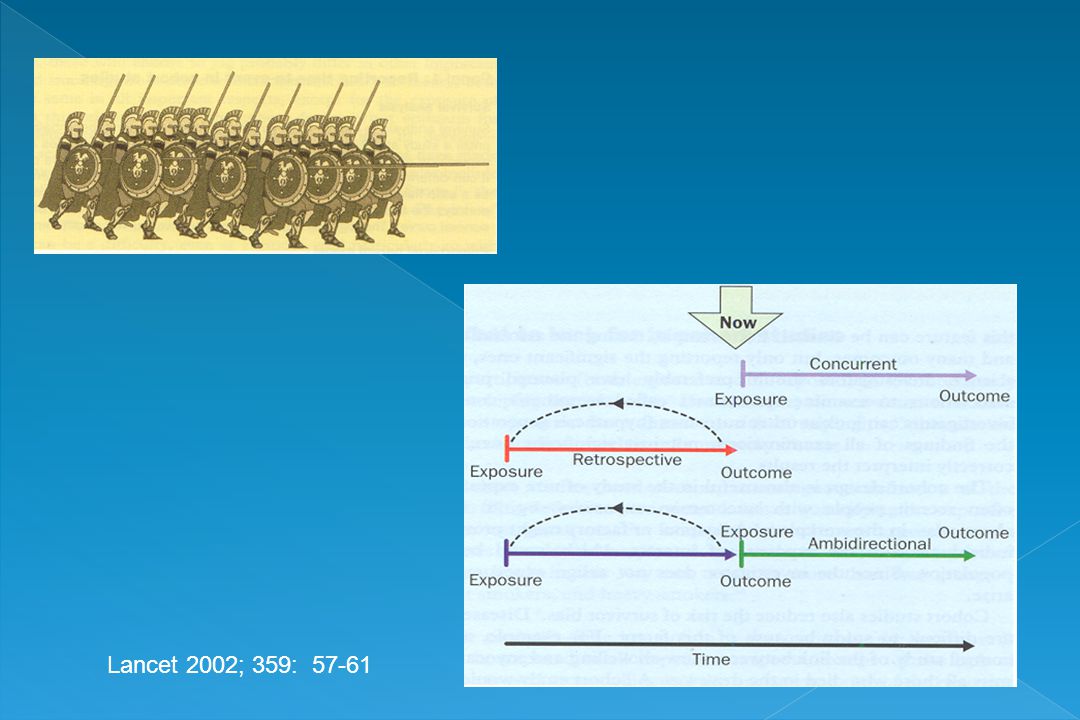
Lancet 2002; 359: 57-61

7
Exposure Outcome Lancet 2002; 359: 57-61 + + + - - - Exposure Outcome Exposure and outcome at the same time

8
Lancet 2002; 359: 57-61

11
Analysis of pooled data from the randomised controlled trials of endarterectomy for symptomatic carotid stenosis. P. M. Rothwell et al LANCET. 2003

12
Experiencia Conferencia Emergencia Grandilocuencia Jurisprudencia Prepotencia Evidencia

17
Necesidad Información Buscar Evidencias Evaluación Evidencias Aplicación Clínica Retroalimentación

18
Plantear situación clínica. -Causalidad. -Intervenciones. -Diagnóstico. -Pronostico. Literatura Biomédica. Evaluar Evidencia. Sintetizar y Aplicar la Información. PASOS:

19
Requiere tiempo. Recursos. Simplificar Práctica (?). Busca reducir costos (?). Estudios Aleatorios y Meta-análisis.
. Estudios Aleatorios y Meta-análisis..")
20
Rating clinical evidence Assessment system of the US Preventive Services Task Force Quality of evidence 1 Evidence from at least one properly designed randomised controlled trial. 2-1 Evidence obtained from well-designed controlled trials without randomisation. 2-2 Evidence from well-designed cohort or case-control studies. preferably from more than one centre or research group. 2-3 Evidence from multiple time series with or without the intervention. Important results in uncontrolled experiments (such as the introduction of penicillin treatment in the 1940s) could also be considered as this type of evidence. 3Opinions of respected authorities, based on clinical experience, descriptive studies, or reports of expert committees. Strength of recommendations A) Good evidence to support the intervention. B) Fair evidence to support the intervention. C) Insufficient evidence to recommend for or against the intervention. But recommendation might be made on other grounds. D) Fair evidence against the intervention. E) Good evidence against the intervention.
 could also be considered as this type of evidence. 3Opinions of respected authorities, based on clinical experience, descriptive studies, or reports of expert committees. Strength of recommendations A) Good evidence to support the intervention. B) Fair evidence to support the intervention. C) Insufficient evidence to recommend for or against the intervention. But recommendation might be made on other grounds. D) Fair evidence against the intervention. E) Good evidence against the intervention..")
21
Población Exposición Control Desenlace

22
FUNCIONES: Uso Tiempo Estrategias Comunicación Didáctica Confianza

23
1.1 Validez 1.2 Resultados 1.3 Desenlaces 1.4 Aplicación Resultados 1.5 Costo: Beneficio

24
1.1 Validez - Aleatorio? - Seguimiento? - Ciego? - Grupos Comparables? - Igual Tratamiento?

29
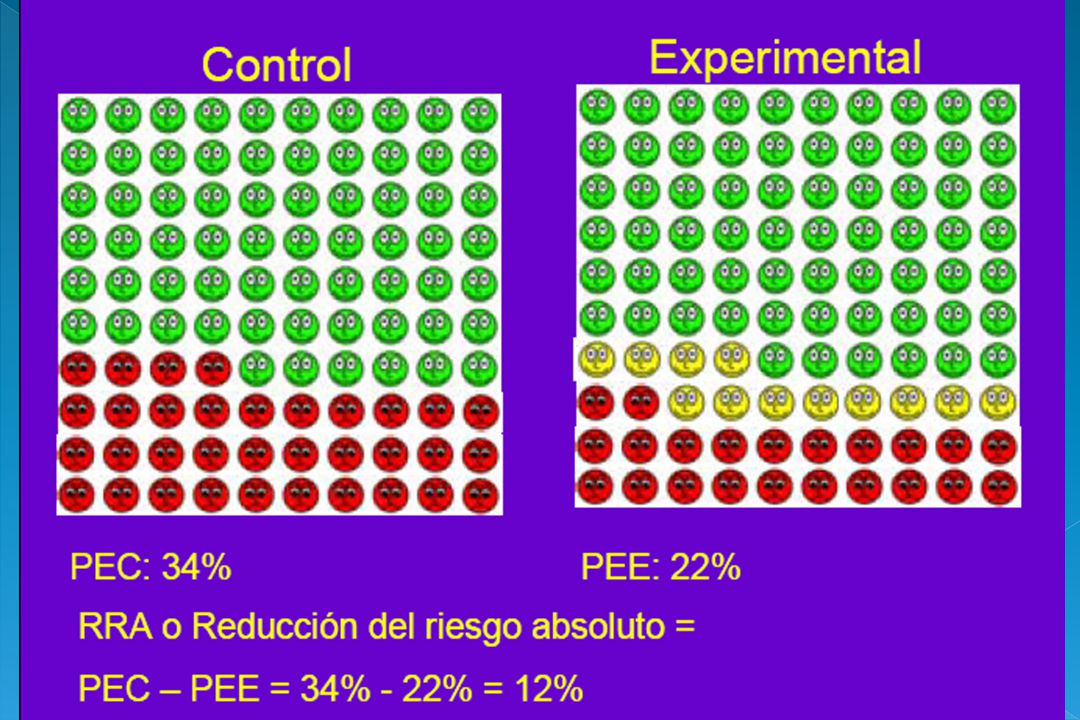
1.2 RESULTADOS a. Riesgo - Riesgo Relativo (RR) - Odds Ratio (OR) - Reducción Riesgo Relativo (RRR) - Reducción Absoluta Riesgo (RAR) b. Número Necesario Tratar b. Número Necesario Tratar (NNT)
 - Odds Ratio (OR) - Reducción Riesgo Relativo (RRR) - Reducción Absoluta Riesgo (RAR) b. Número Necesario Tratar b. Número Necesario Tratar (NNT).")
33
R.R. = Re/Rne RR = 1 : No existe Riesgo RR > 1 : Exposición Riesgo RR < 1 : Exposición Riesgo

36
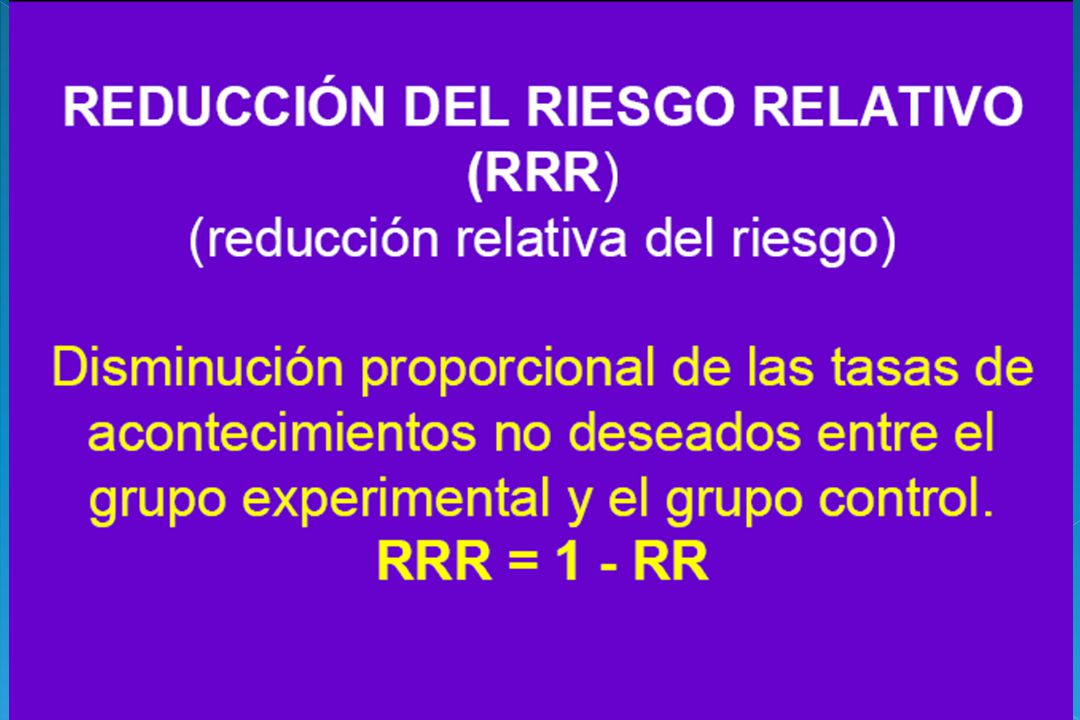
REDUCCION DE RIEGO RELATIVO (RRR) RRR = (1-RR) 100% RRR = 0: No Existe Riesgos RRR > 0: No Exposición Riesgos RRR < 0: No Exposición Riesgos
 RRR = (1-RR) 100% RRR = 0: No Existe Riesgos RRR > 0: No Exposición Riesgos RRR < 0: No Exposición Riesgos")
38
REDUCCION ABSOLUTA RIESGO (RAR) RAR : Rne - Re RAR = 0 : No Existe Riesgo RAR < 0 : Exposición Riesgos RAR > 0 : Exposición Riesgos
 RAR : Rne - Re RAR = 0 : No Existe Riesgo RAR < 0 : Exposición Riesgos RAR > 0 : Exposición Riesgos")
42
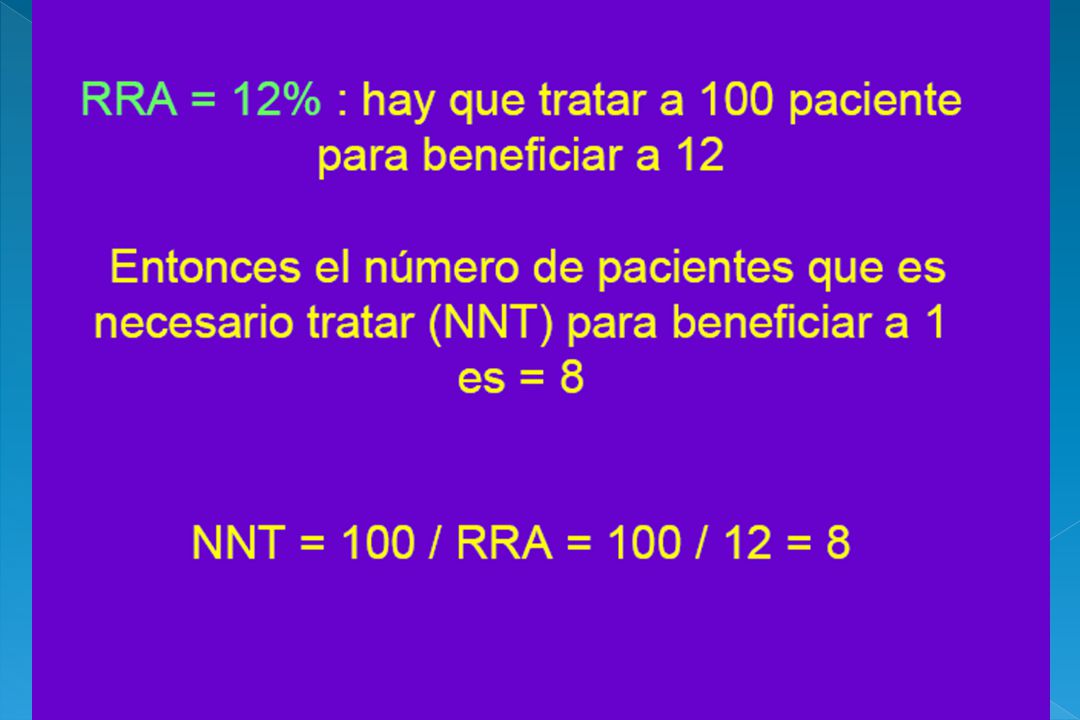
NUMERO NECESARIO TRATAR (NNT) NNT = 1/RAR = 1 (Rne - Re) NNT = 1 : Tx Ideal = : Tx Inútil > 0 : Tx Beneficioso < 0 : Tx Nocivo
 NNT = 1/RAR = 1 (Rne - Re) NNT = 1 : Tx Ideal = : Tx Inútil > 0 : Tx Beneficioso < 0 : Tx Nocivo")
49
Odds Ratio (OR) O.R : Oe/One O.R = 1 : No Existe Riesgo O.R > 1 : Exposición Riegos O.R < 1 : Exposición Riegos
 O.R : Oe/One O.R = 1 : No Existe Riesgo O.R > 1 : Exposición Riegos O.R < 1 : Exposición Riegos")
50
Aplicación Práctica ? Desenlaces Importantes ? Beneficios > Riesgos ?

51
Beneficio Relevante Beneficio Irrelevante Beneficio Relativo de Sobrevida (Indice de Riesgo) THE LANCET. 2001 Vol. 357 : 1349. MEDICINA BASADA EN EVIDENCIAS

52
Beneficioso Nocivo Beneficio Relativo de Sobrevida (Indice de Riesgo) THE LANCET. 2001 Vol. 357 : 1349. MEDICINA BASADA EN EVIDENCIAS

53
PREVENTION OF CORONARY AND STROKE EVENTS WITH ATORVASTATIN Y HYPERTENSIVE PATIENTS WHO HAVE AVERAGE OR LOWER THAN AVERAGE CHOLESTEROL CONCENTRATIONS, IN THE ANGLO-SCANDINAVIAN CARDIAC OUTCOMES TRIAL LIPID LOWERING ARM (ASCOTT-LLA). Peter S. Sever et al. LANCET. Vol 361. Abril 5, 2003

54
ACE inhibitors in AMI Curr Probl Cardiol, January 2003

57
FACTORES: Variabilidad Biológica Aspectos Socio-Económicos Aspectos Epidemiológicos

59
Costo-Efectividad = C A - C B / E A - E B C= costo. E= efectividad. A= Tx nuevo. B= Tx control.

Presentaciones similares


>")


