Descargar la presentación
La descarga está en progreso. Por favor, espere

1
Comparación de secuencias (Sequence comparison)
")
2
Objetivo Aprovechar información funcional y/o estructural identificando homología entre secuencias Diferencia entre Homología e identidad Dos secuencias se consideran homólogas cuando: Tienen el mismo origen evolutivo Tienen función y estructura similares

3
• Homologous sequences - sequences that share a common
evolutionary ancestry • Similar sequences - sequences that have a high percentage of aligned residues with similar physicochemical properties (e.g., size, hydrophobicity, charge) IMPORTANT: • Sequence homology: • An inference about a common ancestral relationship, drawn when two sequences share a high enough degree of sequence similarity • Homology is qualitative • Sequence similarity: • The direct result of observation from a sequence alignment • Similarity is quantitative; can be described using percentages
 IMPORTANT: • Sequence homology: • An inference about a common ancestral relationship, drawn when. two sequences share a high enough degree of sequence similarity. • Homology is qualitative. • Sequence similarity: • The direct result of observation from a sequence alignment. • Similarity is quantitative; can be described using percentages.")
6
Ejercicio

7
Proteínas posibles de 50 Aminoácidos ?
Nuestras proteínas son una minoría Proteínas posibles de 50 Aminoácidos ? MALRTGGPAL VVLLAFWVAL GPCHLQGTDP GASADAEGPQ CPVACTCSHD MRCAPTAGAA LVLCAATAGL LSAQGRPAQP EPPRFASWDE MNLLAHGLLQ 5020: proteínas posibles Proteínas distintas que existen en la naturaleza: unas Porcentaje de reales sobre posibles: % (o sea nada, prácticamente)
")
8
Más definiciones Orthologs: secuencias que corresponden exactamente a la misma función/estructura en organismos distintos Paralogs: secuencias producto de duplicaciones en un mismo organismo. Normalmente implican cambios de función.

9
ORTHOLOGS AND PARALOGS INTO LOCUS ß FROM GLOBINS

10
Homology and prediction
Very divergent protein sequences may suport similar structures Similar protein structures will probably have related or similar functions

11
3D STRUCTURE VERSUS SEQUENCE
Sequence alignment between human myoglobin, and globins from hemoglobin

12
Comparison of 3D structures of human myoglobin, and
globins from hemoglobin myoglobin -globin -globin

13
Comparison of 3D structures of human myoglobin, and
globins from hemoglobin myoglobin -globin -globin

14
Homology and prediction
La comparación de secuencias es el método más simple para identificar la existencia de homología. Identidad > 30% en proteína implica homología Identidad > 80-90% es normal en ortólogos de especies cercanas Identidad 10-30%. Si existe homología, es indetectable (“twilight zone”)
")
15
¿DNA o proteína? Ambas proporcionan información sobre homología
DNA: Solamente la identidad entre bases es relevante Proteína: Existen equivalencia funcional entre aminoácidos

16
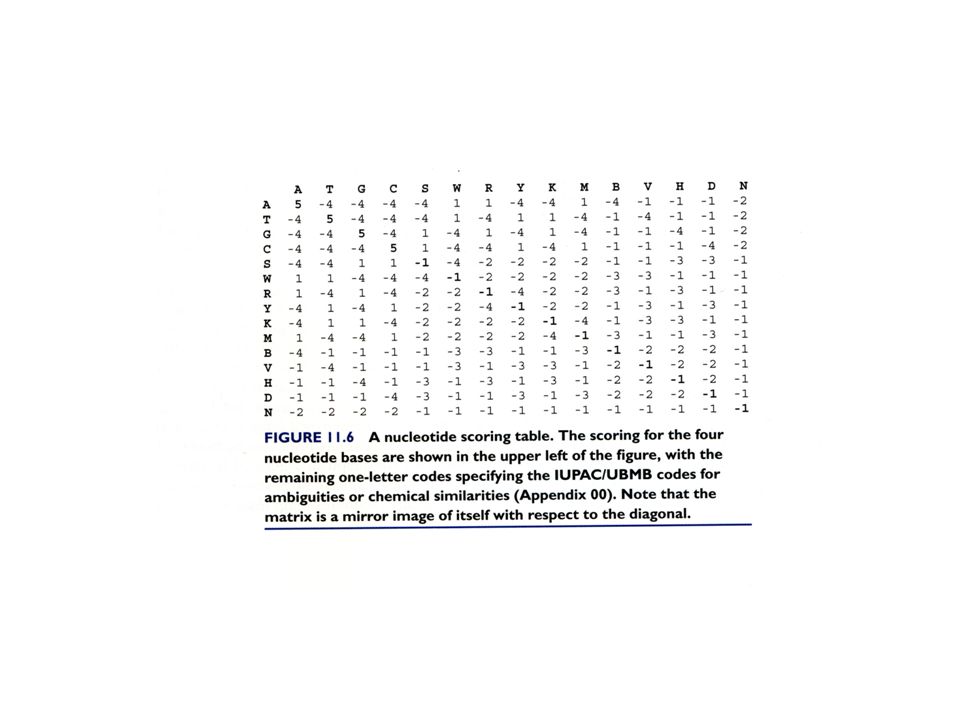
Apareamientos canónicos (Watson-Crick)
Unicamente la identidad es relevante

18
Mismatch costs are not usually used in aligning
DNA or RNA sequences, because no substitution is "better" than any other (in general)
")
19
Degeneración en la tercera posición
Código genético Pos 1 Posición 2 Pos 3 U C A G Phe Leu Ser Tyr Stop Cys Trp Pro His Gln Arg Ile Met Thr Asn Lys Val Ala Asp Glu Gly Trp, Met (1) Leu, Ser, Arg (6) resto (2) Iniciación AUG Stop (3) Degeneración en la tercera posición XYC = XYU XYA ~ XYG
 Leu, Ser, Arg (6) resto (2) Iniciación AUG. Stop (3) Degeneración en la tercera posición. XYC = XYU. XYA ~ XYG.")
20
Aminoácidos “equivalentes”
Hidrofóbicos Ala (A), Val (V), Met (M), Leu (L), Ile (I), Phe (F), Trp (W), Tyr (Y) Pequeños Gly (G), Ala (A), Ser (S) Polares Ser (S), Thr (T), Asn (N), Gln (Q), Tyr (Y) En la superficie de la proteína polares y cargados son equivalentes Cargados Asp (D), Glu (E) / Lys (K), Arg (R) Dificilmente sustituibles Gly (G), Pro (P), Cys (C), His (H)
, Val (V), Met (M), Leu (L), Ile (I), Phe (F), Trp (W), Tyr (Y) Pequeños. Gly (G), Ala (A), Ser (S) Polares. Ser (S), Thr (T), Asn (N), Gln (Q), Tyr (Y) En la superficie de la proteína polares y cargados son equivalentes. Cargados. Asp (D), Glu (E) / Lys (K), Arg (R) Dificilmente sustituibles. Gly (G), Pro (P), Cys (C), His (H)")
21
3D visualization of some conserved residues in globin family
(Myoglobin structure) Prolin in a turn Histidin For the hemo coordination bonds 2 conserved glycines in 2 separate helix crossing each other
 Prolin in a turn. Histidin. For the hemo. coordination bonds. 2 conserved glycines in 2. separate helix crossing each. other.")
22
La secuencia de DNA diverge más rápidamente
mutación o recombinación altera el DNA pero debe mantener la función/estructura La comparación de proteínas permite localizar homologías más lejanas

23
Alineamiento de secuencias
Medir la homología entre secuencias requiere un “alineamiento” Homología alta: AWTRRATVHDGLMEDEFAA AWTRRATVHDGLCEDEFAA Homología baja: AWTKLATAVVVFEGLCEDEWGG AWTRRAT---VHDGLMEDEFAA

24
Tipos alineamiento “pairwise” Multiple Global Local Dos secuencias
Más de dos secuencias Global Toda la secuencia se considera Local Unicamente se alinean regiones parecidas

25
Estrategias Depende del objetivo
Comparación de secuencias Objetivo: medir homología, identificar aminoácidos equivalentes global, ”pairwise”/múltiple Búsqueda en bases de datos Objetivo: Identificar homólogos en un conjunto grande de secuencias Local, “pairwise”

26
Alineamiento manual proteína
Requiere “oficio” Conocer propiedades de aminoácidos Conocer la proteína Permite incorporar información adicional Aminoácidos funcionales Aminoácidos necesarios para mantener la estructura … Es lento y poco reproducible

27
Alineamiento automático (problema de optimización)
Requiere un método objetivo de comparar aminoácidos o bases para “puntuar” el alineamiento (matrices de comparación) algoritmo para encontrar el alineamiento con la máxima puntuación Es reproducible y rápido No permite, en general, introducir información adicional
 algoritmo para encontrar el alineamiento con la máxima puntuación. Es reproducible y rápido. No permite, en general, introducir información adicional.")
28
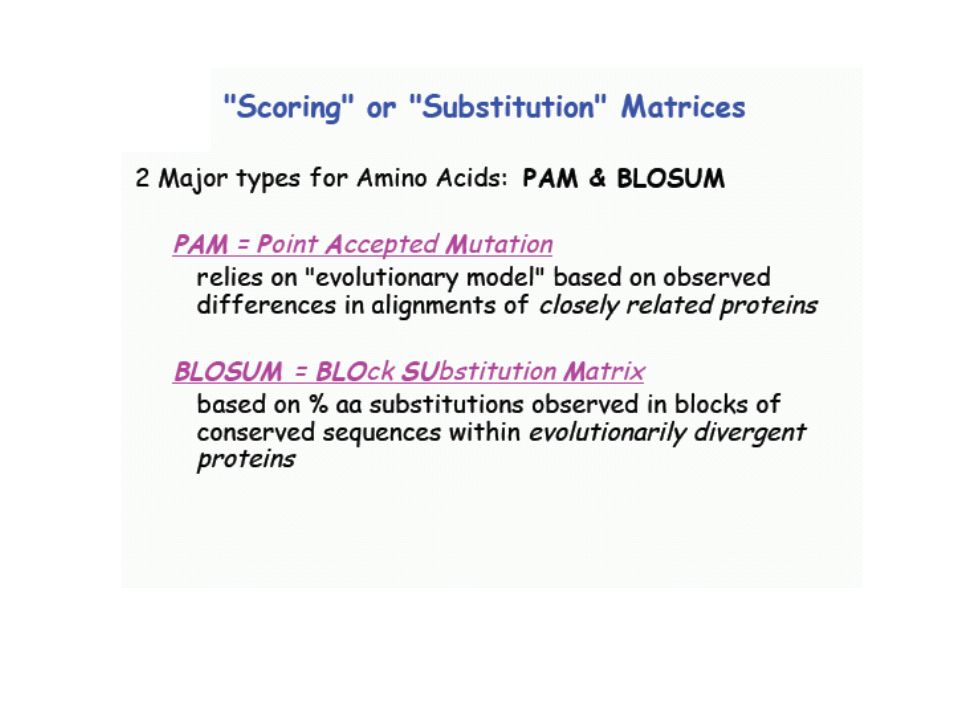
Tipos de matrices Identidad Propiedades físico-químicas
Genéticas (sustitución de codones) Evolutivas
 Evolutivas.")
30
La aplicación sucesiva de la matriz PAM permite simular varias generaciones
PAM 40, PAM 100, PAM 250 Evolutionary distance considered is constant Bigger number bigger divergence. Less stringent

31
Evolutionary distances considered are variable
More modern than PAM but similar results. Smaller is n bigger divergence. Less stringency

32
Blosum 62 Small positive score for changes in similar aminoacids
commonaminoacids Infrequente aminoacids have high score High Penalty for very different aminoacids

33
¿Which matrix to use?? No clear answer
All matrix evaluate functional equivalence between aminoacids in the light of evolution and conservation: la equivalencia funcional entre aminoácidos

34
Choice of a Matrix! BLOSUM90 PAM30 BLOSUM80 PAM120 BLOSUM62 PAM180
Rat versus mouse protein Rat versus bacterial protein

35
Query Length Substitution Matrix Gap Costs <35 PAM-30 (9,1) 35-50
(10,1) 50-85 BLOSUM-80 85 BLOSUM-62 PAM Point Accepted Mutatiton
 BLOSUM BLOSUM-62. PAM Point Accepted Mutatiton.")
36
Gaps (inserciones/delecciones)
Normalmente localizados en loops AWTKLATAVVVFEGLCEDEWGG AWTRRAT---VHDGLMEDEFAA

37
Gaps (inserciones/delecciones)
Esquemas de puntuación: Dependiendo de estructura 2ª Valor constante Función lineal go + n.gl

38
Global versus local alignment
Global alignment Finds best possible alignment across entire length of 2 sequences Aligned sequences assumed to be generally similar over entire length Local alignment Finds local regions with highest similarity between 2 sequences Aligns these without regard for rest of sequence Sequences are not assumed to be similar over entire length

39
Global or Local ? 1. Searching for conserved motifs in DNA or protein sequences? 2. Aligning two closely related sequences with similar lengths? 3. Aligning highly divergent sequences? 4. Generating an extended alignment of closely related sequences? 5. Generating an extended alignment of closely related sequences with very different lengths?

40
Local vs. Global Alignment (cont’d)
Local Alignment—better alignment to find conserved segment --T—-CC-C-AGT—-TATGT-CAGGGGACACG—A-GCATGCAGA-GAC | || | || | | | ||| || | | | | |||| | AATTGCCGCC-GTCGT-T-TTCAG----CA-GTTATG—T-CAGAT--C tccCAGTTATGTCAGgggacacgagcatgcagagac |||||||||||| aattgccgccgtcgttttcagCAGTTATGTCAGatc

41
Comparación de secuencias contra bases de datos
Base de datos De secuencias AGLM...WTKR TCGGLMN..HICG WRKCPGL ... Secuencia incógnita ATTVG...LMN Requiere algoritmos de comparación muy rápidos

42
Diasdvantages from global alignment
Slow Scores whole sequence Do not recognize multidomain proteins Global alignment server A B C A C’ B D

43
Alineamiento local 10 – 100x más rápidos
Reconocen dominios individuales No proporcionan necesariamente el mejor alineamiento! BLAST, FASTA

44
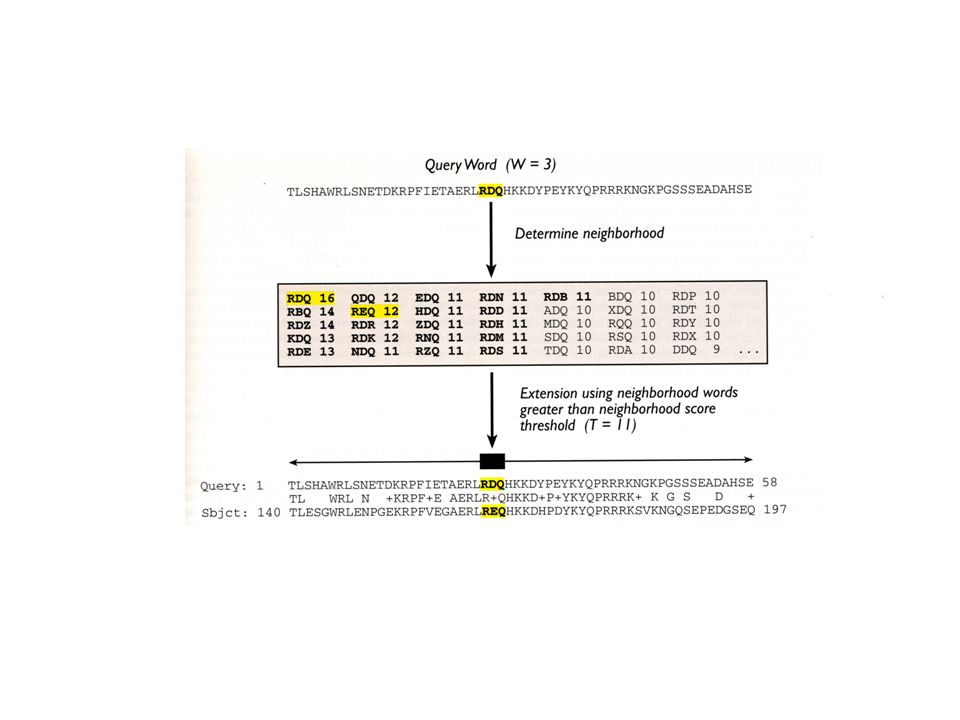
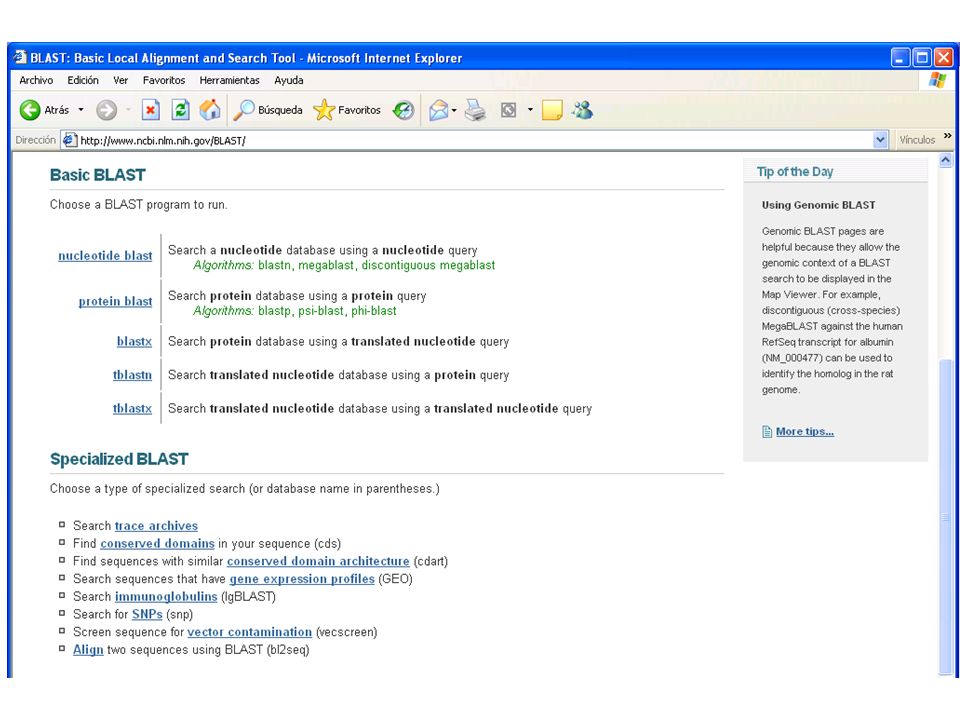
Basic Local Alignment Search Tool Blast NCBI

46
Basic Local Alignment Search Tool Blast NCBI
The Basic Local Alignment Search Tool (BLAST) finds regions of local similarity between sequences. The program compares nucleotide or protein sequences to sequence databases and calculates the statistical significance of matches. BLAST can be used to infer functional and evolutionary relationships between sequences as well as help identify members of gene families.
 finds regions of local similarity between. sequences. The program compares nucleotide or protein sequences to sequence. databases and calculates the statistical significance of matches. BLAST can be used. to infer functional and evolutionary relationships between sequences as well as help. identify members of gene families.")
48
Formatos entrada

50
E parameter (Expected threshold)
Expect The Expect value (E) is a parameter that describes the number of hits one can "expect" to see just by chance when searching a database of a particular size. It decreases exponentially with the Score (S) that is assigned to a match between two sequences. Essentially, the E value describes the random background noise that exists for matches between sequences. For example, an E value of 1 assigned to a hit can be interpreted as meaning that in a database of the current size one might expect to see 1 match with a similar score simply by chance. This means that the lower the E-value, or the closer it is to "0" the more "significant" the match is. However, keep in mind that searches with short sequences, can be virtually indentical and have relatively high EValue. This is because the calculation of the E-value also takes into account the length of the Query sequence. This is because shorter sequences have a high probability of occuring in the database purely by chance.
 is a parameter that describes the number of hits one can expect to see just by chance when searching a database of a particular size. It decreases exponentially with the Score (S) that is assigned to a match between two sequences. Essentially, the E value describes the random background noise that exists for matches between sequences. For example, an E value of 1 assigned to a hit can be interpreted as meaning that in a database of the current size one might expect to see 1 match with a similar score simply by chance. This means that the lower the E-value, or the closer it is to 0 the more significant the match is. However, keep in mind that searches with short sequences, can be virtually indentical and have relatively high EValue. This is because the calculation of the E-value also takes into account the length of the Query sequence. This is because shorter sequences have a high probability of occuring in the database purely by chance.")
51
E value (Expect) E value: Warning: E → Falsos negativos
Expect: This setting specifies the statistical significance threshold for reporting matches against database sequences. The default value (10) means that 10 such matches are expected to be found merely by chance, according to the stochastic model of Karlin and Altschul (1990). If the statistical significance ascribed to a match is greater than the EXPECT threshold, the match will not be reported. Lower EXPECT thresholds are more stringent, leading to fewer chance matches being reported. E = K.m.n.e-l.S Warning: E → Falsos negativos Score Normalization factors Number of letters in query Number of letters in data baseScore
 means that 10 such matches are expected to be found merely by chance, according to the stochastic model of Karlin and Altschul (1990). If the statistical significance ascribed to a match is greater than the EXPECT threshold, the match will not be reported. Lower EXPECT thresholds are more stringent, leading to fewer chance matches being reported. E = K.m.n.e-l.S. Warning: E → Falsos negativos. Score. Normalization factors. Number of. letters in query. Number of letters. in data baseScore.")
52
Estadística Indice de referencia:
E: número de falsos positivos esperado Búsquedas esporádicas: 0.01 – 0.001 Búsquedas masivas (anotación genoma): 10-6
:")
53
Programas Blast blastp blastn blastx tblastn tblastx
amino acid query sequence vs. protein sequence database blastn nucleotide query sequence vs. nucleotide sequence database blastx nucleotide query sequence translated in all reading frames vs. protein sequence database tblastn protein query sequence vs. a nucleotide sequence database translated in all reading frames tblastx six-frame translations of a nucleotide query vs. the six-frame translations of a nucleotide sequence database.

54
¿Qué programa usar? La comparación en proteína permite ampliar el espectro de búsqueda (aunque comparemos DNA!) Blastn → blastx, tblastx Blastp → tblastn Degeneración del código genético Equivalencia funcional entre aminoácidos

55
BLAST substitution matrices
A key element in evaluating the quality of a pairwise sequence alignment is the "substitution matrix", which assigns a score for aligning any possible pair of residues. The theory of amino acid substitution matrices is described in [1], and applied to DNA sequence comparison in [2]. In general, different substitution matrices are tailored to detecting similarities among sequences that are diverged by differing degrees [1-3]. A single matrix may nevertheless be reasonably efficient over a relatively broad range of evolutionary change [1-3]. Experimentation has shown that the BLOSUM-62 matrix [4] is among the best for detecting most weak protein similarities. For particularly long and weak alignments, the BLOSUM-45 matrix may prove superior. A detailed statistical theory for gapped alignments has not been developed, and the best gap costs to use with a given substitution matrix are determined empirically. Short alignments need to be relatively strong (i.e. have a higher percentage of matching residues) to rise above background noise. Such short but strong alignments are more easily detected using a matrix with a higher "relative entropy" [1] than that of BLOSUM-62. In particular, short query sequences can only produce short alignments, and therefore database searches with short queries should use an appropriately tailored matrix. The BLOSUM series does not include any matrices with relative entropies suitable for the shortest queries, so the older PAM matrices [5,6] may be used instead. For proteins, a provisional table of recommended substitution matrices and gap costs for various query lengths is:
 to rise above background noise. Such short but strong alignments are more easily detected using a matrix with a higher relative entropy [1] than that of BLOSUM-62. In particular, short query sequences can only produce short alignments, and therefore database searches with short queries should use an appropriately tailored matrix. The BLOSUM series does not include any matrices with relative entropies suitable for the shortest queries, so the older PAM matrices [5,6] may be used instead. For proteins, a provisional table of recommended substitution matrices and gap costs for various query lengths is:")
Presentaciones similares


 Sintetizado en vivo por la enzima NO-sintetasa>")


 1:00 is the ONLY time where we say “Es la…”>")


. When we ask what time it is in Spanish, we say “¿Qué hora es?” Some people also say “¿Qué horas son?”>")

