Descargar la presentación
La descarga está en progreso. Por favor, espere

1
Análisis del Macro-entornó Constructora La Roca S.A 2013

3
INVERSION PUBLICA 2012 6.287 MILLONES 2011 5.243 MILLONES 2010 2.877 MILLONES 2006 853 MILLONES

6
QUINTIL%POBLACION Ingreso Promedio Miembros por familia TOTAL INGRESEOS MILES DE USD COMPRA DE ACTIVOS FIJOS FINANCIEROS E INMUEBLES MILES DE USD PROMEDIO DE GASTO POR HOGAR EN ACTIVOS FIJOS, FINANCIEROS E INMUEBLES QUINTIL 123% 3.267.127 294 5,60 2.058.290 267.578 459 QUINTIL 221% 2.983.029 518 4,70 3.945.215 512.878 808 QUINTIL 320% 2.840.980 707 4,00 6.025.719 783.343 1.103 QUINTIL 419% 2.698.931 979 3,50 9.059.155 1.177.690 1.527 QUINTIL 517% 2.414.833 2.082 3,00 20.110.729 2.614.395 3.248 TOTAL 14.204.900 41.199.107 5.355.884 CUANTIFICACION DEL MERCADO

7
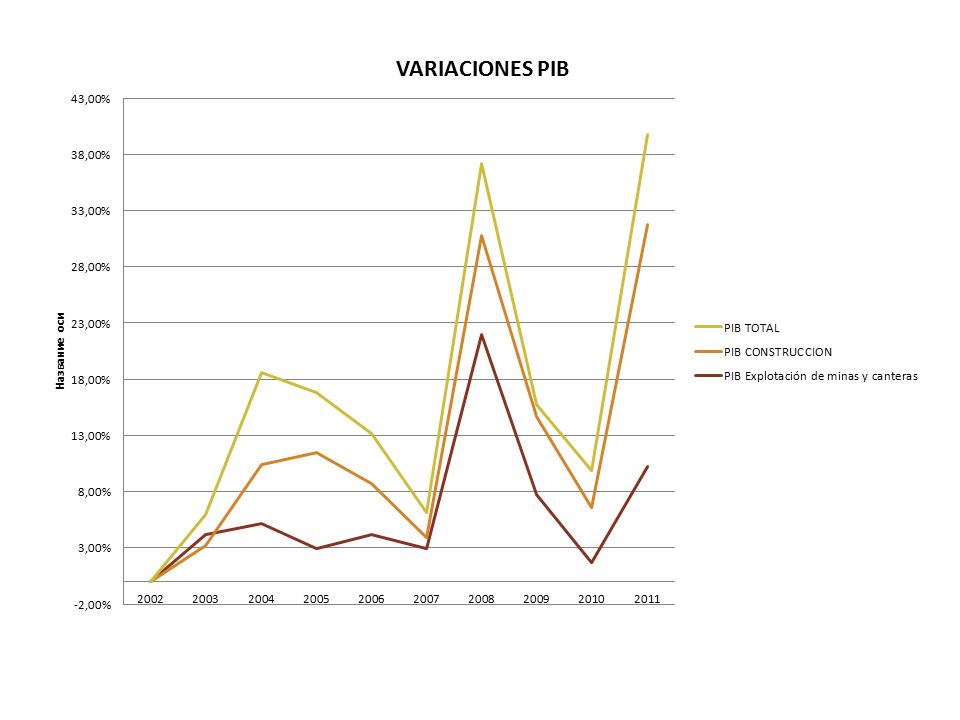
AñoPICHINCHACrecimientoPAISCrecimientoPart 2007 1.340.74510.890.47212% 2008 1.243.011-7%6.856.499-37%18% 2009 1.550.34125%9.735.72142%16% 2010 1.293.912-17%10.841.82411%12% 2011 2.144.47966%7.601.612-30%28% PRODUCCION DE LAS CANTERAS EN PICHINCHA Y PAIS

9
AñoDESEMPLEO % OCUPACION PLENA % SUBEMPLEO % 2007 4,99 34,20 59,80 2008 5,90 35,78 58,08 2009 6,46 31,53 60,07 2010 4,99 37,34 56,84 2011 4,19 40,55 54,66

Presentaciones similares
: $ 403 mil millones Total oferta.>")


