Descargar la presentación
La descarga está en progreso. Por favor, espere

1
Enfermedad de las Manchas Blancas (EMB) White Spot Disease (WSD) Actualización del diagnóstico ambiental Octubre 2010
 White Spot Disease (WSD) Actualización del diagnóstico ambiental Octubre 2010")
2
Climate Diagnostic Bulletin http://www.cpc.noaa.gov/products/CDB/index.shtml

3
Multivariate ENSO Index El Niño/Southern Oscillation (ENSO) is the most important coupled ocean- atmosphere phenomenon to cause global climate variability on interannual time scales. Here we attempt to monitor ENSO by basing the Multivariate ENSO Index (MEI) on the six main observed variables over the tropical Pacific. These six variables are: sea-level pressure (P), zonal (U) and meridional (V) components of the surface wind, sea surface temperature (S), surface air temperature (A), and total cloudiness fraction of the sky (C). These observations have been collected and published in COADS for many years.COADS P Presión a nivel del mar U y V Componentes meridional y zonal de los vientos de superficie S Temperatura superficial del mar A Temperatura superficial del aire C Fracción de nubosidad en el cielo El Índice de Oscilación del Sur / El Niño (ENSO) es el fenómeno de acoplamiento océano atmósfera más importante relacionado con la variabilidad climática a una escala de tiempo interanual. El Índice ENSO multivariado integra seis variables observadas en el Pacífico Tropical. ENSO
 on the six main observed variables over the tropical Pacific. These six variables are: sea-level pressure (P), zonal (U) and meridional (V) components of the surface wind, sea surface temperature (S), surface air temperature (A), and total cloudiness fraction of the sky (C). These observations have been collected and published in COADS for many years.COADS P Presión a nivel del mar U y V Componentes meridional y zonal de los vientos de superficie S Temperatura superficial del mar A Temperatura superficial del aire C Fracción de nubosidad en el cielo El Índice de Oscilación del Sur / El Niño (ENSO) es el fenómeno de acoplamiento océano atmósfera más importante relacionado con la variabilidad climática a una escala de tiempo interanual. El Índice ENSO multivariado integra seis variables observadas en el Pacífico Tropical. ENSO.")
4
Last update: 7 October 2010 http://www.esrl.noaa.gov/psd/people/klaus.wolter/MEI/

5
SOI, Tahiti and Darwin SLP and OLR Anomalies SEPTEMBER 2010 FIGURE T1. Five-month running mean of the Southern Oscillation Index (SOI) (top), sea-level pressure anomaly (hPa) at Darwin and Tahiti (middle), and outgoing longwave radiation anomaly (OLR) averaged over the area 5N-5S, 160E-160W (bottom). Anomalies in the top and middle panels are departures from the 1951-1980 base period means and are normalized by the mean annual standard deviation. Anomalies in the bottom panel are departures from the 1979-1995 base period means. Individual monthly values are indicated by "x"s in the top and bottom panels. The x-axis labels are centered on July. http://www.cpc.noaa.gov/produc ts/CDB/Tropics/figt1.shtml
 (top), sea-level pressure anomaly (hPa) at Darwin and Tahiti (middle), and outgoing longwave radiation anomaly (OLR) averaged over the area 5N-5S, 160E-160W (bottom). Anomalies in the top and middle panels are departures from the base period means and are normalized by the mean annual standard deviation. Anomalies in the bottom panel are departures from the base period means. Individual monthly values are indicated by x s in the top and bottom panels. The x-axis labels are centered on July. ts/CDB/Tropics/figt1.shtml.")
6
SEPTEMBER 2010 FIGURE T2. Three-month running mean of a CDAS/Reanalysis-derived (a) Southern Oscillation Index (RSOI), (b) standardized pressure anomalies near Tahiti (solid) and Darwin (dashed), (c) an equatorial SOI ([EPAC] - [INDO]), and (d) standardized equatorial pressure anomalies for (EPAC) (solid) and (INDO) (dashed). Anomalies are departures from the 1979-1995 base period means and are normalized by the mean annual standard deviation. The equatorial SOI is calculated as the normalized difference between the standardized anomalies averaged between 5N-5S, 80W-130W (EPAC) and 5N-5S, 90E-140E (INDO). http://www.cpc.noaa.gov/products/ CDB/Tropics/figt2.shtml
 Southern Oscillation Index (RSOI), (b) standardized pressure anomalies near Tahiti (solid) and Darwin (dashed), (c) an equatorial SOI ([EPAC] - [INDO]), and (d) standardized equatorial pressure anomalies for (EPAC) (solid) and (INDO) (dashed). Anomalies are departures from the base period means and are normalized by the mean annual standard deviation. The equatorial SOI is calculated as the normalized difference between the standardized anomalies averaged between 5N-5S, 80W-130W (EPAC) and 5N-5S, 90E-140E (INDO). CDB/Tropics/figt2.shtml.")
7
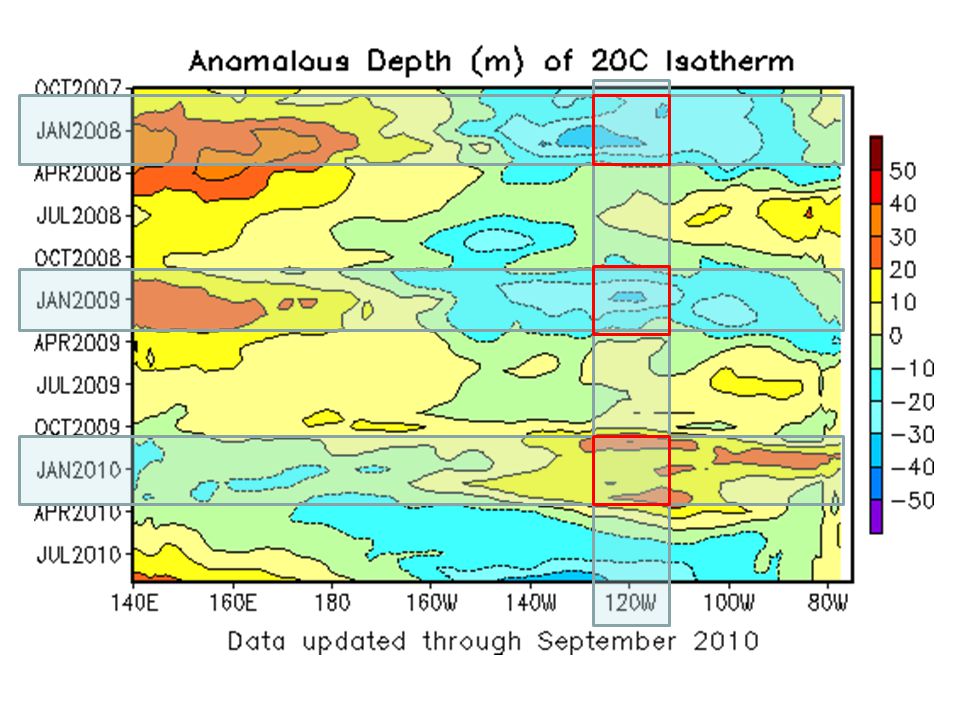
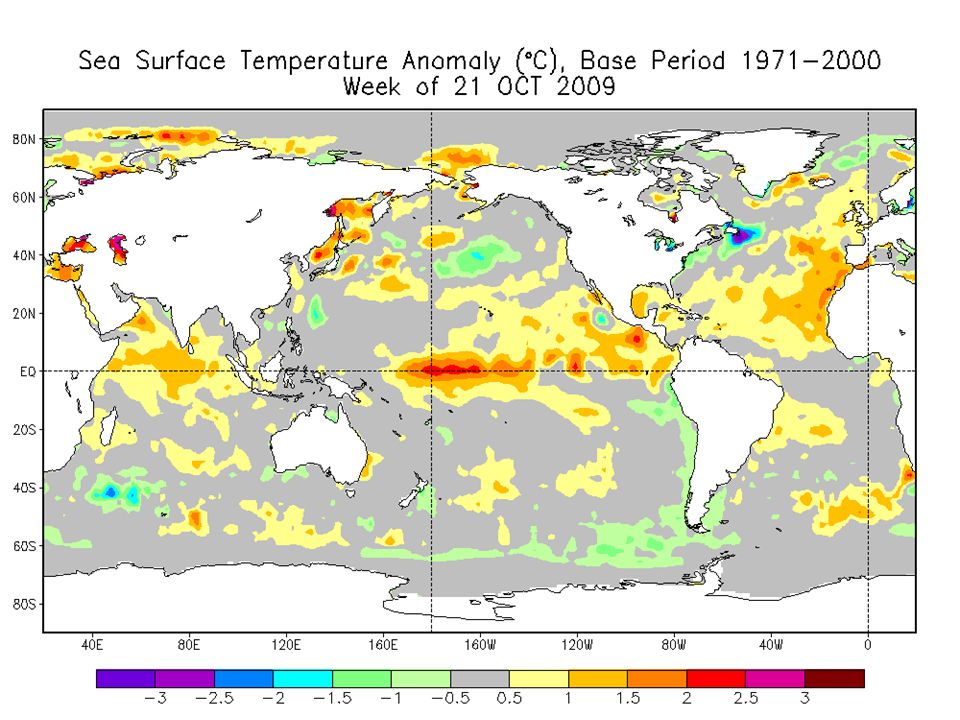
Nino region SST indices SEPTEMBER 2010 FIGURE T5. Nino region indices, calculated as the area-averaged sea surface temperature anomalies (C) for the specified region. The Nino 1+2 region (top) covers the extreme eastern equatorial Pacific between 0-10S, 90W-80W. The Nino-3 region (2nd from top) spans the eastern equatorial Pacific between 5N-5S, 150W-90W. The Nino 3.4 region 3rd from top) spans the east-central equatorial Pacific between 5N-5S, 170W-120W. The Nino 4 region (bottom) spans the date line and covers the area 5N-5S, 160E-150W. Anomalies are departures from the 1971-2000 base period monthly means (Smith and Reynolds 1998, J. Climate, 11, 3320-3323). Monthly values of each index are also displayed in Table 2.Table 2 Weekly Niño 1+2 (0-10°South)(90°West-80°West) Niño 3 (5°North-5°South)(150°West-90°West) Niño 3.4 (5°North-5°South)(170-120°West): Niño 4 (5°North-5°South) (160°East-150°West) http://www.cpc.noaa.gov/products/CDB/Tropics/figt5.shtml
 for the specified region. The Nino 1+2 region (top) covers the extreme eastern equatorial Pacific between 0-10S, 90W-80W. The Nino-3 region (2nd from top) spans the eastern equatorial Pacific between 5N-5S, 150W-90W. The Nino 3.4 region 3rd from top) spans the east-central equatorial Pacific between 5N-5S, 170W-120W. The Nino 4 region (bottom) spans the date line and covers the area 5N-5S, 160E-150W. Anomalies are departures from the base period monthly means (Smith and Reynolds 1998, J. Climate, 11, ). Monthly values of each index are also displayed in Table 2.Table 2 Weekly Niño 1+2 (0-10°South)(90°West-80°West) Niño 3 (5°North-5°South)(150°West-90°West) Niño 3.4 (5°North-5°South)( °West): Niño 4 (5°North-5°South) (160°East-150°West)")
11
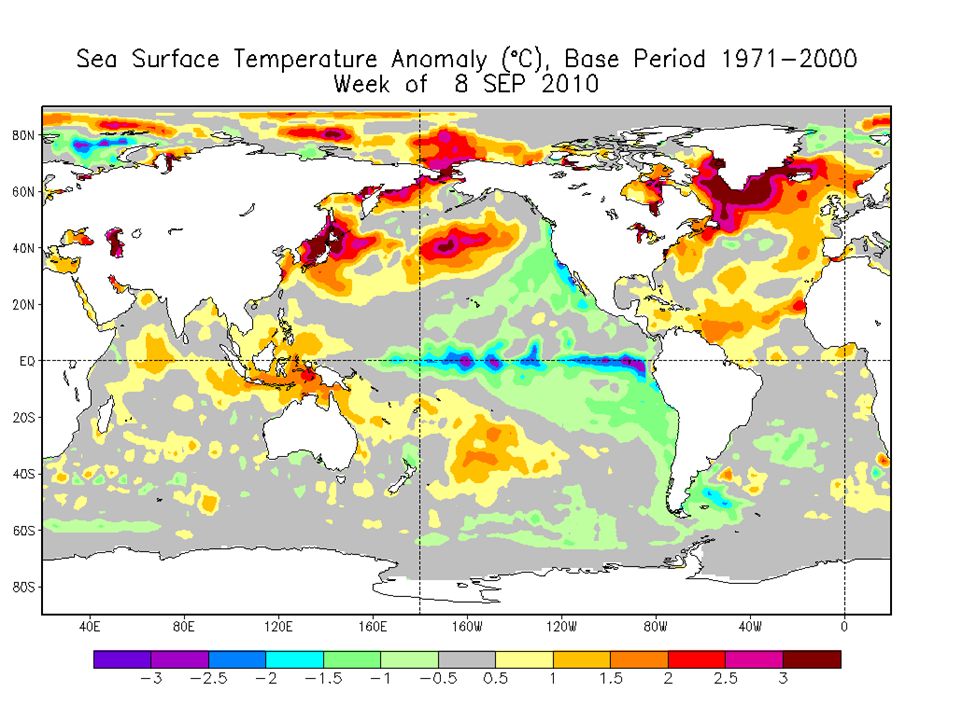
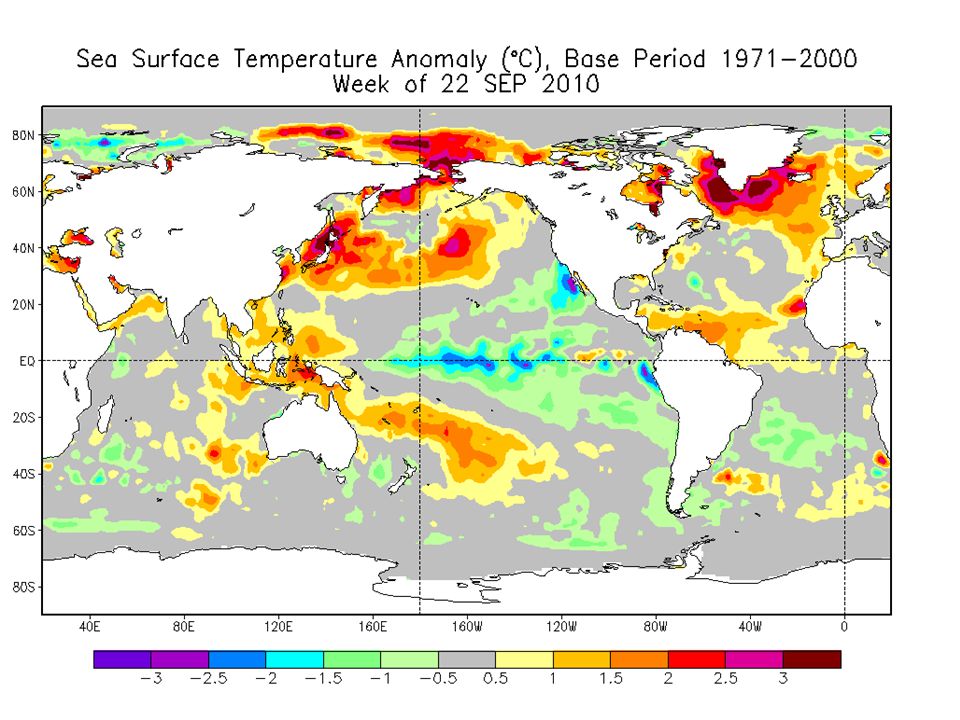
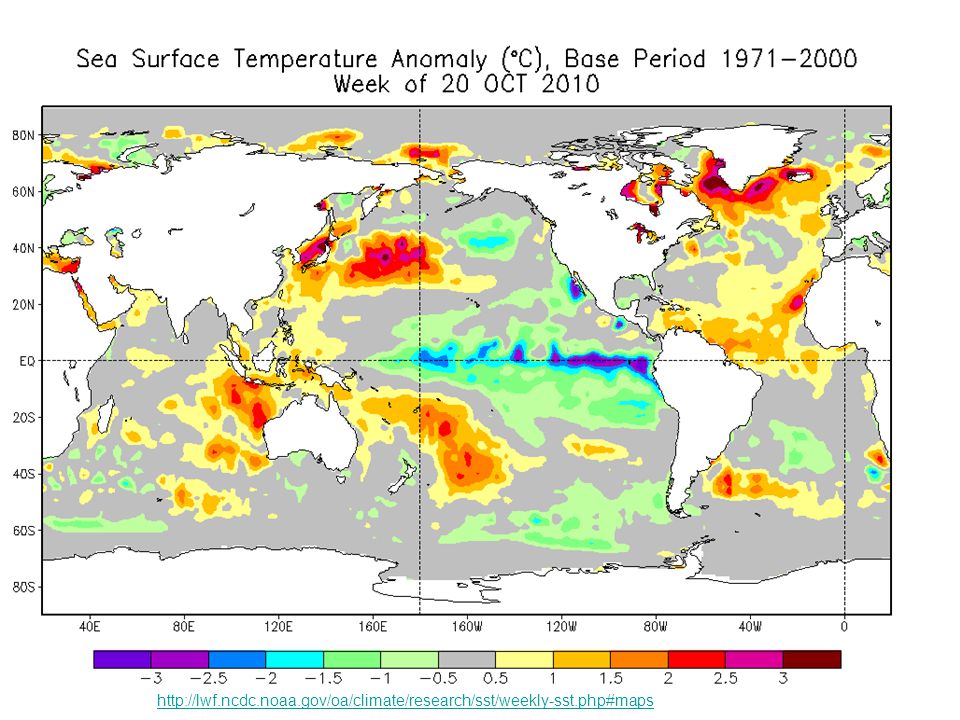
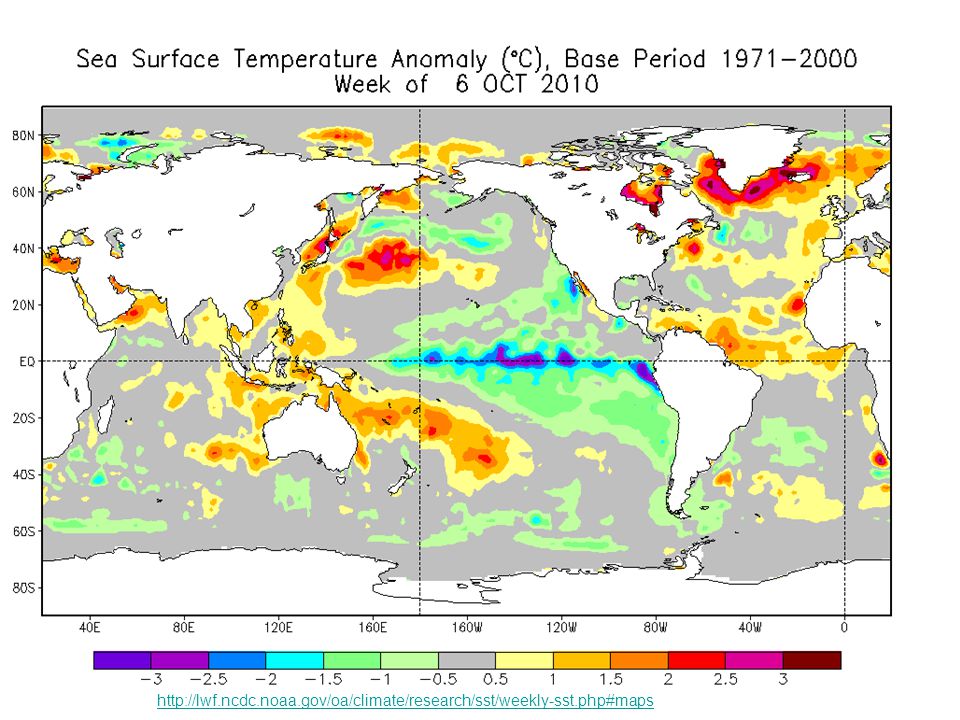
http://lwf.ncdc.noaa.gov/oa/climate/research/sst/weekly-sst.php#maps
14
http://www.cpc.noaa.gov/products/analysis _monitoring/enso_update/sstanim.shtml Temperaturas últimos tres meses

15
Gracias

16
PISA AERI Diagnóstico climático del Golfo de California Durante el Vacío Sanitario 2009-2010

17
.http://www.physicalgeography.net/fundamentals/8q_1.html Corrientes Marinas superficiales

18
Presión Atmosférica Parte Oriental < Presión Atmosférica Parte occidental

19
Presión Atmosférica Parte Oriental < < Presión Atmosférica Parte occidental

20
Presión Atmosférica Parte Oriental > Presión Atmosférica Parte occidental

21
http://www.cgd.ucar.edu/cas/ http://www.cgd.ucar.edu/cas/catalog/climind/soi.html
22
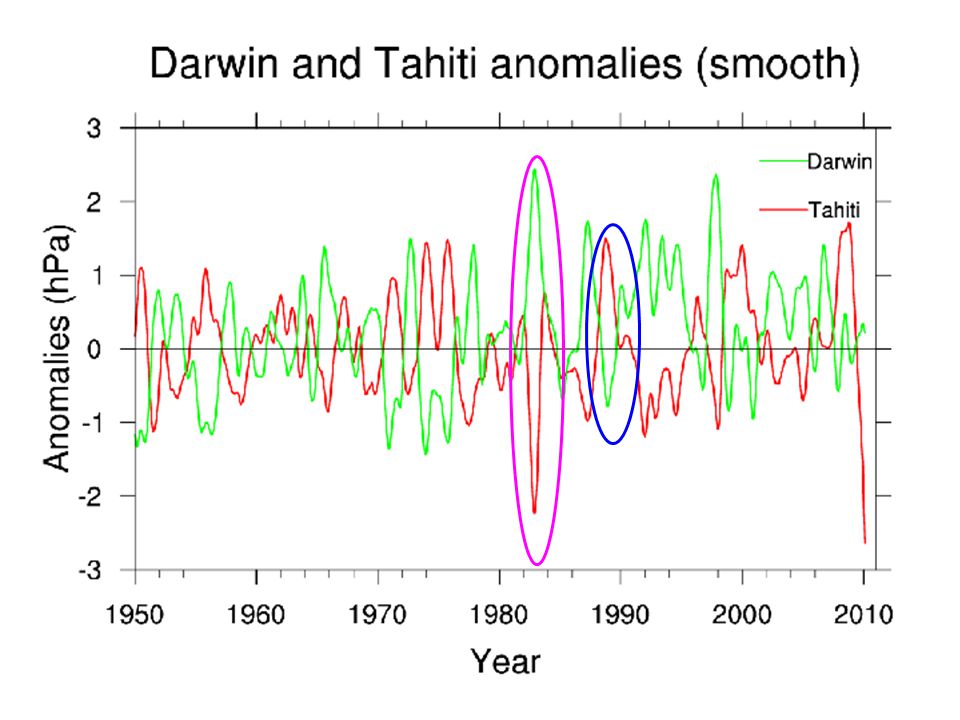
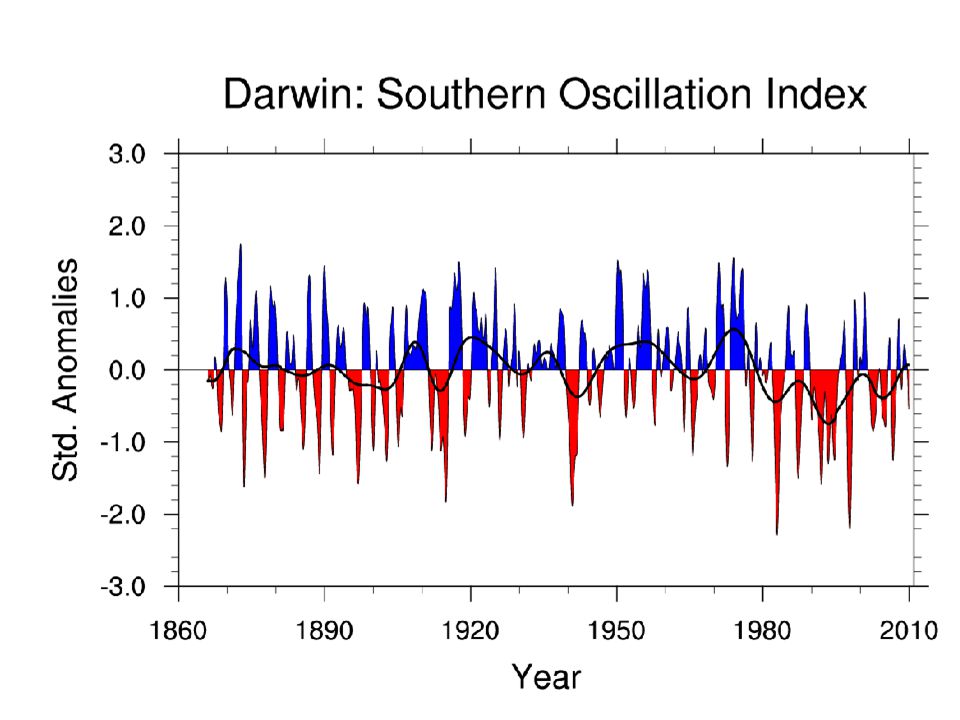
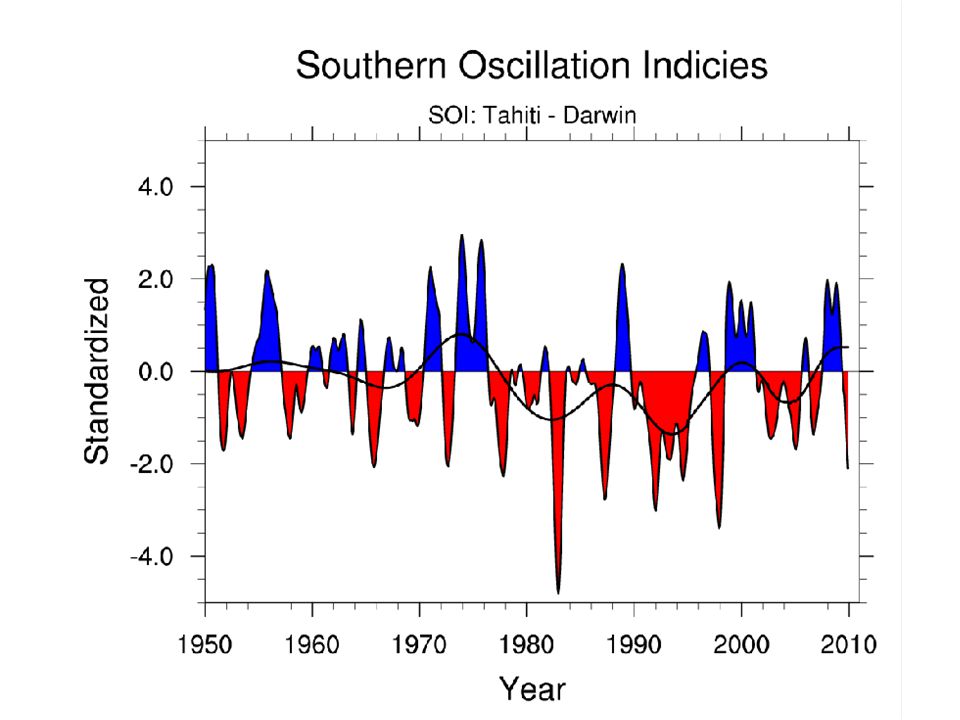
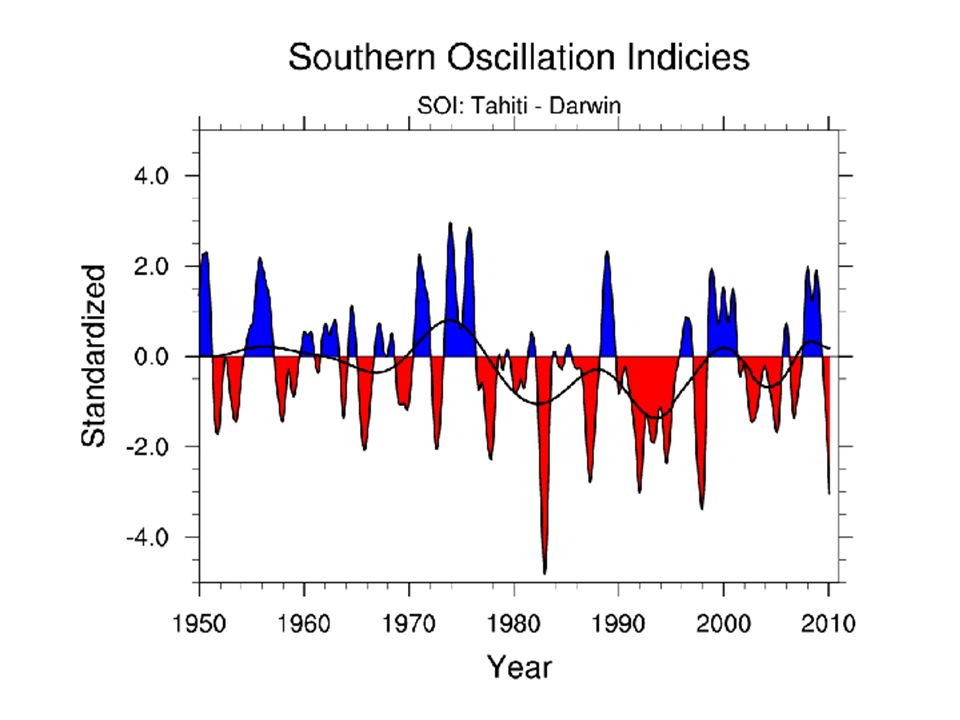
Southern Oscillation Index (SOI) Click here to download data files.here The Southern Oscillation Index (SOI) presented below is computed using monthly mean sea level pressure anomalies at Tahiti (T) and Darwin (D). The SOI [T-D] is an optimal index that combines the Southern Oscillation into one series. The SOI noise [T+D] series is a measure of small scale and/or transient phenomena that are not part of the large scale Southern Oscillation. These SOI values are similar to those calculated by the Climate Prediction Center in that they have been derived using normalization factors derived from monthly values.Climate Prediction Center The SOI values prior to 1935 should be used with caution. There are questions regarding the consistency and quality of the Tahiti pressure values prior to 1935. The smoothed curves below were created using a a filter which effectively removes fluctuations with periods of less than 8 months but includes all others. At 24 months 80% of the variance is retained. The smooth curve denoted by a thick black line is that produced using a decadal filter over thge original monthly values. As noted above, the SOI presented here are derived using monthly values as was done in Trenberth (MWR, 1984). However, Trenberth notes that better signal-to-noise ratios may be obtained by using normalization factors based upon annual means. To view figures and to download data derived using this approach, click here.here Relevant publications: Trenberth (1984), "Signal versus Noise in the Southern Oscillation" Monthly Weather Review 112:326- 332 Trenberth, K.E. and T.J. Hoar (1996): "The 1990-1995 El Nino-Southern Oscillation Event Longest on Record", Geophysical Research Letters 23:57-60 Ropelewski, C.F., and P.D. Jones (1987): "An Extension of the Tahiti-Darwin Southern Oscillation Index", Monthly Weather Review" 115:2161-2165 http://www.cgd.ucar.edu/cas/catalog/climind/soi.html
. However, Trenberth notes that better signal-to-noise ratios may be obtained by using normalization factors based upon annual means. To view figures and to download data derived using this approach, click here.here Relevant publications: Trenberth (1984), Signal versus Noise in the Southern Oscillation Monthly Weather Review 112: Trenberth, K.E. and T.J. Hoar (1996): The El Nino-Southern Oscillation Event Longest on Record , Geophysical Research Letters 23:57-60 Ropelewski, C.F., and P.D. Jones (1987): An Extension of the Tahiti-Darwin Southern Oscillation Index , Monthly Weather Review 115:")
23
Darwin >Tahiti Darwin <Tahiti

28
La Niña El Niño

29
La Niña El Niño

Presentaciones similares