Descargar la presentación
La descarga está en progreso. Por favor, espere

1
Centro Internacional para la Investigación del Fenómeno de El Niño I FORO DE PERSPECTIVAS CLIMÁTICAS PARA SUDAMÉRICA Guayaquil - Ecuador, 01 al 04 de Octubre 2012 Seminario - Taller Clima de Sud América Cambio Climático en SA: Observaciones y Proyecciones Relator: Dr. René D. Garreaud www.dgf.uchile.cl/rene Departamento de Geofísica Universidad de Chile

5
Is the regional cooling of the Humboldt EBUS already taking place? Over the Pacifc SST trend looks very similar to the PDV patter 2006-1979 Falvey & Garreaud 2007

6
Is the regional cooling of the Humboldt EBUS already taking place? offshore coast inland West Andes East Andes Falvey & Garreaud 2007

7
Trends in°C/décade (1984 – 2010), from Reynolds data base (1/4° resolution) (Gutiérrez et al., RPGA, subm.) Callao Pisco San Juan Ilo Gutiérrez, Bouloubassi, et al., GRL, to be submitted
, from Reynolds data base (1/4° resolution) (Gutiérrez et al., RPGA, subm.) Callao Pisco San Juan Ilo Gutiérrez, Bouloubassi, et al., GRL, to be submitted")
8
Is the regional cooling of the Humboldt EBUS already taking place? Temperature trends 1979-2006 Falvey & Garreaud 2007

9
How are the models doing? Not good but no so bad.. T/ t off Central Chile T/ t central Andes

10
Multimodel mean Regional warming 1970-2000 (SST*). Also shown in contours SLP* trend Global mean: +0.2º/dec

14
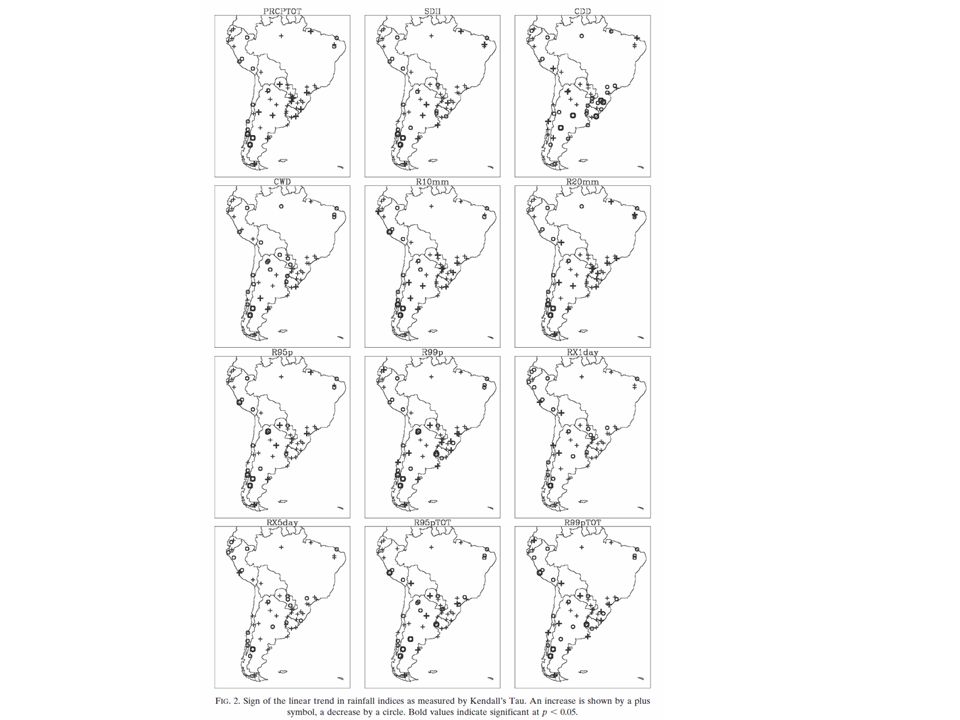
Ref.: Quintana, 2004 Semiarid climate MAP 30-500 mm (IA)/MAP 0.3 – 0.5 Strong ENSO Impact No significant trend Precipitation Changes….warming, drying south Rainy climate MAP 1000-3000 mm (IA)/MAP 0.1 Weak ENSO Impact Significant drying trend
/MAP 0.3 – 0.5 Strong ENSO Impact No significant trend Precipitation Changes….warming, drying south Rainy climate MAP mm (IA)/MAP 0.1 Weak ENSO Impact Significant drying trend")
15
Central Chile (30-35ºS) Southern Chile (38º-41ºS) Year Normalized rainfall Evolución de las Precipitaciones
 Southern Chile (38º-41ºS) Year Normalized rainfall Evolución de las Precipitaciones")
16
Tendencias observadas de precipitación: ¿?

17
Retro-alimentación del sistema climático cambian la respuesta al incremento del CO 2 Ruddiman: Earth’s Climate, Chapter 4 Parte “facil” Calculo radiativo…

18
Future Climate Scenarios GHG (CO2,…) emissions projections + GCMs 20+ GCMs CMIP3/IPCC AR4
 emissions projections + GCMs 20+ GCMs CMIP3/IPCC AR4")
19
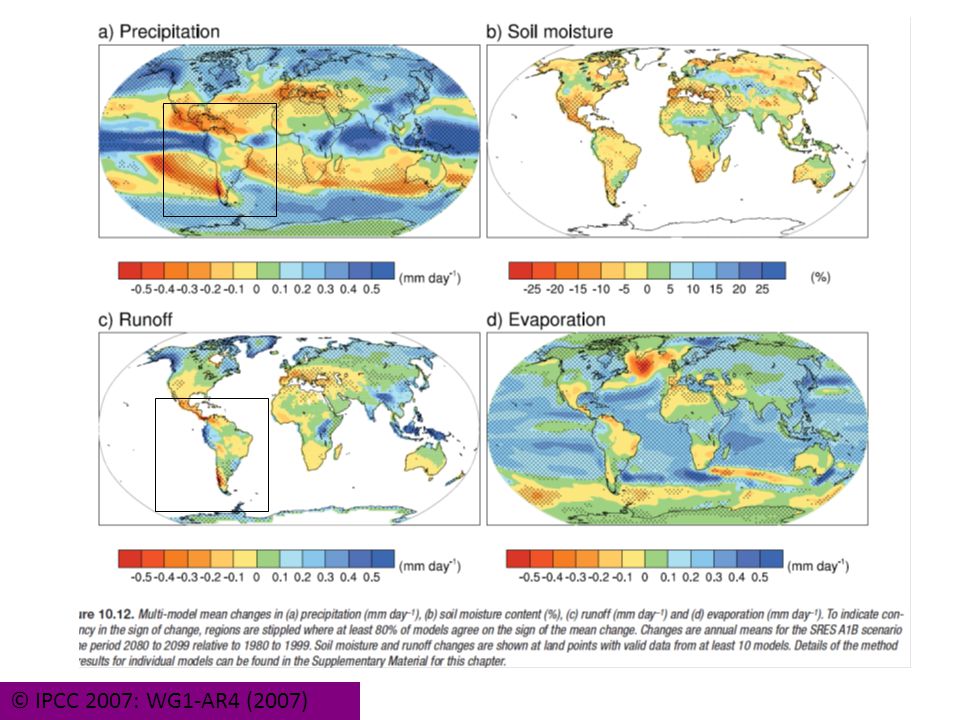
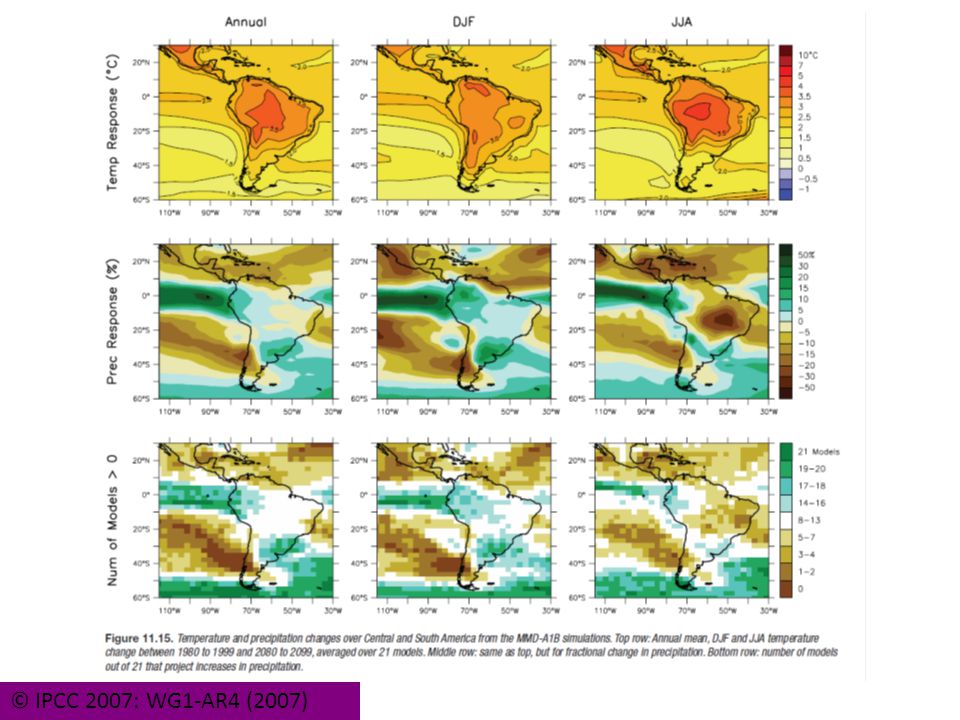
© IPCC 2007: WG1-AR4 (2007)
")
22
Zonal mean distribution of temperature change (2xC02-Ctr) © IPCC 2007: WG1-AR4 (2007)
 © IPCC 2007: WG1-AR4 (2007)")
23
Multimodel average SLP difference between A2 (2070-2100) and BL (1970-2000) Strengthening of the poleward flank of subtropical anticyclones and poleward shift of the midlatitude storm track is very consistent among GCMs Annual mean Garreaud & Falvey 2007
 and BL ( ) Strengthening of the poleward flank of subtropical anticyclones and poleward shift of the midlatitude storm track is very consistent among GCMs Annual mean Garreaud & Falvey 2007")
24
Multimodel average SLP and sfc wind difference betweenA2 (2070-2100) and BL (1970-2000) Over open ocean v in geostrophic balance with SLP. Near the coast v more controlled by along-coast SLP Annual mean Garreaud & Falvey 2007

25
2 month extended upwelling season (earlier onset, later demise) Stronger southerlies PRECIS Results Garreaud & Falvey 2007 Las Cruces Lavapie
 Stronger southerlies PRECIS Results Garreaud & Falvey 2007 Las Cruces Lavapie")
26
QuikScat data (2000-2006) PRECIS BL (1961-1990) PRECIS A2 (2071-2100) Frequency of surface meridional wind speed at 33°S 74°W PRECIS Results Garreaud & Falvey 2007 More frequent / extended episodes of strong southerlies Less downwelling favourable wind
 PRECIS BL ( ) PRECIS A2 ( ) Frequency of surface meridional wind speed at 33°S 74°W PRECIS Results Garreaud & Falvey 2007 More frequent / extended episodes of strong southerlies Less downwelling favourable wind")
27
PRECIS Results

28
-1° 0° 1° 2° 3° 4° 5° C Differences A2(2100-2070) – BL(1960-1990) Obtained with a regional climate model (PRECIS) forced by HadCM3 / A2 -50 0 +50 mm/mes Temperatura Superficial (SAT) Precipitación (P) PRECIS-DGF-UCH
 – BL( ) Obtained with a regional climate model (PRECIS) forced by HadCM3 / A mm/mes Temperatura Superficial (SAT) Precipitación (P) PRECIS-DGF-UCH")
29
Urrutia and Vuille 2009 Diferencia T 2m (2100-2070) – (1960-1990) Obtained with a regional climate model (PRECIS) forced by Echam4 / A2 B2-LBA2-LB
 – ( ) Obtained with a regional climate model (PRECIS) forced by Echam4 / A2 B2-LBA2-LB")
30
Diferencia Pp A2(2100-2070) – BL(1960-1990) Obtained with a regional climate model (PRECIS) forced by Echam4 / A2 dP (mm/año) dP/Pbl (%) Urrutia and Vuille 2009
 – BL( ) Obtained with a regional climate model (PRECIS) forced by Echam4 / A2 dP (mm/año) dP/Pbl (%) Urrutia and Vuille 2009")
31
Multimodel mean diff. A2-BL in 200 hPa wind, summer Multimodel mean diff. A2-BL in zonal wind along 70°W summer Cambios de Circulación A2- BL Minvielle and Garreaud 2010

32
Cambios de Precipitación esperables por cambio de viento Minvielle and Garreaud 2010 dP (mm) dP/Pbl (%)
 dP/Pbl (%)")
Presentaciones similares


¿Qué tiempo hace? What is the weather like? 2)Hace (Hay) sol. It’s sunny. 3)Hace (mucho) calor. It’s (very) hot. 4)Hace.>")


-DCAO /FCEN UMI IFAECI /CNRS Buenos Aires Reunión CIMA-IANIGLIA 23 de noviembre 2011.>")


 White Spot Disease (WSD) Actualización del diagnóstico ambiental Octubre 2010.>")

 AL AR5 (2014)>")