Descargar la presentación
La descarga está en progreso. Por favor, espere

1
OMSAN LOJİSTİK

3
Strategic Decisions: Buy or Make Procurement and Supplier Relationship Management Latin America Logistics Center Logistics Management Series

4
Strategic Decisiions of “Buy or Make” Make? Manufacturing Competitive Advantage Intellectual Property Lack of Finished Goods Suppliers Available Infrastructure Buy? Strategic Alliances with Suppliers Competitive Advantage in Marketing and Sales Free Technologies Products Poor Availability of Infrastructure

5
Make vs. Buy Define: Q= Number of Units Needed F H = Fixed Cost to Make V H = Variable Cost to Make F C = Fixed Cost to Buy V C = Variable Cost to Buy Break-Even is when F M + (V M x Q) = F B + (V B x Q) Q = ( F M – F B ) / ( V B – V M )
 = F B + (V B x Q) Q = ( F M – F B ) / ( V B – V M ).")
6
Make vs. Buy Units per Year (Q) Total Cost to Make Total Cost to Buy Break-even Quantity FMFM FBFB Total Cost (dollars)
 Total Cost to Make Total Cost to Buy Break-even Quantity FMFM FBFB Total Cost (dollars).")
7
Cost-Volume-Benefit For an expected Benefit, the Break-Even is adjusted as follows: TS = UP x Q TS = Total Sales UP = Unit Sales Price Q = Quantity (Bought or Manufactured) TC = FC + VC x Q TC = Total Cost FC = Fixed Cost VC = Variable Cost Q = Quantity Benefit Equations is then: TB = TS - TC Replacing and solving, the optimal quantity to buy or manufacture is Q = ( TB + FC ) / ( UP – VC )
 TC = FC + VC x Q TC = Total Cost FC = Fixed Cost VC = Variable Cost Q = Quantity Benefit Equations is then: TB = TS - TC Replacing and solving, the optimal quantity to buy or manufacture is Q = ( TB + FC ) / ( UP – VC )")
8
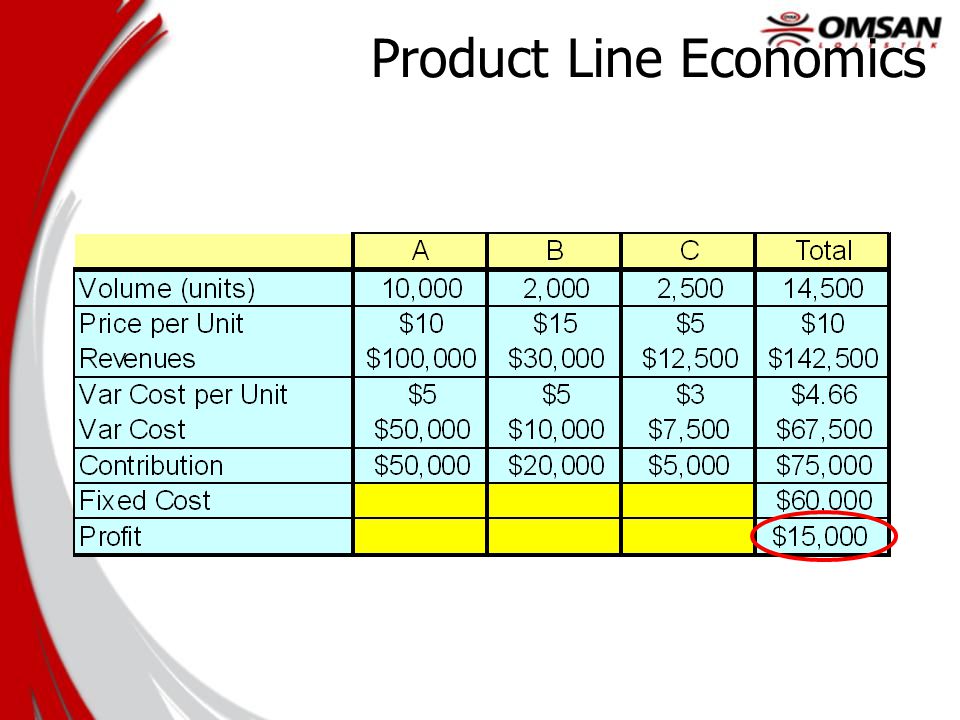
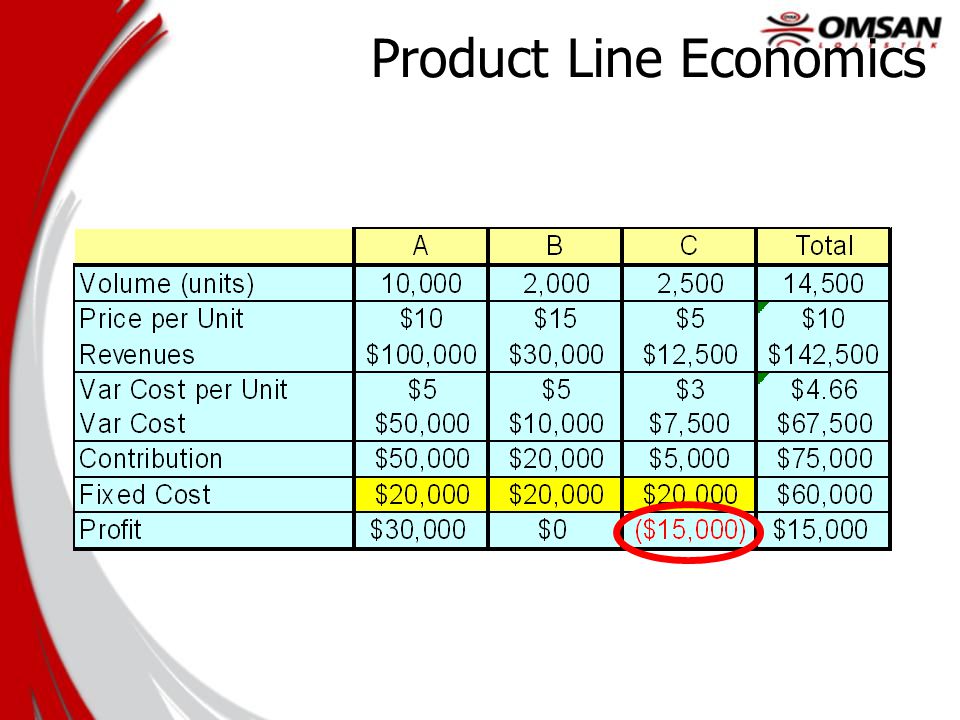
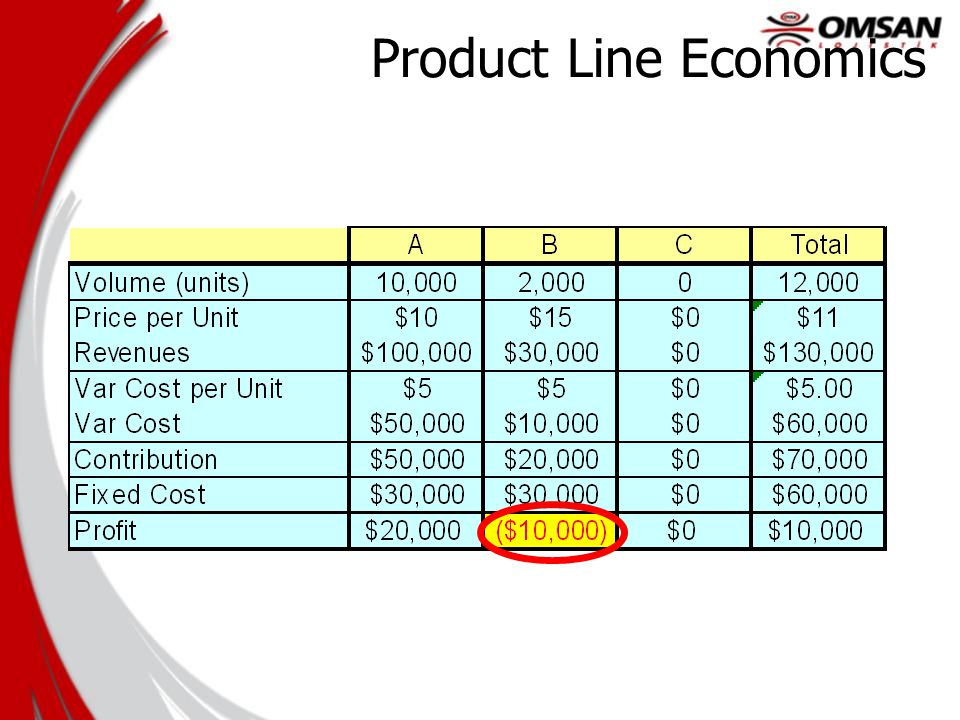
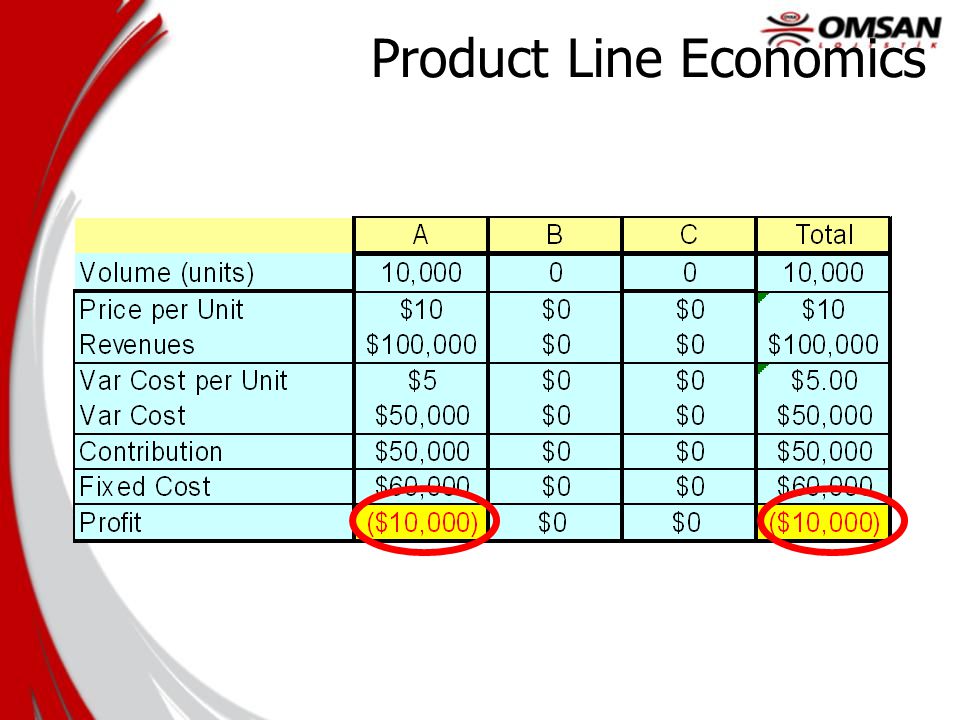
Product Line Economics

13
Price is Only a Small Fraction of the Total Supply Cost Total Supply Cost Price Item price Terms Tiers Rebates Inventory Carrying cost Cost of capital Shrinkage Logistics Transportation Delivery Warehousing + Other Data mgmt Contract admin Staff & overhead Utilization Customer preference High-value commodities Low-value commodities = +++ There are Several elements that impact the Total Supply Cost beyond the Unit Cost!

14
Uncovering Potential Savings AcquisitionReceptionPossessionUtilization Elimination $$ in CASH $$ Not CASH Supplier Level $$ in CASH $$ Not CASH Order Level $$ in CASH $$ Not CASH Unit Level

15
AcquisitionReceptionPossessionUtilization Elimination $$ in CASH l Descuento total sobre la compra $$ Not CASH l Costos de inspección l Costos de generar RFP l Costo de Administración del contrato l Costo de seguimiento y feed-back l Costo de cambiar de Proveedor l Costos legales por rompimiento de contrato l Costos de ingeniería l Costos de entrenamie nto de personal l Costo de Adaptación de los sistemas Supplier Level Uncovering Potential Savings

16
AcquisitionReceptionPossessionUtilization Elimination $$ in Cash l Retraso en el pago (costo- ahorro) l Costos externos de Transporte $$ Not CASH l Costos de ordenar l Costos de recibo l Costo de procesamient o de la factura y del pago l Costo de verificar la cantidad l Costo de verificar la calidad l Costos legales pro problemas de calidad l Costos Internos de Transporte l Costos de control de calidad l Costos de retraso en producción l Costos de recolección de desperdicio Order Level Uncovering Potential Savings …
 l Costos externos de Transporte $$ Not CASH l Costos de ordenar l Costos de recibo l Costo de procesamient o de la factura y del pago l Costo de verificar la cantidad l Costo de verificar la calidad l Costos legales pro problemas de calidad l Costos Internos de Transporte l Costos de control de calidad l Costos de retraso en producción l Costos de recolección de desperdicio Order Level Uncovering Potential Savings …")
17
AcquisitionReceptionPossessionUtilizationElimination $$ in CASH l Precio l Descuentos l Eficiencia intrínseca l Costo de reposición l Costo de reciclaje l Costo de eliminación $$ Not CASH l Costos de instalación y ensamblaje l Costo de prueba del producto l Costo de mantener inventario l Costos de preparar la orden l Costos de falla en producción l Costos de falla en el producto l Costo de mantenimient o l Costo de instalación l Costo de remover materiales obsoletos l Costo de gerenciar la función de eliminación Unit Level Uncovering Potential Savings …

18
In the Intersection between Demand and Supply ‘Focus on the Buyer” Distributor Supplier Distributor Network Hospitality OCG Hospital Doctor Clinic Internet or VPN

19
Comprehensive Data Analysis to Generate 3-Axes Reports: – WHO:Cost Centers / Departments / Facilities – WHAT:Expense Categories / commodities – FROM WHOM:Suppliers / Sellers Broadlane: Buying Expenses Analysis “Who buys What From Whom?” X = WHO Y = WHAT Z = FROM WHOM Expense Analysis helps to determine savings opportunities for future contracts with immediately returns Detailed Analysis of the Procurement Process

20
75% 25% 54% 46% Used Tactics Better Forecast Use Evaluation Education Campaigns Substitution by Generics Point of Use Delivery Waste and Spillage Reduction Supplier Certification Less Suppliers Less SKUs Volume Compromises Group buys Price Benchmarking 40% 60% Used Tactics Just-in-time inventory Consignation Electronic funds transferences 95% 5% Opportunity of Procurement Costs Savings In Hospitals, Produrement Savings might be noticeable. For instance, 5% savings in procurement equals 9% personnel reduction... without firing anybody! Procurement Strategies 95% of procurement savings come from cost reductions, not better inventory or distribution Most Savings come from better Utilization, not from better Prices Less Expensive Substitutes $2.61 M Less Expensive Substitutes $2.61 M Waste Elimination $0.87 M Waste Elimination $0.87 M Standardi- zation $1.25 M Standardi- zation $1.25 M Better Negotiation $1.07 M Better Negotiation $1.07 M Reduction in Utilization $3.48 M Reduction in Utilization $3.48 M Price Reduction $2.32 M Price Reduction $2.32 M Total Savings Oppotunities $6.10 M Total Savings Oppotunities $6.10 M Supply Cost Reduction $5.80 M Supply Cost Reduction $5.80 M Better Logistics $0.30 M Better Logistics $0.30 M

21
Contract Analysis: Overpayments Report

22
Price Parity Analysis Product 210112 – Stryker Handpiece Inter-Pulse Data shows five different prices paid Paid Price Use/monthTotal SalesOpportunity $186.0057$11,344- $202.7487$17,638$1,456 $292.0018$5,256$1,908 $426.405$1,461$1,202 $447.2018$7,987$4,701 Opportunity Total = $9,267

23
Broadlane Average Time= 112 días Previous Processing Time = 392 days 71% Reduction Contract Processing Time

Presentaciones similares


. You went to the mall.>")
