Descargar la presentación
La descarga está en progreso. Por favor, espere

1
Deriva y tamaño efectivo

2
Deriva Genética Fisher-Wright Programa de simulación Generaciones http://www.handsongenetics.com/

3
Paso 1: registrar

4
Paso 2: ingresar los parámetros Haploides, 20 indiv, 2 alelos

6
Paso 3: ingresar los parámetros Haploides, 20 indiv, alelos múltiples

8
Paso 4: ingresar los parámetros Diploides, 20 indiv, alelos múltiples

10
Deriva Genética Programa de simulación ftp://evolution.genetics.washington.edu/pub/popgen/popg.html

11
Paso 1: ingresar los parámetros Diploides, 20 indiv, 2 alelos

12
Ejemplo de resultados

13
Paso 2: efecto del tamaño poblacional Diploides, 100 indiv, 2 alelos, p = 0.5 ?

14
Paso 3: efecto de la frecuencia inicial Diploides, 100 indiv, 2 alelos, p = 0.9 ? Diploides, 100 indiv, 2 alelos, p = 0.5 Diploides, 100 indiv, 2 alelos, p = 0.1

15
Paso 4: efecto de la mutación

16
Concepto de tamaño efectivo (en base al modelo de WF) que presentaría la misma diversidad genética que la observada El tamaño efectivo de una población real es el número de individuos de una población ideal teórica que presentaría la misma diversidad genética que la observada Población ideal teórica: - Misma probabilidad de dejar descendencia - Tamaño poblacional constante N H Ne ?
 que presentaría la misma diversidad genética que la observada El tamaño efectivo de una población real es el número de individuos de una población ideal teórica que presentaría la misma diversidad genética que la observada Población ideal teórica: - Misma probabilidad de dejar descendencia - Tamaño poblacional constante N H Ne")
17
1. Efecto de un cuello de botella sobre el tamaño efectivo N = Tamaño poblacional Tiempo

18
Ne = N Ne > N Ne < N N = Tamaño poblacional Tiempo Ne

19
Heq = Ho N = Tamaño poblacional Tiempo Ho > Heq Ho < Heq Ho

20
N : alto H : alto Ne : alto N : bajo H : alto Ne : alto

21
N : bajo H : alto Ne : alto N : bajo H : mediano Ne : mediano N : bajo H : bajo Ne : bajo

22
N : bajo H : bajo Ne : bajo N : alto H : bajo Ne : bajo

23
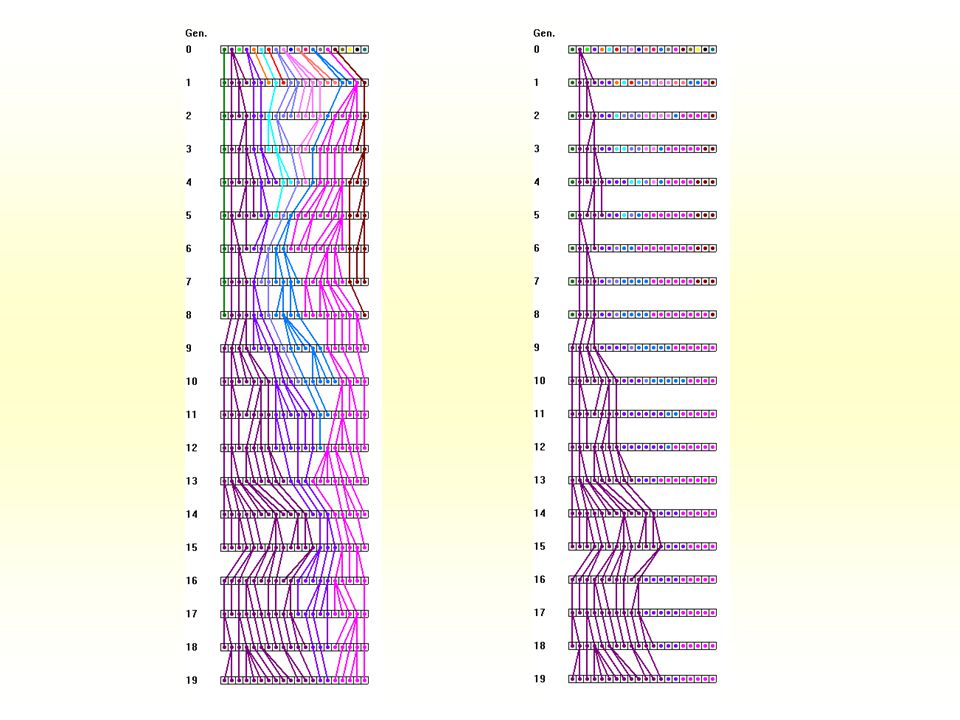
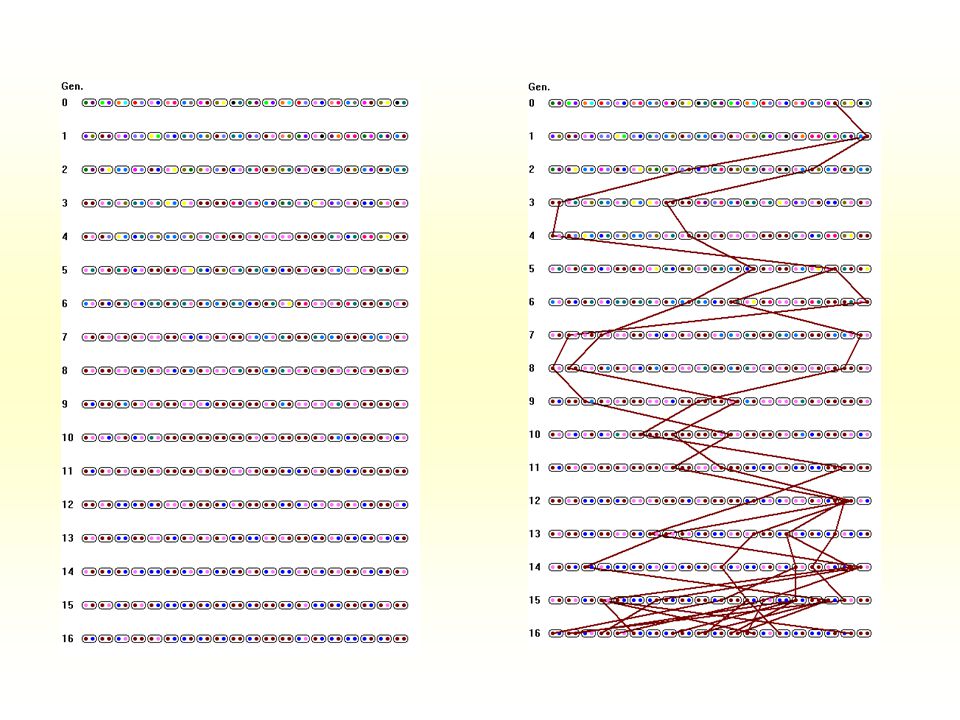
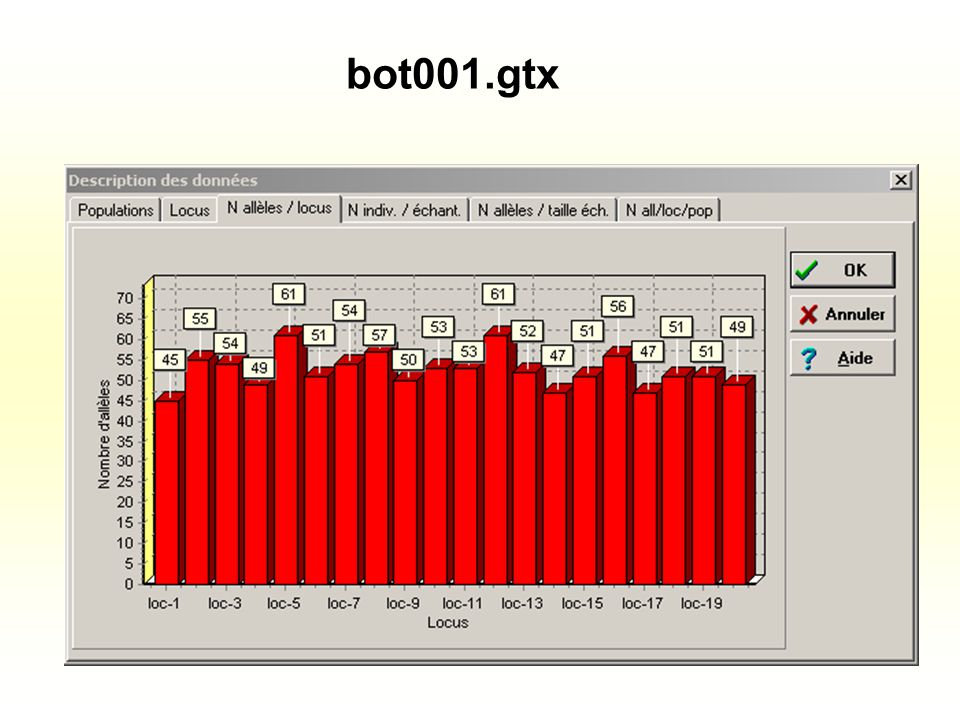
-------------------------------------------------------------------------------- EASYPOP (v. 1.8) Autor: F. Balloux Disponible en: http://www.unil.ch/izea/softwares/easypop.html -------------------------------------------------------------------------------- Ploidy level = diploid Two sexes Mating system = Random mating Number of populations = 1 Number of females in each population = 5000 Number of males in each population = 5000 Number of loci = 10 Free recombination between loci Same mutation scheme for all loci Mutation rate = 0.001 Mutation model = Kam,(same probability to mutate to any allelic state) Number of possible allelic states = 100 Variability of the initial population = Maximal, (randomly assigned alleles) Number of generations = 10000 Creación de una población artificial al equilibrio de Wright-Fisher => Genotipos de 10 000 individuos => Sorteo de 100 individuos
 Autor: F. Balloux Disponible en: Ploidy level = diploid Two sexes Mating system = Random mating Number of populations = 1 Number of females in each population = 5000 Number of males in each population = 5000 Number of loci = 10 Free recombination between loci Same mutation scheme for all loci Mutation rate = Mutation model = Kam,(same probability to mutate to any allelic state) Number of possible allelic states = 100 Variability of the initial population = Maximal, (randomly assigned alleles) Number of generations = Creación de una población artificial al equilibrio de Wright-Fisher => Genotipos de individuos => Sorteo de 100 individuos.")
24
N = Tamaño poblacional Tiempo 10.000 100 Prebot.txt bot001.txt bot100.txt Estimación de Ne después del cuello de botella (1-5-100 generaciones) bot005.txt
 bot005.txt")
25
N = Tamaño poblacional Tiempo 10.000 100 Prebot.txt Estimación de Ne antes del cuello de botella

27
1 2 3 4

30
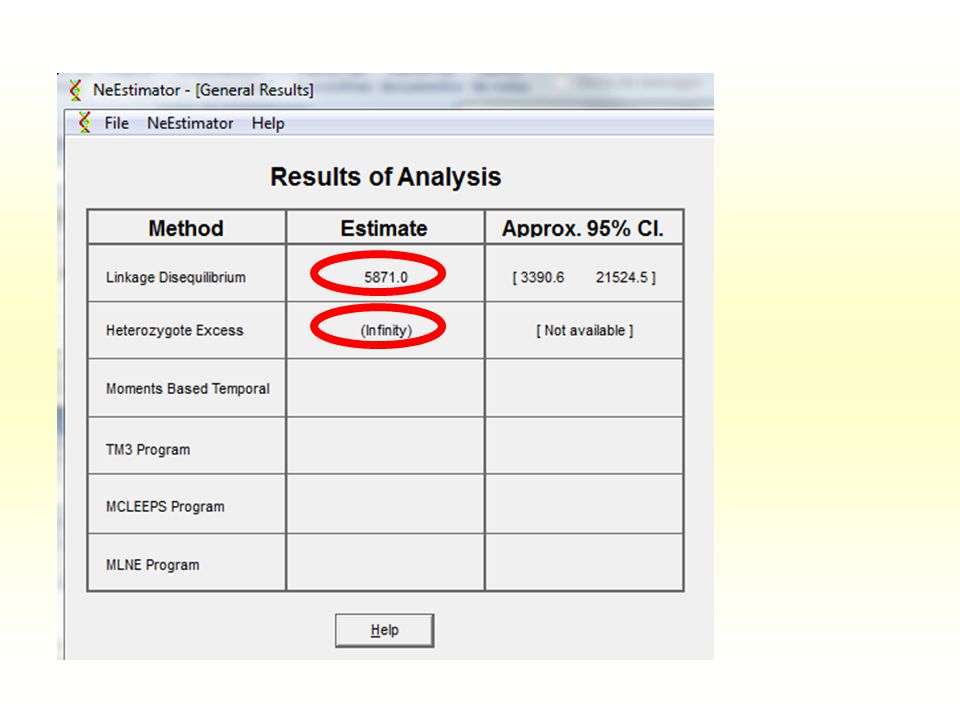
MuestraNe (He)Ne (LD) prebot ∞5871 bot001 bot005 bot100
Ne (LD) prebot ∞5871 bot001 bot005 bot100")
31
N = Tamaño poblacional Tiempo 10.000 100 Prebot.txt bot001.txt Estimación de Ne antes del cuello de botella (primera generación)
")
33
MuestraNe (He)Ne (LD) prebot ∞5871 bot001 ∞2593 bot005 bot100
Ne (LD) prebot ∞5871 bot001 ∞2593 bot005 bot100")
34
N = Tamaño poblacional Tiempo 10.000 100 Prebot.txt bot001.txt Estimación de Ne después del cuello de botella (primera generación)
")
35
Repetir pasos 2 a 5 para: - bot005 - bot100

36
N = Tamaño poblacional Tiempo 10.000 100 Prebot.txt bot001.txt Estimación de Ne después del cuello de botella bot100.txt bot005.txt

37
MuestraNe (He)Ne (LD) prebot ∞5871 bot001 ∞2593 bot005 320156 bot100 17118
Ne (LD) prebot ∞5871 bot001 ∞2593 bot bot")
38
N = Tamaño poblacional Tiempo 10.000 100 Prebot.txt Estimación de Ne después del cuello de botella (primera generación) bot001.txt bot100.txt bot005.txt
 bot001.txt bot100.txt bot005.txt")
39
N = Tamaño poblacional Tiempo 10.000 100 Prebot.txt Estimación de Ne después del cuello de botella bot001.txt bot100.txt bot005.txt Ne

40
Estimación de Ne después del cuello de botella (1-100-500 generaciones) N = Tamaño poblacional Tiempo 10.000 100 Prebot.txt bot001.txt bot100.txt bot005.txt Ne
 N = Tamaño poblacional Tiempo Prebot.txt bot001.txt bot100.txt bot005.txt Ne")
41
Heq = Ho = He N = Tamaño poblacional Tiempo Ho = He > Heq Ho = He < Heq Ho = He 2. Como detectar un cuello de botella ?

42
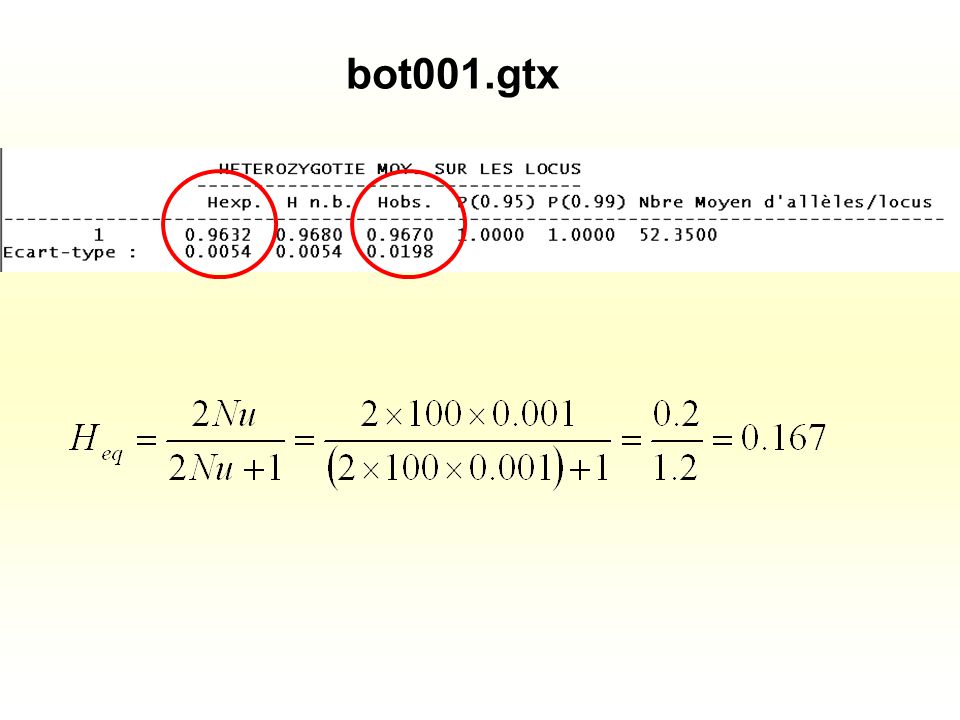
Método: comparar H e con Ĥ eq Ĥ eq es un estimado de H e al equilibrio mutación-deriva, es decir en una población de Wright-Fisher en la cual la perdida de diversidad esta compensada por la mutación Algunas formulas simples para estimar Ĥ eq

43
Populations that have experienced a recent reduction of their effective population size exhibit a correlative reduction of the allele numbers (k) and gene diversity (He, or Hardy-Weinberg heterozygosity) at polymorphic loci. But the allele numbers is reduced faster than the gene diversity. Thus, in a recently bottlenecked population, the observed gene diversity is higher than the expected equilibrium gene diversity (Heq) which is computed from the observed number of alleles (k), under the assumption of a constant-size (equilibrium) population (Luikart et al. 1998).
 which is computed from the observed number of alleles (k), under the assumption of a constant-size (equilibrium) population (Luikart et al. 1998)..")
44
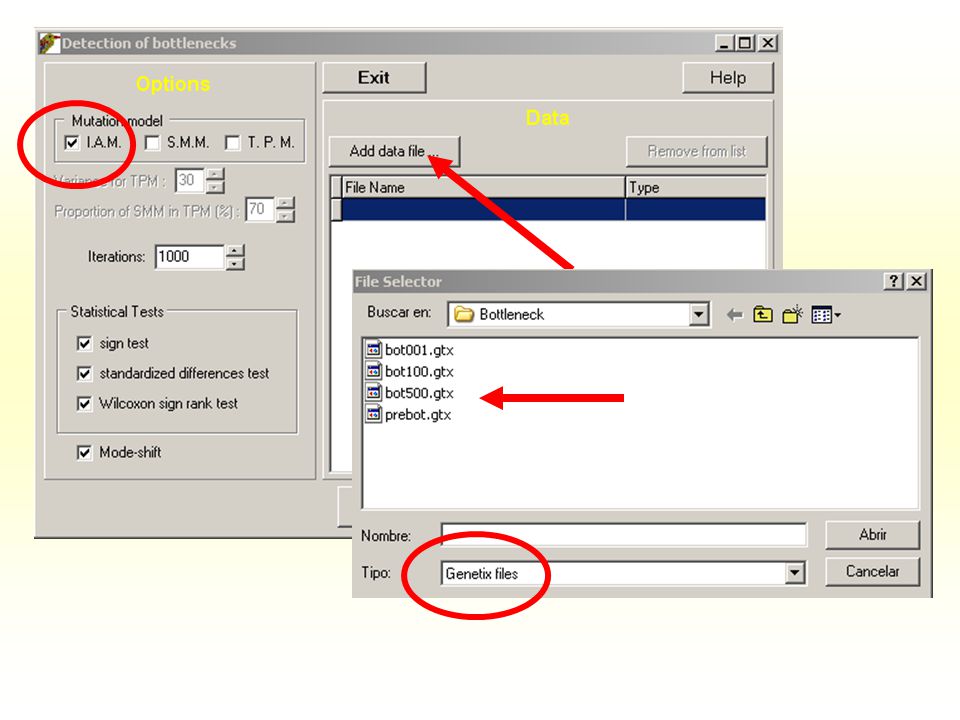
N = Tamaño poblacional Tiempo 10.000 100 Prebot.gtx bot001.gtx bot100.gtx bot500.gtx

45
N = Tamaño poblacional Tiempo 10.000 100 Prebot.gtx bot001.gtx bot100.gtx bot500.gtx

46
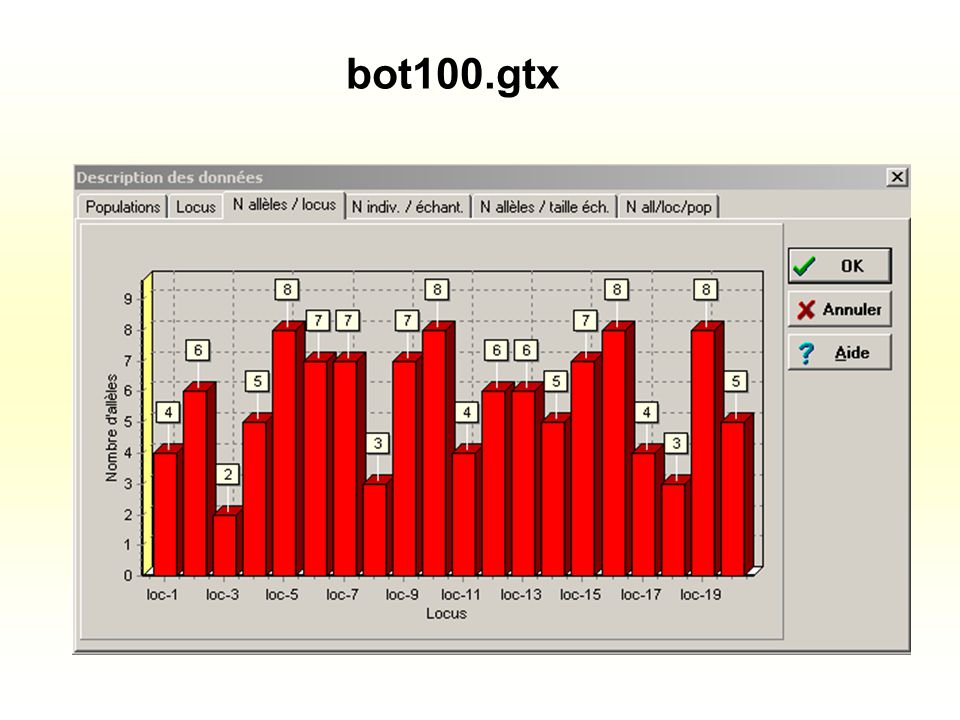
Prebot.gtx

50
Ho = Heq N = Tamaño poblacional Tiempo Ho > Heq Ho < Heq

51
bot001.gtx

55
Heq = Ho N = Tamaño poblacional Tiempo Ho >> Heq Ho < Heq

58
Modelos de mutación http://www.montpellier.inra.fr/URLB/microsat/Estoup2.pdf

62
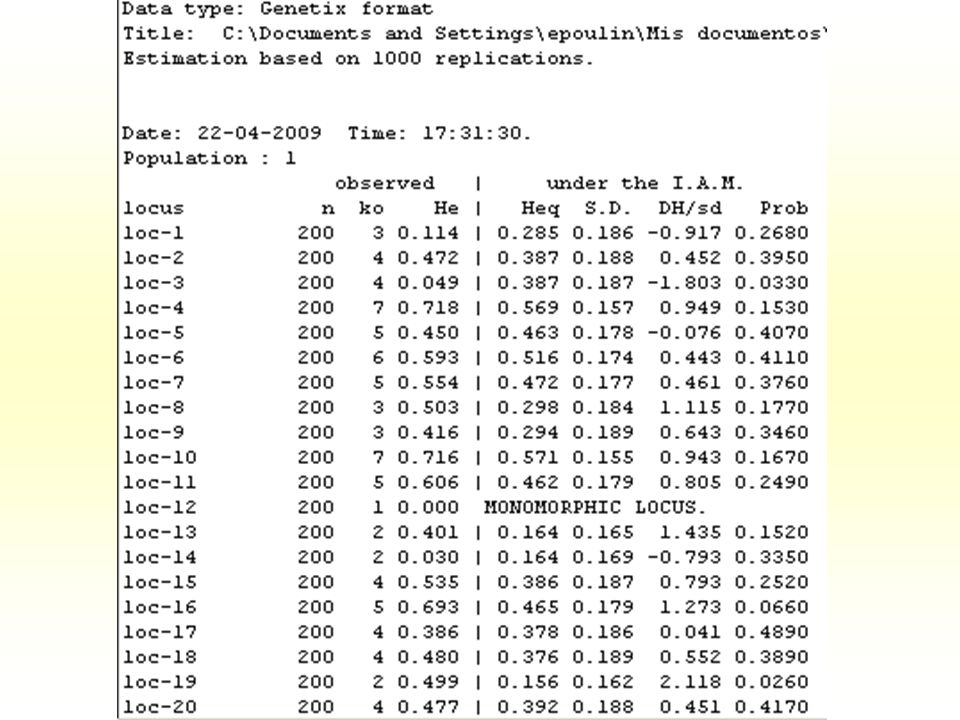
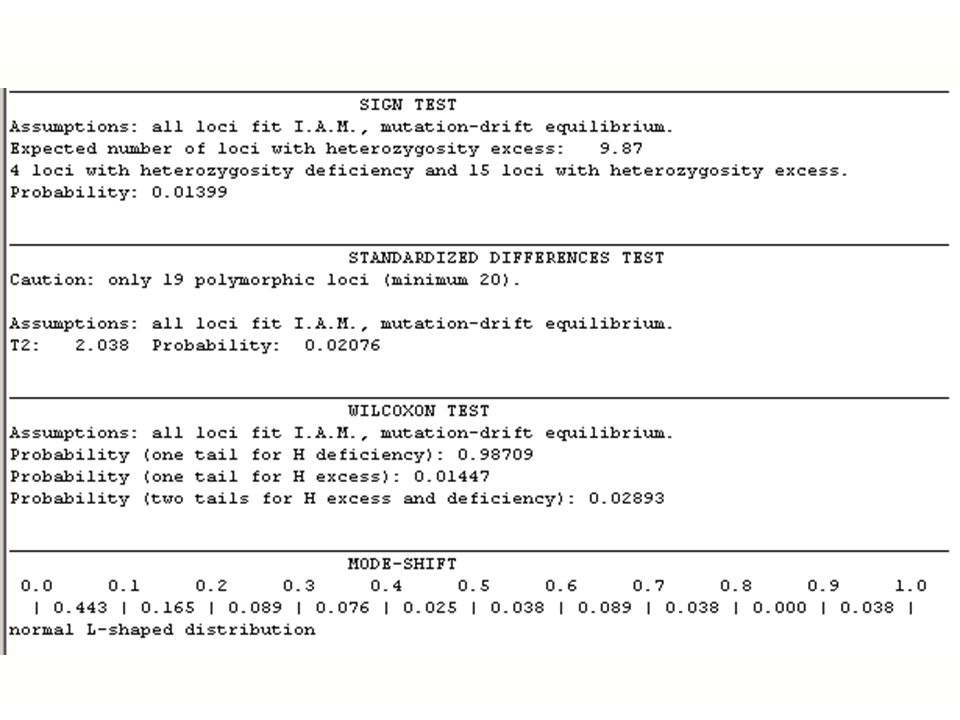
bot100.gtx

66
Heq = Ho N = Tamaño poblacional Tiempo Ho > Heq Ho < Heq

70
bot500.gtx

74
Heq = Ho N = Tamaño poblacional Tiempo Ho > Heq Ho < Heq

78
bot10000.gtx

83
BOTTLENECK version 1.2.02 (16.II.1999) Ejemplo del jurel
 Ejemplo del jurel")
84
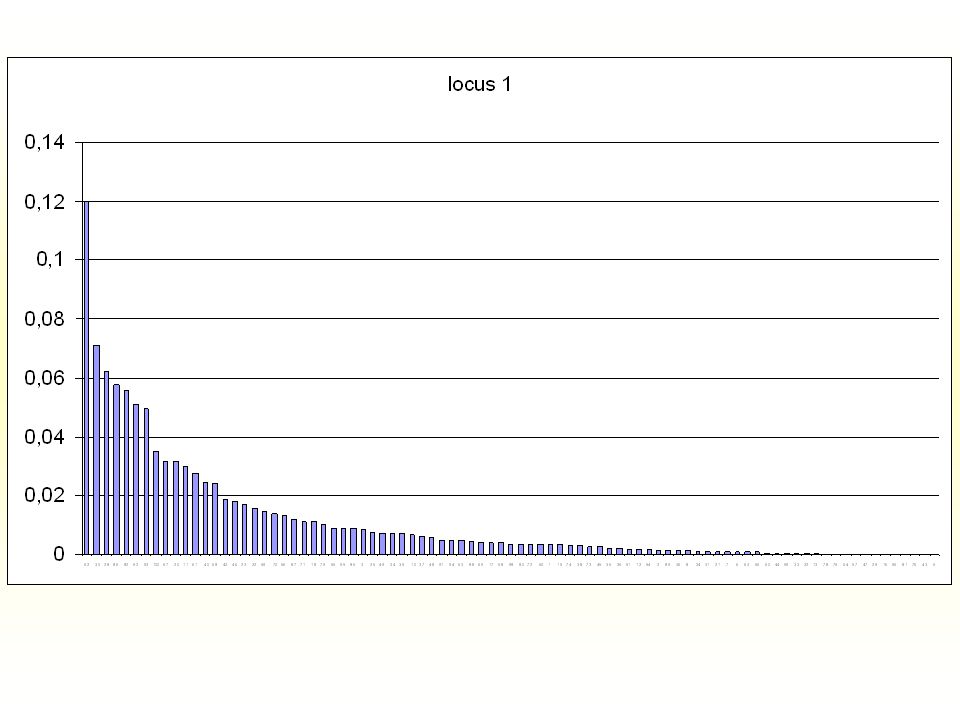
Frecuencias de los alelos microsatélites Tt29

85
Frecuencias de los alelos microsatélites Tt62

86
Frecuencias de los alelos microsatélites Tt74

87
Frecuencias de los alelos microsatélites Tt133

88
Modelos de mutación http://www.montpellier.inra.fr/URLB/microsat/Estoup2.pdf

89
Bottleneck --- Version 1.2.02 (16.II.99) Copyright © 1997-1999, INRA, Laboratoire de Modélisation et Biologie Evolutive, All rights reserved. ======================================================================== File: E:\Genetic Softwares\Genetix-copie\Tt29-1pop.gtx Data type: Genetix format Title: C:\Genetic Softwares\Genetix\Tt29-1pop.gtx Estimation based on 1000 replications. Date: 20/04/2004 Time: 16:46:40. Population : Talcahuano observed | under the I.A.M. | under the S.M.M. locus n ko He | Heq S.D. DH/sd Prob | Heq S.D. DH/sd Prob Tt29 306 14 0.766 | 0.748 0.100 0.181 0.4750 | 0.880 0.024 -4.839 0.0020 ___________________________________________________________________________________ Tt29

90
Tt62 Bottleneck --- Version 1.2.02 (16.II.99) Copyright © 1997-1999, INRA, Laboratoire de Modélisation et Biologie Evolutive, All rights reserved. ============================================================================= File: E:\Genetic Softwares\Genetix-copie\Tt62-1pop.gtx Data type: Genetix format Title: C:\Genetic Softwares\Genetix\Tt62-1pop.gtx Estimation based on 1000 replications. Date: 20/04/2004 Time: 16:52:48. Population : Population1 observed | under the I.A.M. | under the S.M.M. locus n ko He | Heq S.D. DH/sd Prob | Heq S.D. DH/sd Prob Tt62 316 15 0.827 | 0.771 0.083 0.668 0.2720 | 0.888 0.021 -2.866 0.0190 ____________________________________________________________________________________

91
Bottleneck --- Version 1.2.02 (16.II.99) Copyright © 1997-1999, INRA, Laboratoire de Modélisation et Biologie Evolutive, All rights reserved. ==================================================================================== File: E:\Genetic Softwares\Genetix-copie\Tt74-1popnew.gtx Data type: Genetix format Title: C:\Genetic Softwares\Genetix\Tt74-1popnew.gtx Estimation based on 1000 replications. Date: 20/04/2004 Time: 16:59:24. Population : Population1 observed | under the I.A.M. | under the S.M.M. locus n ko He | Heq S.D. DH/sd Prob | Heq S.D. DH/sd Prob Tt74 318 41 0.945 | 0.927 0.022 0.857 0.1770 COMPUTATION ABORTED. Date: 20/04/2004 Time: 17:33:10. Tt74

92
Tt29 Modelo de mutaciónProbabilidad SMM0.002 TPM (99% SMM)0.001 TPM (95% SMM)0.011 TPM (90% SMM)0.027 TPM (70% SMM)0.083 TPM (50% SMM)0.148 IAM0.475 ¿Cuál es el modelo de mutación que más detecta el cuello de botella?
0.001 TPM (95% SMM)0.011 TPM (90% SMM)0.027 TPM (70% SMM)0.083 TPM (50% SMM)0.148 IAM0.475 ¿Cuál es el modelo de mutación que más detecta el cuello de botella")
Presentaciones similares