Descargar la presentación
La descarga está en progreso. Por favor, espere

1
DIRECCIÓN DE OBRAS HIDRÚLICAS, REGIÓN DE COQUIMBO “Proyección Hídrica , Sistemas Corrales y El Bato” SALAMANCA, 03 DE DICIEMBRE DEL 2014

2
Embalses IV Región 7 Embalses en Operación 1 Embalse Primer Llenado
EMBALSE PUCLARO EMBALSE LA LAGUNA 7 Embalses en Operación EMBALSE RECOLETA EMBALSE PALOMA 1 Embalse Primer Llenado EMBALSE COGOTÍ 4 Embalses en Estudio Embalse La Tranca Embalse Murallas Viejas Embalse Valle Hermoso EMBALSE EL BATO Embalse Canelillo EMBALSE CORRALES EMBALSE CULIMO

4
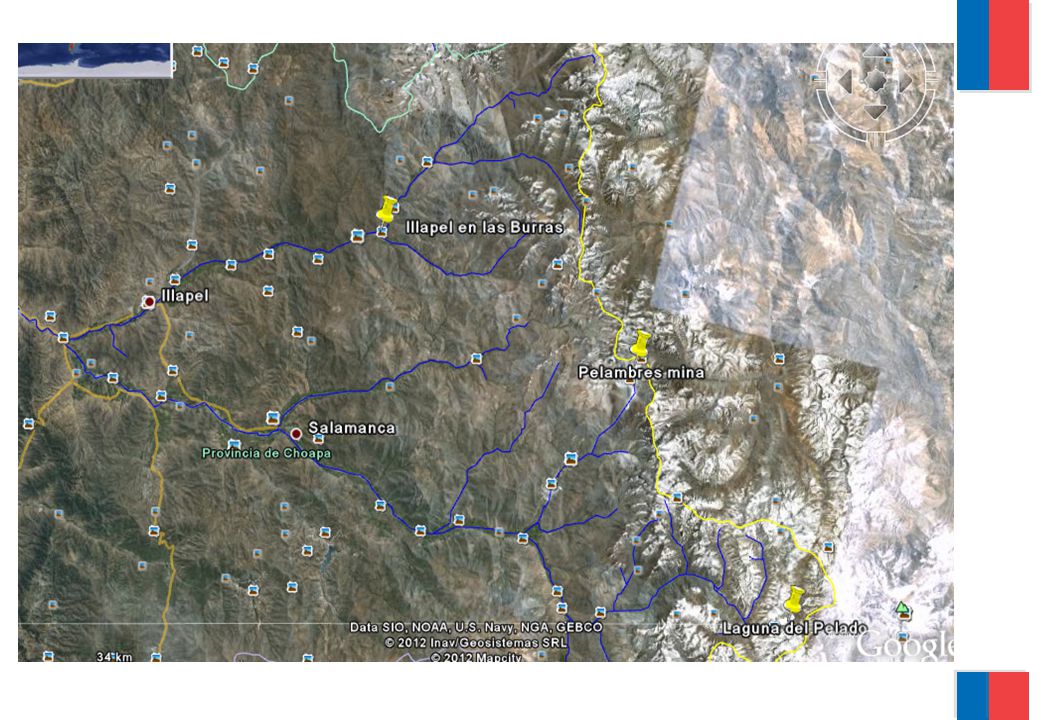
SISTEMA CORRALES Salamanca Poblado de Los Corrales Embalse Corrales
Rio Choapa Estero Quel é n Estero Camisas Estero Durazno Poblado de Los Corrales Villorrio El Array á Bocatoma Coir ó T ú nel Los Maquis 2.905 m. 856 m. El Durazno 3.910 m. Embalse Corrales Capacidad: 50 millones m 3 . Canal Alimentador ( Long .: 15,25 km .) (Capacidad: 3,5 m /s) Entrega N 1 4,1 m /s 2 0,9 m Canal Matriz I Capacidad: 5 m Longitud:16,56 Canal Matriz II Longitud:11,11
 (Capacidad: 3,5 m. /s) Entrega N. 1. 4,1 m. /s. 2. 0,9 m. Canal Matriz I. Capacidad: 5 m. Longitud:16,56. Canal Matriz II. Longitud:11,11.")
5
CAUDALES MEDIOS MENSUALES, PROMEDIOS Y DESV. ESTANDAR
SISTEMA CORRALES CAUDALES MEDIOS MENSUALES, PROMEDIOS Y DESV. ESTANDAR FECHA : 25/11/2014 FUENTE DE ORIGEN Estadistica Oficial Período : 1966 al 2014 Estación : RIO CHOAPA EN CUNCUMEN Código BNA : - 1 Latitud S : 031° 58' 00 UTM Norte : mts Altitud : 1.200 Longitud W : 070° 35' 40 UTM Este : Cuenca : RIO CHOAPA SubCuenca : Rio Choapa Alto (hasta abajo junta Rio Cuncumen) Area de 1.176,00 km2 (m3/Seg.) AÑO ENE FEB MAR ABR MAY JUN JUL AGO SEP OCT NOV DIC ANUAL 1966 22,55 10,78 7,45 5,93 4,94 5,03 6,16 6,22 9,28 17,28 28,03 19,58 11,94 1967 9,78 4,86 4,06 3,63 3,78 3,34 3,24 3,95 7,55 7,31 4,90 5,22 1968 2,93 2,24 2,31 2,14 1,86 1,72 1,51 1,53 2,43 2,30 2,10 1969 1,18 1,05 1,14 1,35 1,61 1,46 1,73 2,84 4,28 9,21 8,20 3,09 1970 2,51 2,37 2,12 2,44 2,47 2,46 3,48 4,31 9,32 12,02 8,75 4,75 1971 4,41 3,20 2,67 2,15 1,93 2,79 3,01 4,11 9,01 11,70 5,73 4,43 1972 3,14 2,29 2,74 3,66 7,07 10,75 76,23 13,54 1973 47,01 16,90 11,76 7,38 10,60 17,81 24,70 12,62 18,60 1974 7,05 6,02 3,37 4,03 4,36 4,39 4,58 13,84 20,96 13,39 1975 7,08 3,71 3,16 2,89 3,13 3,43 4,34 5,80 7,47 12,28 8,59 5,53 1976 4,57 3,40 2,57 1,97 2,17 2,02 1,91 2,20 4,96 13,89 6,83 4,05 1977 3,88 2,99 2,42 4,38 38,95 44,24 11,59 1978 21,12 15,55 10,41 8,69 7,89 6,67 10,99 7,12 9,40 45,68 54,71 18,28 1979 24,01 11,55 7,78 5,98 5,30 3,90 3,69 4,45 9,81 9,79 8,08 8,13 1980 4,42 3,35 2,87 7,70 8,35 6,23 6,04 6,88 8,17 16,31 31,54 34,38 11,35 1981 12,53 7,51 4,72 3,73 4,02 6,29 3,46 5,52 1982 2,78 2,50 2,23 9,73 11,17 14,33 22,25 50,52 75,95 16,81 1983 47,26 21,32 11,31 8,47 6,97 5,94 6,38 7,66 7,68 22,46 41,02 35,52 18,50 1984 10,72 7,02 5,66 5,34 10,62 17,58 45,32 45,89 13,94 1985 32,15 10,63 8,25 6,78 4,70 4,55 4,27 4,12 5,74 8,90 4,65 8,34 1986 3,29 3,05 2,61 5,43 4,73 4,68 6,27 13,18 27,21 30,80 8,91 1987 12,55 7,16 5,62 4,37 4,87 11,21 18,35 17,09 27,15 67,66 82,28 21,92 1988 59,60 26,27 15,37 10,55 8,26 6,30 5,26 7,27 6,73 4,30 13,37 1989 3,44 2,18 3,21 2,85 7,48 19,71 27,42 12,07 7,58 1990 6,42 5,18 4,48 4,07 3,60 7,71 4,33 4,89 1991 2,77 6,20 6,03 12,77 15,99 36,48 30,55 10,64 1992 19,03 9,13 6,46 5,99 6,15 6,72 6,76 10,49 23,39 33,21 20,92 12,94 1993 11,57 7,81 5,37 5,65 8,81 6,41 6,01 12,68 17,36 11,97 9,02 1994 6,51 4,67 3,64 3,04 3,83 8,27 11,93 5,79 1995 5,71 2,88 2,66 2,63 2,48 3,72 4,76 5,89 3,57 1996 2,41 2,28 2,27 1,79 1,78 2,09 2,22 3,26 1997 1,47 1,36 1,38 6,49 4,69 11,08 18,01 22,34 51,41 76,11 16,43 1998 53,93 19,23 6,60 9,00 6,50 5,13 4,13 4,63 3,58 10,34 1999 2,76 2,54 2,38 2,52 14,91 17,63 7,56 5,48 2000 3,27 3,12 2,72 3,22 5,40 25,26 32,01 27,49 10,20 2001 10,53 5,68 4,25 4,20 3,76 5,25 8,31 10,92 24,72 34,21 24,19 11,71 2002 9,30 6,62 5,46 5,31 8,10 8,61 14,90 16,22 31,16 57,10 52,46 18,34 2003 28,08 8,60 6,70 6,52 6,93 6,77 7,76 7,90 19,64 10,12 11,79 2004 5,19 4,47 3,87 3,65 3,55 6,85 7,40 9,10 6,36 5,50 2005 4,04 6,12 5,77 6,81 11,46 26,05 53,08 46,32 14,43 2006 20,19 10,29 7,06 5,02 5,24 9,11 22,73 34,36 19,36 12,72 2007 9,45 6,37 5,17 4,26 4,81 6,59 15,50 16,05 8,58 7,44 2008 5,28 3,80 3,39 4,19 4,46 8,64 22,32 42,11 18,14 10,52 2009 8,30 5,90 4,93 3,99 4,24 6,68 14,07 23,21 13,68 2010 6,47 4,15 3,91 3,61 3,10 3,49 4,59 6,17 4,08 2011 3,07 2,39 2,33 10,30 11,10 4,22 2012 2,32 3,97 5,47 2,96 2013 2,05 1,82 1,77 3,17 4,91 3,38 2014 2,49 2,00 2,03 2,13 2,25 2,82 2,64 PROM. 12,44 4,10 3,94 5,56 7,33 13,53 22,76 21,09
 Area de ,00. km2. (m3/Seg.) AÑO. ENE. FEB. MAR. ABR. MAY. JUN. JUL. AGO. SEP. OCT. NOV. DIC. ANUAL ,55. 10,78. 7,45. 5,93. 4,94. 5,03. 6,16. 6,22. 9,28. 17,28. 28,03. 19,58. 11, ,78. 4,86. 4,06. 3,63. 3,78. 3,34. 3,24. 3,95. 7,55. 7,31. 4,90. 5, ,93. 2,24. 2,31. 2,14. 1,86. 1,72. 1,51. 1,53. 2,43. 2,30. 2, ,18. 1,05. 1,14. 1,35. 1,61. 1,46. 1,73. 2,84. 4,28. 9,21. 8,20. 3, ,51. 2,37. 2,12. 2,44. 2,47. 2,46. 3,48. 4,31. 9,32. 12,02. 8,75. 4, ,41. 3,20. 2,67. 2,15. 1,93. 2,79. 3,01. 4,11. 9,01. 11,70. 5,73. 4, ,14. 2,29. 2,74. 3,66. 7,07. 10,75. 76,23. 13, ,01. 16,90. 11,76. 7,38. 10,60. 17,81. 24,70. 12,62. 18, ,05. 6,02. 3,37. 4,03. 4,36. 4,39. 4,58. 13,84. 20,96. 13, ,08. 3,71. 3,16. 2,89. 3,13. 3,43. 4,34. 5,80. 7,47. 12,28. 8,59. 5, ,57. 3,40. 2,57. 1,97. 2,17. 2,02. 1,91. 2,20. 4,96. 13,89. 6,83. 4, ,88. 2,99. 2,42. 4,38. 38,95. 44,24. 11, ,12. 15,55. 10,41. 8,69. 7,89. 6,67. 10,99. 7,12. 9,40. 45,68. 54,71. 18, ,01. 11,55. 7,78. 5,98. 5,30. 3,90. 3,69. 4,45. 9,81. 9,79. 8,08. 8, ,42. 3,35. 2,87. 7,70. 8,35. 6,23. 6,04. 6,88. 8,17. 16,31. 31,54. 34,38. 11, ,53. 7,51. 4,72. 3,73. 4,02. 6,29. 3,46. 5, ,78. 2,50. 2,23. 9,73. 11,17. 14,33. 22,25. 50,52. 75,95. 16, ,26. 21,32. 11,31. 8,47. 6,97. 5,94. 6,38. 7,66. 7,68. 22,46. 41,02. 35,52. 18, ,72. 7,02. 5,66. 5,34. 10,62. 17,58. 45,32. 45,89. 13, ,15. 10,63. 8,25. 6,78. 4,70. 4,55. 4,27. 4,12. 5,74. 8,90. 4,65. 8, ,29. 3,05. 2,61. 5,43. 4,73. 4,68. 6,27. 13,18. 27,21. 30,80. 8, ,55. 7,16. 5,62. 4,37. 4,87. 11,21. 18,35. 17,09. 27,15. 67,66. 82,28. 21, ,60. 26,27. 15,37. 10,55. 8,26. 6,30. 5,26. 7,27. 6,73. 4,30. 13, ,44. 2,18. 3,21. 2,85. 7,48. 19,71. 27,42. 12,07. 7, ,42. 5,18. 4,48. 4,07. 3,60. 7,71. 4,33. 4, ,77. 6,20. 6,03. 12,77. 15,99. 36,48. 30,55. 10, ,03. 9,13. 6,46. 5,99. 6,15. 6,72. 6,76. 10,49. 23,39. 33,21. 20,92. 12, ,57. 7,81. 5,37. 5,65. 8,81. 6,41. 6,01. 12,68. 17,36. 11,97. 9, ,51. 4,67. 3,64. 3,04. 3,83. 8,27. 11,93. 5, ,71. 2,88. 2,66. 2,63. 2,48. 3,72. 4,76. 5,89. 3, ,41. 2,28. 2,27. 1,79. 1,78. 2,09. 2,22. 3, ,47. 1,36. 1,38. 6,49. 4,69. 11,08. 18,01. 22,34. 51,41. 76,11. 16, ,93. 19,23. 6,60. 9,00. 6,50. 5,13. 4,13. 4,63. 3,58. 10, ,76. 2,54. 2,38. 2,52. 14,91. 17,63. 7,56. 5, ,27. 3,12. 2,72. 3,22. 5,40. 25,26. 32,01. 27,49. 10, ,53. 5,68. 4,25. 4,20. 3,76. 5,25. 8,31. 10,92. 24,72. 34,21. 24,19. 11, ,30. 6,62. 5,46. 5,31. 8,10. 8,61. 14,90. 16,22. 31,16. 57,10. 52,46. 18, ,08. 8,60. 6,70. 6,52. 6,93. 6,77. 7,76. 7,90. 19,64. 10,12. 11, ,19. 4,47. 3,87. 3,65. 3,55. 6,85. 7,40. 9,10. 6,36. 5, ,04. 6,12. 5,77. 6,81. 11,46. 26,05. 53,08. 46,32. 14, ,19. 10,29. 7,06. 5,02. 5,24. 9,11. 22,73. 34,36. 19,36. 12, ,45. 6,37. 5,17. 4,26. 4,81. 6,59. 15,50. 16,05. 8,58. 7, ,28. 3,80. 3,39. 4,19. 4,46. 8,64. 22,32. 42,11. 18,14. 10, ,30. 5,90. 4,93. 3,99. 4,24. 6,68. 14,07. 23,21. 13, ,47. 4,15. 3,91. 3,61. 3,10. 3,49. 4,59. 6,17. 4, ,07. 2,39. 2,33. 10,30. 11,10. 4, ,32. 3,97. 5,47. 2, ,05. 1,82. 1,77. 3,17. 4,91. 3, ,49. 2,00. 2,03. 2,13. 2,25. 2,82. 2,64. PROM. 12,44. 4,10. 3,94. 5,56. 7,33. 13,53. 22,76. 21,09.")
6
SISTEMA CORRALES

7
SISTEMA CORRALES El MOP tiene por ley la tarea de desarrollar la infraestructura pública, pero no cualquiera, sino que la esté al servicio de los habitantes del país, cumpliendo dos roles: Ser instrumento de desarrollo social y de progreso económico

8
SISTEMA CORRALES El MOP al igual que otras grandes empresas que requieren el concurso de proveedores, ha levantado Registros para resguardar la calidad y seguridad de las obras, la garantía de la seriedad del buen desarrollo y cumplimiento de los contratos y el cumplimiento de las responsabilidades legales hacia los trabajadores. Estos Registros descansan en dos grandes pilares:

9
SISTEMA CORRALES

10
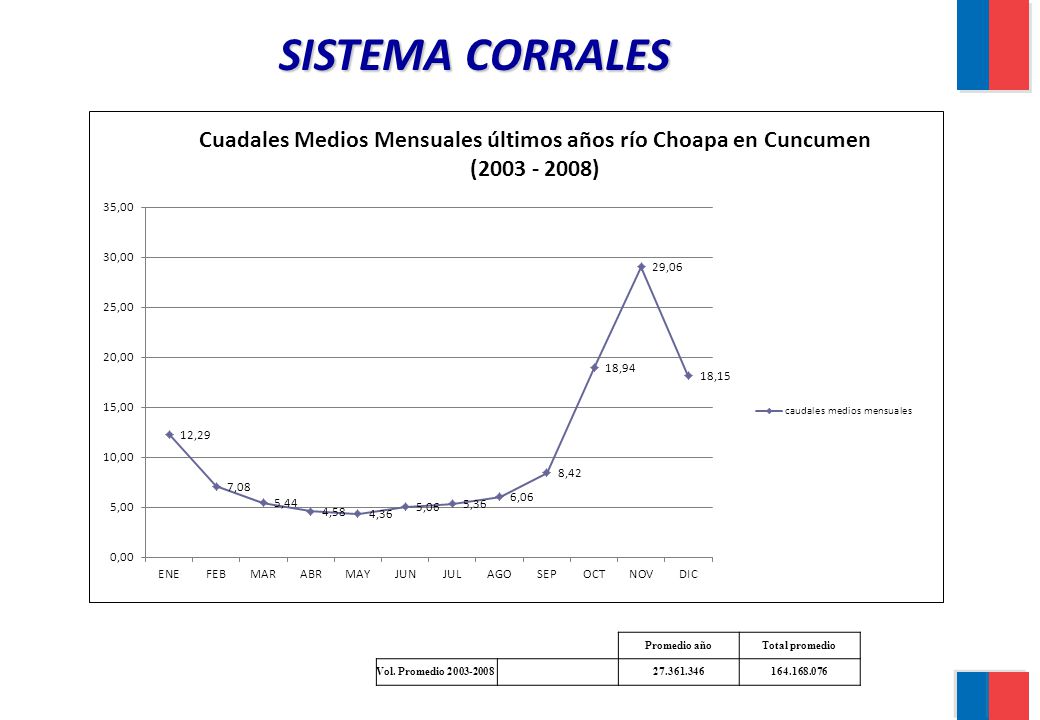
SISTEMA CORRALES Promedio año Total promedio Vol. Promedio 2003-2008
11
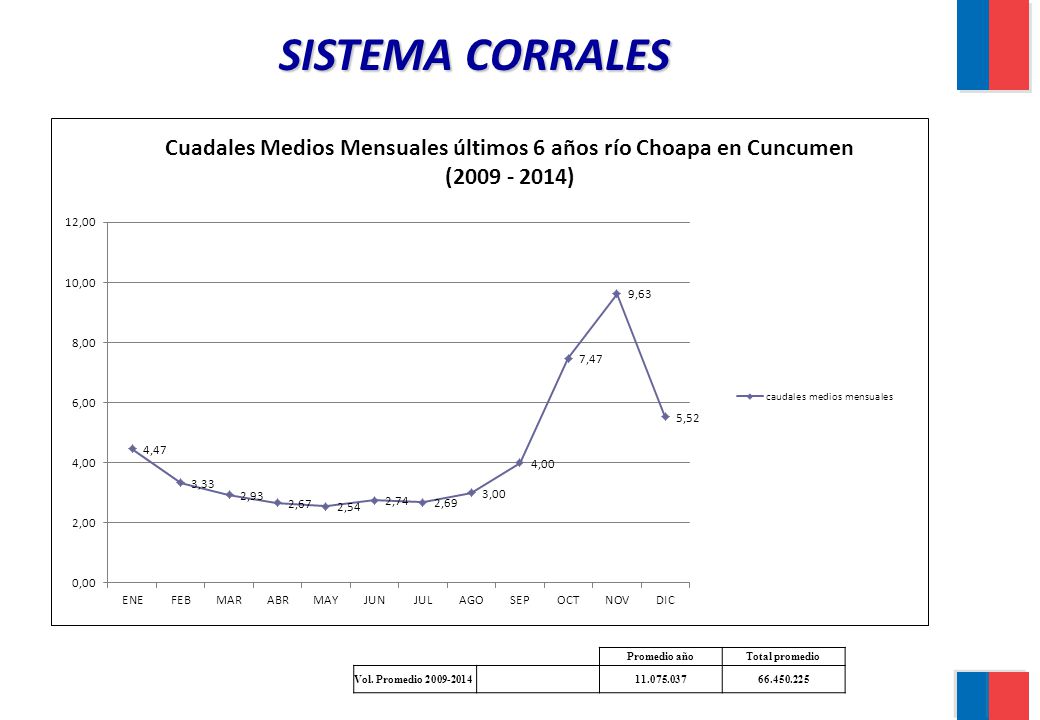
SISTEMA CORRALES Promedio año Total promedio Vol. Promedio 2009-2014
12
SISTEMA CORRALES RESULTADOS OPERACIONALES EMBALSE CORRALES
TEMPORADA AGRICOLA VOL. INI. TEMPORADA(1º de Mayo del 2013): VOL. FINAL (30 de Abril 2014): 20,06% 32,37% MES V. EMBALSE VOL. EVAP. FILTR. A.ENTREG. DESC. VERT. A. SALIDA CANAL ALIM. A.ENTRADA MAY 57.767 11.837 JUN 51.972 7.776 25.834 85.582 JUL 66.578 9.936 45.619 AGO 96.598 10.714 46.656 SEP 12.628 OCT 18.749 NOV 23.862 DIC 35.734 ENE 332,823 34.965 FEB 27.070 MAR 26.836 ABR 22.502 TOTAL
: VOL. FINAL (30 de Abril 2014): ,06% 32,37% MES. V. EMBALSE. VOL. EVAP. FILTR. A.ENTREG. DESC. VERT. A. SALIDA. CANAL ALIM. A.ENTRADA. MAY JUN JUL AGO SEP OCT NOV DIC ENE , FEB MAR ABR TOTAL")
13
SISTEMA CORRALES

14
PROYECCIÓN TEMPORADA AGRICOLA 2014-2015
SISTEMA CORRALES EMBALSE CORRALES PROYECCIÓN TEMPORADA AGRICOLA VOL. INI. TEMPORADA(1º de Mayo del 2014): VOL. FINAL (30 de Abril 2015): 32,37% 20,15% MES VOL. INICIO ENTRADA EVAP. ENTREGA FILTRACIÓN CANAL ALIM. VERTIDO VOL. FINAL MAYO (2014) 76.672 18.749 JUNIO 87.456 53.663 10.368 JULIO 64.591 10.714 AGOSTO 98.892 13.392 SEPTIEMBRE 12.628 OCTUBRE NOVIEMBRE 23.328 DICIEMBRE 30.734 ENERO(2015) 266,258 26.965 FEBRERO 24.070 MARZO 19.256 ABRIL 15.405 TOTALES Pluviometría en Corrales a la fecha: 107,6 mm (Normal Anual: 300 mm.) (Septiembre 2014) NOTA: Demanda programada Proyección estimada ILLAPEL, 01 DE DICIEMBRE DEL
: VOL. FINAL (30 de Abril 2015): ,37% 20,15% MES. VOL. INICIO. ENTRADA. EVAP. ENTREGA. FILTRACIÓN. CANAL ALIM. VERTIDO. VOL. FINAL. MAYO (2014) JUNIO JULIO AGOSTO SEPTIEMBRE OCTUBRE NOVIEMBRE DICIEMBRE ENERO(2015) 266, FEBRERO MARZO ABRIL TOTALES Pluviometría en Corrales a la fecha: 107,6. mm. (Normal Anual: 300 mm.) (Septiembre 2014) NOTA: Demanda programada. Proyección estimada. ILLAPEL, 01 DE DICIEMBRE DEL")
16
CAUDALES MEDIOS MENSUALES, PROMEDIOS Y DESV. ESTANDAR
SISTEMA BATO CAUDALES MEDIOS MENSUALES, PROMEDIOS Y DESV. ESTANDAR FECHA : 21/03/2013 Período : 1960 FUENTE DE ORIGEN Estadistica Oficial Estación : RIO ILLAPEL EN LAS BURRAS Código BNA : - 1 Latitud S : 031° 30' 25 UTM Norte : mts Altitud : 1.079 Longitud W : 070° 48' 45 UTM Este : Cuenca : RIO CHOAPA SubCuenca : Rio Illapel Area de Drenaje : 597,00 km2 (m3/Seg.) AÑO ENE FEB MAR ABR MAY JUN JUL AGO SEP OCT NOV DIC Prom Volumen(m3) 1962 1,14 1,31 1,19 1,16 1,24 0,98 1,47 1,66 1,25 1963 1,11 0,94 0,81 0,68 0,90 0,83 1,01 1,73 3,73 3,47 3,13 17,51 2,99 1964 5,43 1,37 2,43 2,47 2,53 2,63 1,35 1,33 1,07 2,15 1965 0,88 0,92 0,96 1,00 7,64 8,80 7,03 19,48 18,94 5,71 1966 5,37 3,14 2,41 2,27 2,01 1,79 1,70 1,75 2,14 3,20 4,07 2,97 2,73 1967 2,03 1,82 1,40 1,06 1,04 0,99 0,63 1,05 1,95 1,32 1968 0,89 0,49 0,59 0,44 0,65 0,71 1,15 0,54 0,14 0,12 0,62 1969 0,07 0,29 0,46 0,60 0,70 0,41 0,28 0,42 1970 0,25 0,30 0,32 0,36 0,40 0,72 0,66 0,75 0,31 0,45 1971 0,27 1972 0,22 0,21 1,43 1,23 1,91 1973 7,14 4,89 3,85 3,57 1,98 2,30 2,64 2,36 3,43 1974 0,64 1,89 0,84 2,67 3,09 2,77 1,49 1975 1,54 0,79 0,74 1,71 1,29 1976 0,87 0,67 0,69 0,93 1,59 2,35 1977 0,51 1,50 2,72 5,50 13,89 7,88 3,10 1978 4,38 2,09 1,48 1,58 2,02 1,78 3,71 11,24 8,11 3,38 1979 2,37 1,81 1,20 1,09 1,10 0,50 1,34 1980 0,39 1,30 3,27 7,82 12,63 2,66 1981 3,32 2,59 1,45 1,12 1,08 0,76 0,52 1982 1,28 2,44 3,60 12,40 18,38 3,58 1983 5,23 4,42 2,25 1,96 1,53 2,04 2,26 7,65 6,21 4,74 3,55 1984 1,99 0,91 2,18 5,13 16,65 21,02 14,34 6,03 1985 7,36 1,42 1,21 1,18 1,86 1986 0,77 1,41 2,68 4,18 3,94 1,69 1987 1,65 1,87 3,21 4,37 3,68 10,15 30,83 36,94 8,27 1988 22,05 11,47 5,58 3,91 3,12 1,76 1,55 4,69 1989 0,82 0,78 0,97 1,67 2,98 3,44 2,12 1,44 1990 1,02 1991 0,61 0,47 1,80 2,20 1,97 5,14 5,01 10,49 9,30 3,24 1992 5,07 3,03 2,10 2,38 2,08 2,78 2,42 4,71 8,65 12,64 7,51 4,67 1993 5,02 3,17 4,30 2,74 2,24 3,29 2,87 1994 1,36 1,22 0,86 0,53 1995 0,38 1996 1,27 1,03 1997 0,56 1,56 8,78 9,74 20,13 36,35 7,19 1998 27,65 4,97 1,93 1,57 4,76 1999 1,17 2000 2,90 6,65 7,32 2,76 2001 2,80 4,10 4,90 3,82 2002 3,70 4,49 3,48 5,06 6,18 13,07 21,67 20,68 7,02 2003 10,68 6,29 3,63 2,86 2,62 1,74 3,37 2004 1,64 1,13 2005 1,72 2,61 3,98 9,35 7,68 2,83 2006 3,54 1,52 1,38 1,88 1,85 2,39 2007 1,26 2008 2,93 6,09 2009 0,95 1,63 2010 0,80 0,85 2011 2012 0,58 0,73 2013 2014 0,57 2015 0,23 PROM. 3,04 3,34 5,42 5,51
 AÑO. ENE. FEB. MAR. ABR. MAY. JUN. JUL. AGO. SEP. OCT. NOV. DIC. Prom. Volumen(m3) ,14. 1,31. 1,19. 1,16. 1,24. 0,98. 1,47. 1,66. 1, ,11. 0,94. 0,81. 0,68. 0,90. 0,83. 1,01. 1,73. 3,73. 3,47. 3,13. 17,51. 2, ,43. 1,37. 2,43. 2,47. 2,53. 2,63. 1,35. 1,33. 1,07. 2, ,88. 0,92. 0,96. 1,00. 7,64. 8,80. 7,03. 19,48. 18,94. 5, ,37. 3,14. 2,41. 2,27. 2,01. 1,79. 1,70. 1,75. 2,14. 3,20. 4,07. 2,97. 2, ,03. 1,82. 1,40. 1,06. 1,04. 0,99. 0,63. 1,05. 1,95. 1, ,89. 0,49. 0,59. 0,44. 0,65. 0,71. 1,15. 0,54. 0,14. 0,12. 0, ,07. 0,29. 0,46. 0,60. 0,70. 0,41. 0,28. 0, ,25. 0,30. 0,32. 0,36. 0,40. 0,72. 0,66. 0,75. 0,31. 0, , ,22. 0,21. 1,43. 1,23. 1, ,14. 4,89. 3,85. 3,57. 1,98. 2,30. 2,64. 2,36. 3, ,64. 1,89. 0,84. 2,67. 3,09. 2,77. 1, ,54. 0,79. 0,74. 1,71. 1, ,87. 0,67. 0,69. 0,93. 1,59. 2, ,51. 1,50. 2,72. 5,50. 13,89. 7,88. 3, ,38. 2,09. 1,48. 1,58. 2,02. 1,78. 3,71. 11,24. 8,11. 3, ,37. 1,81. 1,20. 1,09. 1,10. 0,50. 1, ,39. 1,30. 3,27. 7,82. 12,63. 2, ,32. 2,59. 1,45. 1,12. 1,08. 0,76. 0, ,28. 2,44. 3,60. 12,40. 18,38. 3, ,23. 4,42. 2,25. 1,96. 1,53. 2,04. 2,26. 7,65. 6,21. 4,74. 3, ,99. 0,91. 2,18. 5,13. 16,65. 21,02. 14,34. 6, ,36. 1,42. 1,21. 1,18. 1, ,77. 1,41. 2,68. 4,18. 3,94. 1, ,65. 1,87. 3,21. 4,37. 3,68. 10,15. 30,83. 36,94. 8, ,05. 11,47. 5,58. 3,91. 3,12. 1,76. 1,55. 4, ,82. 0,78. 0,97. 1,67. 2,98. 3,44. 2,12. 1, , ,61. 0,47. 1,80. 2,20. 1,97. 5,14. 5,01. 10,49. 9,30. 3, ,07. 3,03. 2,10. 2,38. 2,08. 2,78. 2,42. 4,71. 8,65. 12,64. 7,51. 4, ,02. 3,17. 4,30. 2,74. 2,24. 3,29. 2, ,36. 1,22. 0,86. 0, , ,27. 1, ,56. 1,56. 8,78. 9,74. 20,13. 36,35. 7, ,65. 4,97. 1,93. 1,57. 4, , ,90. 6,65. 7,32. 2, ,80. 4,10. 4,90. 3, ,70. 4,49. 3,48. 5,06. 6,18. 13,07. 21,67. 20,68. 7, ,68. 6,29. 3,63. 2,86. 2,62. 1,74. 3, ,64. 1, ,72. 2,61. 3,98. 9,35. 7,68. 2, ,54. 1,52. 1,38. 1,88. 1,85. 2, , ,93. 6, ,95. 1, ,80. 0, ,58. 0, , , PROM. 3,04. 3,34. 5,42. 5,")
17
SISTEMA BATO

18
SISTEMA BATO

19
SISTEMA BATO

20
SISTEMA BATO

21
SISTEMA BATO

22
SISTEMA BATO

23
PROYECCIÓN TEMPORADA AGRICOLA 2014-2015
SISTEMA BATO EMBALSE EL BATO PROYECCIÓN TEMPORADA AGRICOLA VOL. INI. TEMPORADA(1º de Mayo del 2014): VOL. FINAL (30 de Abril 2015): 1,25% 0,63% Entrega Riego MES VOL. INICIO ENTRADA Caudal (l/s) EVAP. ENTREGA FILTRACIÓN VERTIDO VOL. FINAL (l/s) MAYO (2014) 375 30.464 298 73.699 28 326 JUNIO 578 17.163 155 77.587 30 184 JULIO 587 19.704 249 83.376 31 280 AGOSTO 511 37.592 394 90.634 34 428 SEPTIEMBRE 458 32.007 400 90.720 35 435 OCTUBRE 413 67.691 453 96.768 36 489 NOVIEMBRE 243 65.733 360 80.611 391 DICIEMBRE 272 331 69 ENERO (2015) 250 368 86.514 32 FEBRERO 254 90.459 266 83.432 300 MARZO 217 81.413 270 81.500 ABRIL 224 73.272 219 80.500 TOTALES Pluviometría en Huintil a la feha: 66,6 mm (Normal Anual: 220 mm.) (Agosto 2014) NOTA: Demanda programada Proyección estimada del 01 de Noviembre a fin de temporada
: VOL. FINAL (30 de Abril 2015): ,25% 0,63% Entrega Riego. MES. VOL. INICIO. ENTRADA. Caudal (l/s) EVAP. ENTREGA. FILTRACIÓN. VERTIDO. VOL. FINAL. (l/s) MAYO (2014) JUNIO JULIO AGOSTO SEPTIEMBRE OCTUBRE NOVIEMBRE DICIEMBRE ENERO (2015) FEBRERO MARZO ABRIL TOTALES Pluviometría en Huintil a la feha: 66,6. mm. (Normal Anual: 220 mm.) (Agosto 2014) NOTA: Demanda programada. Proyección estimada del 01 de Noviembre a fin de temporada")
24
OBJETIVOS ESTRATEGICOS
Entregar, mantener y operar servicios de infraestructura hidráulica, considerando los efectos del cambio climático, que respondan a las necesidades y que contribuyan al desarrollo productivo del país, de manera oportuna, confiable y con costos competitivos. Mejorar el bienestar de la población, contribuyendo al desarrollo de su capital humano y social, , a través de la provisión de servicios de infraestructura hidráulica y el fortalecimiento de las organizaciones comunitarias beneficiadas. Mi tarea como Jefa del Registro es cumplir y hacer cumplir las disposiciones establecidas en estos dos reglamentos. Teniendo presente “que lo que no puedo hacer para todos, no lo debo hacer para uno.” Se da todas la ayudas necesarias para que los buenos contratistas puedan inscribirse y mantenerse vigentes para que puedan encontrarse habilitados para participar en el Sistema de Contratación de Obras del MOP Explicar reglamentos 24

25
Gracias.

Presentaciones similares


 Para el mes de ENERO.>")


