Descargar la presentación
La descarga está en progreso. Por favor, espere

1
Noviembre 2008 Migración y Salud Dr. José Ángel Córdova Villalobos Migración y Salud Dr. José Ángel Córdova Villalobos

2
Contexto La migración es un fenómeno mundial. 200 Millones de personas se mueven anualmente. (Science, 2003)La capacidad de migrar con éxito a diferentes medios es una de las señas de identidad de nuestra especie y una de las razones de nuestro éxito evolutivo (Science, 2003)
La capacidad de migrar con éxito a diferentes medios es una de las señas de identidad de nuestra especie y una de las razones de nuestro éxito evolutivo (Science, 2003).")
3
Familias o personas del medio rural que por su precaria situación económica y social, dejan sus comunidades de origen y migran hacia las zonas de desarrollo agrícola. Se consideran como jornaleros agrícolas a aquellos trabajadores eventuales del campos que se emplean en las labores agrícolas. Las principales causas por las que migra se refieren a la ausencia de fuentes de empleo, la necesidad de recursos económicos y la carencia de tierras. Poco más de la mitad de los jornaleros agrícolas (55.6%) migra en grupos familiares. Cerca del 61.1% de los hijos de familias jornaleras agrícolas –de entre 6 y 14 años de edad- no asiste a la escuela. Razones de la Migración
 migra en grupos familiares. Cerca del 61.1% de los hijos de familias jornaleras agrícolas –de entre 6 y 14 años de edad- no asiste a la escuela. Razones de la Migración.")
4
La participación de menores en el proceso migratorio México-Estados Unidos 1. Menores hijos de migrantes que permanecen en México Los niños permanecen en México separados de sus padres. Pueden quedarse al cuidado de algún miembro de la familia extensa. 2. Menores que migran a Estados Unidos Viajan con sus familiares o migran solos después de que sus progenitores cruzan la frontera 3. Hijos de migrantes mexicanos en Estados Unidos 4. Menores que son devueltos al país de origen

5
Nuevas responsabilidades Asumir las consecuencias de sus decisiones La administración de las remesas La educación y formación de los hijos El cuidado de la parcela o de los animales La negociación con la familia política El acoso de los hombres que se quedan La participación en asambleas La incertidumbre del comportamiento sexual del marido Son fuente de estrés, ansiedad y problemas físico-emocionales para las mujeres ante la ausencia del cónyuge Consecuencias en Mujeres con Familiares Migrantes

6
Según estimaciones de las Naciones Unidas, de los 175 millones de migrantes que hay en el mundo, 120 millones se incluyen en la categoría de trabajadores migratorios y sus familias. La migración en México está ubicada en su modalidad migratoria de origen, tránsito y destino. Se estima que en Estados Unidos existen 12 millones de inmigrantes sin papeles, el 50% son mexicanos. Anualmente migran hacia el exterior de nuestro país 2.5 millones de personas, el 98% hacia los EUA, el 25% son mujeres. Datos sobre Migración

7
Regionalization of migration from Mexico to the USA None Very low Low Medium High Very high Source: CONAPO (2002). Colección Índices Sociodemográficos. Índices de Intensidad Migratoria, 2000 México-Estados Unidos.

8
El índice de intensidad migratoria (IIM) municipal, construido por CONAPO en 2003, indica que el 96% de los 2,443 municipios del país experimentan algún grado de vinculación con el proceso migratorio: expulsión-recepción de población migrante y/o recepción de remesas. La mayor parte de los movimientos se concentran entre las 364 ciudades del país y sus 504 municipios urbanos y metropolitanos. La migración hacia los 38 municipios de la frontera norte representa 15%, es decir uno de cada siete potenciales migrantes internos se dirigió a la zona fronteriza. Municipios migrantes en México

9
Región Tradicional Migratoria: Aguascalientes, Colima, Durango, Guanajuato, Jalisco, Michoacán, Nayarit, San Luís Potosí y Zacatecas. La región aporta el 18% del PIB nacional y el PIB Per Capita es de $4,386 Dólares Región Norte: Baja California, Coahuila, Chihuahua, Nuevo León, Sonora, Tamaulipas, Baja California Sur y Sinaloa. La región aporta el 27% del PIB nacional y el PIB Per Capita es de $7,207 Dólares Región Centro: Hidalgo, Morelos, Puebla, Querétaro, Distrito Federal, México y Tlaxcala. La región aporta el 41% del PIB nacional y el PIB Per Capita es de $6,743 Dólares Región SurSureste: Campeche, Chiapas, Guerrero, Oaxaca, Quintana Roo, Tabasco, Veracruz y Yucatán. La región aporta el 14% del PIB nacional y el PIB PerCapita es de $3,509 Dólares Regiones Migratorias y su peso en la actividad económica del país

10
La Frontera Norte de México tiene una extensión de poco más de 3,000 km., y comprende seis estados de la República Mexicana: Baja California, Sonora, Coahuila, Nuevo León, Chihuahua y Tamaulipas; y cuatro de los Estados Unidos: California, Arizona, Nuevo Mexico y Texas. Las ciudades del lado mexicano pertenecen a 36 municipios. Las más importantes, por su desarrollo económico y por la interacción que mantienen, son Tijuana, Mexicali, Nogales, Piedras Negras, Ciudad Acuña, Monterrey, Ciudad Juárez y Reynosa. Sus contrapartes por el lado estadounidense son San Diego, Caléxico, Nogales Arizona, Douglas y El Paso. Últimamente se han incorporado a esta lista, por su importancia, las Ciudades de San Luis, Río Colorado y Aguaprieta, Sonora. Región Fronteriza México – Estados Unidos

11
DEMOGRAPHIC PROFILE OF MEXICANS IN THE UNITED STATES THE POPULATION - Of the 45.5 million Latinos in the U.S., 64% are of Mexican origin (40% of which are first generation Mexicanimmigrants).1,2 Over half of all recent* Mexican immigrants are between the ages 18-34.4 - Mexican immigrants enter the U.S. at an average age of 21.5 - 44% of Mexican immigrants are homeowners.3 - One-fifth of Mexican immigrants are naturalized citizens Fuente: HEALTH INITATIVE OF THE AMERICAS | UNIVERSITY OF CALIFORNIA (UC) UC BERKELEY SCHOOL OF PUBLIC HEALTH. Demographic profile of mexicans in the united states demographic profile of mexicans in the united states october 2008
 UC BERKELEY SCHOOL OF PUBLIC HEALTH. Demographic profile of mexicans in the united states demographic profile of mexicans in the united states october")
12
DEMOGRAPHIC PROFILE OF MEXICANS IN THE UNITED STATES ECONOMIC STATUS: -Over 25% of recent Mexican immigrant families live with annual incomes below the federal poverty level ($10,488 for a single adult and $20,444 for a couple with two children in 2006). -41% of Mexican-born children under the age of 18 and 21.9% of working- age adults between the ages of 18 and 64 live in poverty. -The average earning of Mexican immigrants ages 18-64 in jobs that are heavily reliant on Mexican immigrant labor is $19,200 annually, and $13,900 for women. -On average, Mexican immigrant men working full-time earn 45%less than native-born men; Mexican immigrant women earn 40% less than native- born women. -An average Mexican immigrant family with both parents working in jobs that are heavily reliant on Mexican immigrants will be unable to meet the minimal standard of living for a family of four in California ($50,000 annually). FUENTE: HEALTH INITATIVE OF THE AMERICAS | UNIVERSITY OF CALIFORNIA (UC) UC BERKELEY SCHOOL OF PUBLIC HEALTH. DEMOGRAPHIC PROFILE OF MEXICANS IN THE UNITED STATES DEMOGRAPHIC PROFILE OF MEXICANS IN THE UNITED STATES OCTOBER 2008
. FUENTE: HEALTH INITATIVE OF THE AMERICAS | UNIVERSITY OF CALIFORNIA (UC) UC BERKELEY SCHOOL OF PUBLIC HEALTH. DEMOGRAPHIC PROFILE OF MEXICANS IN THE UNITED STATES DEMOGRAPHIC PROFILE OF MEXICANS IN THE UNITED STATES OCTOBER")
13
Institucionalización de la restricción migratoria: leyes restrictivas, presupuesto. El tiempo promedio de estancia ha pasado de 5.5 a 11.2 meses, en los últimos diez años. En el 2005 el 45% de los migrantes regresaba, para el 2007 el 27% regresó. La tendencia menos migraciones, migraciones más largas. Tiempos adversos: control de movimientos migratorios, redadas masivas, deportaciones, tratamiento de delincuentes. Situación económica de Estados Unidos e internacional. Aumento de la migración infantil. Aumento migración del sur, sureste, península de Yucatán. Situación Actual

14
Pérdida Anual de Población Mexicana a Causa de la Migración

15
Fuente : Estimaciones de CONAPO con base en STyPS, CONAPO, INM y EL COLEF, Encuesta sobre Migración en la Frontera Norte de México (EMIF), 1993-2004 Migrantes que Cruzaron de Manera Indocumentada
, Migrantes que Cruzaron de Manera Indocumentada")
16
Población nacida en México y en otras regiones del mundo residente en EEUU, 2005 Fuente: estimaciones con base en Bureau of Census, Current Population Survey (CPS), marzo de 2005.
, marzo de 2005.")
17
Tendencias de la Migración Incremento vertiginosa mente en últimas décadas Indocumentados: modalidad predominante De circular a permanente Se extiende a todo el territorio Aumentan vínculos trasnacionales

18
En el 2007, se repatriaron a nivel nacional a 35,546 niños, niñas y adolescentes menores de 18 años a través de los cinco estados fronterizos. DELEGACIÓN2007 INM COAHUILA 1,298 TAMAULIPAS 3,992 SONORA 11,739 CHIHUAHUA 6,105 BAJA CALIFORNIA12,412 TOTAL 35,546 La participación de menores en el proceso migratorio México-Estados Unidos

19
Las mujeres migrantes son triplemente vulnerables en ese viaje ya que por el hecho de ser mujer se está expuesta a una serie de posibles violaciones a su persona tanto físicas como psíquicas. Todo ello tiene como consecuencia el rechazo, la estigmatización, la segregación y la violencia en contra de las mujeres migrantes indocumentadas, lo que contribuye a generar un escenario de mayor vulnerabilidad al VIH, asunto hoy de escasa prioridad para las propias organizaciones de la región. Migración de Mujeres

20
22 ESTADOS 52 ESTACIONES MIGRATORIAS PAÍS DE NACIONALIDAD TOTAL % HONDURAS22,98945.4 GUATEMALA15,14329.9 EL SALVADOR5,83711.5 CUBA1,3592.7 ESTADOS UNIDOS 8961.8 NICARAGUA8621.7 OTROS3,5127.0 TOTAL50,598100.0 Eventos de aseguramiento en México según nacionalidad enero - diciembre de 2007

21
Distribution of Foreign Population Resident in United States by Region or Country of Birth, 2007

22
Undocumented Immigrant Population (from Mexico and other regions) Resident in United States, 2006
 Resident in United States, 2006")
23
Immigrant Population (from Mexico and Other Regions) with Medical Insurance by Citizenship Status in United States, 2007
 with Medical Insurance by Citizenship Status in United States, 2007")
24
Work Risks among Immigrant Population in United States

25
Arizona Immigrant Stock 1 9 7 0 – 2 0 0 0 Not only has Arizonas illegal alien population grown rapidly, the overall foreignborn population has shot up since the 1965 change in U.S. immigration law. Similarly, the size of the immigrant stock (which includes the offspring of immigrants aswell as the immigrants themselves) has surged. Both of these groups contribute to the costs of illegal immigration. The progeny of immigrants both legally and illegally in the country is now greater than the foreign-born population.
 has surged. Both of these groups contribute to the costs of illegal immigration. The progeny of immigrants both legally and illegally in the country is now greater than the foreign-born population..")
26
ARIZONA ILLEGAL IMMIGRANTS 2004 OUTLAYS AND RECEIPTS Using the same per pupil cost estimate for the U.S.-born children of illegal aliens indicates that the additional expense of educating these children through the 12th grade is at least an additional $480 million per year or a total annual educational cost from illegal immigration of at least $810 million per year. Uncompensated medical outlays for health care provided to the states illegal alien population is now estimated at about $400 million a year. Updating for the increased illegal immigrant population and inflation suggests that current annual tax payments would be about $110 million in sales taxes, $85 million in property taxes, and $62 million in income taxes – for a total of $257 million.

27
CALIFORNIA ILLEGAL IMMIGRANTS 2004 OUTLAYS AND RECEIPTS (in billions) Education. Based on estimates of the illegal immigrant population in California and documented costs of K-12 schooling, Californians spend approximately $7.7 billion annually on education for illegal immigrant children and for their U.S.-born siblings. Nearly 15 percent of the K-12 public school students in California are children of illegal aliens. Health care. Uncompensated medical outlays for health care provided to the states illegal alien population amount to about $1.4 billion a year. Incarceration. The cost of incarcerating illegal aliens in Californias prisons and jails amounts to about $1.4 billion a year (not including related law enforcement and judicial expenditures or the monetary costs of the crimes that led to their incarceration). State and local taxes paid by the unauthorized immigrant population go toward offsetting these costs, but they do not come near to matching the expenses. The total of such payments can generously be estimated at about $1.6 billion per year.
. State and local taxes paid by the unauthorized immigrant population go toward offsetting these costs, but they do not come near to matching the expenses. The total of such payments can generously be estimated at about $1.6 billion per year..")
28
California Foreign Stock 1970 – 2000 Not only has Californias illegal alien population grown rapidly, the overall foreign-born population has shot up since the 1965 change in U.S. immigration law. Similarly, the size of the immigrant stock (which includes the progeny of immigrants as well as the foreign-born immigrants themselves) has surged. The progeny of immigrants both legally and illegally in the country has more than doubled (117%) over the three decades while the foreign-born population has more than quintupled (404%). Californias foreign stock population alone is larger than the total population of every other state in the country with the exception of Florida, New York and Texas. The states foreign-born population alone is larger than the total population of all but seven states.
 has surged. The progeny of immigrants both legally and illegally in the country has more than doubled (117%) over the three decades while the foreign-born population has more than quintupled (404%). Californias foreign stock population alone is larger than the total population of every other state in the country with the exception of Florida, New York and Texas. The states foreign-born population alone is larger than the total population of all but seven states..")
29
Mexican immigrant men and women as % of all men and women in occupation Mexican immigrant men in the U.S. make 45% less than their native counterparts. Mexican immigrant women in the U.S. make 40% less than their native counterparts. 60% of recent Mexican immigrants have no health insurance. MENWOMEN

30
Legal Status of Immigrants Source: Based on Pew Hispanic Center estimates derived principally from the March 2004 Current Population Survey (CPS) and Census 2000 (Passel 2005). (See also Passel et al. 2004; Passel 2002, 2003.) Neither dataset, however, includes direct information on unauthorized status or any legal status, other than naturalization. Our estimates also draw on data from the Immigration and Naturalization Service (INS), the Department of Homeland Security (DHS), and information about countries of birth, time spent in the U.S., and occupation (Passel and Clark 1998; Passel, Van Hook, and Bean 2005.) Note that these estimates include an allowance for immigrants not included in the CPS.
 Neither dataset, however, includes direct information on unauthorized status or any legal status, other than naturalization. Our estimates also draw on data from the Immigration and Naturalization Service (INS), the Department of Homeland Security (DHS), and information about countries of birth, time spent in the U.S., and occupation (Passel and Clark 1998; Passel, Van Hook, and Bean 2005.) Note that these estimates include an allowance for immigrants not included in the CPS..")
31
Unauthorized Are Largely Latin American The estimates presented in this chart are derived by Passel (2005) using residual techniques applied to the March 2004 CPS. Note that the methodology adjusts for legal immigrants and unauthorized migrants not included in the March 2004 CPS; approximately 1 million unauthorized migrants are estimated to be omitted from the CPS. Source: Based on Passel 2005 using methods described in Passel et al. 2004.

32
Major Redistribution Away From Big 6 Settlement States This chart shows the high degree of geographic diversification that occurred for the unauthorized population during the 1990s. In 1990, 45% of the unauthorized population, or about 1.6 million persons, lived in California; by 2004, the share had dropped to 24%. Note, however, that because of the sizeable growth in the unauthorized population, California still experienced substantial growth to about 2.4 million or growth of about 45%. Texas share increased while New Yorks dropped significantly. In Florida, New Jersey, and Illinois, the shares changed little, but the numbers increased significantly.

33
New Flows from Mexico Dominated by Unauthorized The cohorts who have entered from Mexico since 1990 are principally unauthorized. This trend translates into an average of about 400,000-485,000 annual unauthorized entrants from Mexico. Of those cohorts in the country more than 14 years, most are legal residents. For those entering before 1985, virtually all are legal. T The data do not necessarily support the idea that the share of Mexican migration that is unauthorized has been increasing in recent years. The earlier cohorts (i.e., pre-1990) had also been largely unauthorized when they had been in the country for shorter durations. That is, the Mexican-born population in the United States for less than 5 years was found to be at least 75% unauthorized in estimates made for 1995, 1990, 1986, and 1980.
 had also been largely unauthorized when they had been in the country for shorter durations. That is, the Mexican-born population in the United States for less than 5 years was found to be at least 75% unauthorized in estimates made for 1995, 1990, 1986, and")
34
Unauthorized Families Are Younger Unauthorized families are much younger, on the whole than either native families or families of legal immigrants. A much higher share of persons in unauthorized families are children (under 18)35% among unauthorized families versus 29% among legal immigrant families and only 24% among native families. At the other end of the age spectrum, virtually none of the unauthorized population is elderly (65 and over). In contrast, about 1 in 6 native adults and the same share of legal immigrant adults is aged 65 or older. Source: Based on Urban Institute data from March 2004 CPS with legal status assigned. The CPS does not include direct information on unauthorized status or any legal status, other than naturalization. Status assignments use methods of Passel and Clark 1998 and Passel, Van Hook, and Bean 2004, 2005.
35% among unauthorized families versus 29% among legal immigrant families and only 24% among native families. At the other end of the age spectrum, virtually none of the unauthorized population is elderly (65 and over). In contrast, about 1 in 6 native adults and the same share of legal immigrant adults is aged 65 or older. Source: Based on Urban Institute data from March 2004 CPS with legal status assigned. The CPS does not include direct information on unauthorized status or any legal status, other than naturalization. Status assignments use methods of Passel and Clark 1998 and Passel, Van Hook, and Bean 2004,")
35
Lack of Health Insurance Much Higher Among Unauthorized The proportion of adults and children in families without health insurance at any point in 2003 on the basis of the March 2004 CPS. Children are identified by their own nativity and by the status of their parents; adults, by their own status. Immigrant adults are much more likely than natives to lack health insurance. More than half of unauthorized adults do not have insurance. A principal factor affecting this pattern is that the occupations and industries in which the unauthorized work tend to be those where employers do not provide insurance. Although poverty levels for children are higher than those of adults, children are more likely to have health insurance than adults. Source: Based on Urban Institute data from March 2004 CPS with legal status assigned. The CPS does not include direct information on unauthorized status or any legal status, other than naturalization. Status assignments use methods of Passel and Clark 1998 and Passel, Van Hook, and Bean 2004, 2005.

36
Population of Mexican Origin Resident in United States, 1900-2007

37
Immigrant Population (from Mexico and Other Regions) and White US-born Population Resident in United States by Age Group, 2007
 and White US-born Population Resident in United States by Age Group, 2007")
38
POPULATION GROWTH OF MEXICAN AMERICANS AND MEXICAN IMMIGRANTS ONLY IN THE U.S. SINCE 1994 Country / Region of origin of immigrants, all ages, 2006 Source: U.S. Census bureau. 2006, current population survey. In 2006 those of Mexican origin living in the United Statessome 11.2 million constituted almost 30% of the 38 million immigrants in this country. The next largest group of foreign-born residents came from Asia, accounting for over one-quarter of all residents born abroad. U.S. residents who were born in Central America and elsewhere in Latin America combined represent just over 20%. Mexican immigration is even more signifi cant in California. Of the 10 million Californians who were born abroad two-fi fths are of Mexican origin and one-third are from Asia. Compared with the entire country, there are proportionally fewer immigrants in California from Central and South America, Europe and Canada.

39
STATES WITH MORE THAN 100,000 MEXICAN IMMIGRANTS, 2006 Source: U.S. Census Bureau. 2006, Current Population Survey. California, which boasts the largest number of Mexican-born U.S. residents, and Texas, the only other state with over one million Mexican immigrants, are together home to almost 60% of all Mexican immigrants in the country. At the same time, Mexicans are increasingly settling in large numbers in states not traditionally associated with immigration from Mexico, such as Florida and Georgia. Fourteen states are each home to over 100,000 Mexican immigrants. Many more states that have not had such noticeable levels of immigration from Mexico are also experiencing burgeoning populations, such as South Carolina, where more than 50,000 Mexican immigrants now reside.

40
A HIGH PROPORTION OF MEXICAN IMMIGRANT ADULTS LIVE IN POVERTY Over one-quarter of recent Mexican immigrant adults live in families with annual incomes below the federal poverty level (Figure 6). In 2006 the poverty threshold for a single adult was $10,488 and for a couple with two children it was $20,444. The poverty rate is lower for long-stay Mexican immigrant adults. For U.S.-born Mexican Americans it is almost half that of recent Mexican immigrants, though it is still almost double the rate of U.S.-born non-Latino whites. Source: U.S. Census Bureau. 2006, Current Population Survey.

41
Adjusted Per Capita Health Care Expenditure Among US- Born Persons and Immigrants of All Ages, by Race/Ethnicity As show,after multivariates, adjustment, non-Hispanic Whites had the highest per capita expenditures, whereas Hispanics and Asians had the lowest per capita expenditures. Health care expenditures were similar for US-born and inmigrants Asians. In contrast, adjusted health expenditures for immigrant non Hispanic Whites, non-Hispanic Blacks, and Hispanic were lower than those for US-born individuals from these groups.

42
México tiene un escenario de salud en doble sentido: 1.Frontera Norte: Migración hacia Estados Unidos y Canadá y retorno de Migrantes. 2.Frontera Sur: Migración de centroamericanos y de otros países suramericanos y retorno de migrantes. A todo migrante se le debe proporcionar: Promoción a la Salud Prevención de Enfermedades Diagnóstico y Tratamiento Oportuno Control de Enfermedades Migración en México

43
Colaboración Binacional Secretaria de Salud (federal + estados) Rel. Exteriores (IME + Consulados) SEP (PROBEM) CONACYT Sociedad Civil (Funsalud, clubes) Universidades
 SEP (PROBEM) CONACYT Sociedad Civil (Funsalud, clubes) Universidades.")
44
Determinants of vulnerability to HIV infection: The coexistence of multiple stigmas Source: Infante C and Leyva R, 2008 Stigma Migration AIDS Ethnic origin Sexual minorities

45
Migration is a strong determinant of vulnerability to HIV Sexual Violence –30% of migrant women suffer from sexual abuse during their journey to the US (Leyva et al, 2008) Transactional and survival Sex: –Sex as an exchange currency to transit and to secure stay in the US (Caballero, M et al, 2008) Increase in the number of sexual partners (Bronfman, et al.1995) Riskier sexual practices and low condom use (Leyva et al, 2008)
 Transactional and survival Sex: –Sex as an exchange currency to transit and to secure stay in the US (Caballero, M et al, 2008) Increase in the number of sexual partners (Bronfman, et al.1995) Riskier sexual practices and low condom use (Leyva et al, 2008)")
46
HIV Prevalence in Mexico, Central America and USA Prevalence (%) in adults 15–49 years old Belice: 2.1 % Honduras: 0.7% El Salvador: 0.8% 0.6% 0.3 % Guatemala: 0.8% Nicaragua: 0.2% Costa Rica, 0.4% Panamá, 1.0% Source: UNAIDS. Report on the global AIDS epidemic 2008

47
HIV prevalence in migrants 2% of migrants in transit at the Mexican-Guatemalan border are HIV positive –In contrast, there is a prevalence from 1% to 0.3% in their countries of origin –Sample of 420 migrants in transit who stayed in refuge at Tapachula, Chiapas in 2007. (Leyva et al, 2007) 3.4% of the total people living with AIDS in US side of the Mexico border states are latin american. 2006- 2007 (Ruiz J, 2007)
 3.4% of the total people living with AIDS in US side of the Mexico border states are latin american (Ruiz J, 2007).")
48
Comportamiento sexual VariableMigrante No migrante Edad primera relación sexual17.0 años18.5 años Parejas sexuales en el último año1-121-3 Uso del condón con la última pareja sexual 45%24% Condones en bolsillo al momento de la entrevista 18%5% Fuente CENSIDA y UC

49
Riesgos para adquirir VIH Riesgos para adquirir VIH (CDC, 2006) Hombre HSH sin protección adecuada: 59% Contacto Heterosexual: 17% Consumo droga intravenosa: 19%Mujeres Contacto heterosexual: 73% Droga Intravenosa: 23%
 Hombre HSH sin protección adecuada: 59% Contacto Heterosexual: 17% Consumo droga intravenosa: 19%Mujeres Contacto heterosexual: 73% Droga Intravenosa: 23%")
50
Migration and AIDS Mexican migrants are believed to be at higher risk of HIV and STI infection due to social, cultural and economic circumstances that may cause higher incidence of high-risk behaviors (for example, MSM behavior and injecting drug use). (Bronfmann, Sejenovich and Uribe, 1998) Migrant's mobility constitutes in itself a challenge for epidemiological surveillance and may be a factor in the growing incidence of AIDS in rural areas (Magis, Gayet et al. 2004). Reaching migrant populations for HIV/AIDS related behavioral research and for prevention activities constitutes a challenge both in their home and in their target countries.(Sanchez 2008)
 Migrant s mobility constitutes in itself a challenge for epidemiological surveillance and may be a factor in the growing incidence of AIDS in rural areas (Magis, Gayet et al. 2004). Reaching migrant populations for HIV/AIDS related behavioral research and for prevention activities constitutes a challenge both in their home and in their target countries.(Sanchez 2008).")
51
Migration and HIV in the US Evidence from limited epidemiologic studies and reports from service providers suggest that Mexican migrants and their sex partners in the U.S. and Mexico are at increased risk of HIV/STD infection (Sanchez et al, Painter et al) Mexico has a lower HIV prevalence than the U.S. (0.3% to 0.6%) (UNAIDS 2006) Research suggests that the likelihood of being infected with HIV is greater in the U.S. than in countries of origin (Harawa et al, Levy et al.) HIV risk behavior is greater among migrants as compared to non- migrants in Mexico (CENSIDA)
 Mexico has a lower HIV prevalence than the U.S. (0.3% to 0.6%) (UNAIDS 2006) Research suggests that the likelihood of being infected with HIV is greater in the U.S. than in countries of origin (Harawa et al, Levy et al.) HIV risk behavior is greater among migrants as compared to non- migrants in Mexico (CENSIDA).")
52
Mexico is Surrounded by Higher HIV Prevalences Guatemala, 0.8% Belice, 2.0% Honduras, 0.7% El Salvador, 0.8% 0.6% 0.3% Source UNAIDS.

53
STI Rate per 100,000 Year of diagnosis 2005 Mexico US Latino population Gonorrhea1.275 Syphilis2.13.3 (5.5 men, 0.9 women) Reported AIDS 6.524 Sources: Panorama Epidemiológico del VIH/SIDA e ITS en México, 2005. CONASIDA, CDC Sexually Transmitted Disease Surveillance 2005

54
AIDS in 2005 N=1,488 AIDS cases were diagnosed in the U.S. in 2005 among persons born in Mexico (21% of all the Latino AIDS cases in the U.S.) N= 5,050 AIDS cases were diagnosed in Mexico in 2005
 N= 5,050 AIDS cases were diagnosed in Mexico in")
55
New collaboration provides new data The California-Mexico Epidemiological Surveillance Pilot (CMESP), 2005-2007 –Binational collaboration between federal, state, and local agencies in Mexico and in California. –Combines outreach techniques with sample survey methods to enumerate, sample, and estimate HIV high-risk behavior prevalence

56
Change in Behaviors after Migration for Men (n=364) HIV High-Risk Behavior % Prior to Migration % After Migration OR (95% CI) P Value* Sexual partner who was a sex worker 18.129.4 2.64 (1.68-4.25) <.0001 Sexual relations with a partner while under the influence of drugs or alcohol 24.641.3 5.00 (2.93-8.99) <.0001 Exchanged sex for money, food, shelter, drugs, or protection 1.42.7 6.00 (0.89-138.97).070
 HIV High-Risk Behavior % Prior to Migration % After Migration OR (95% CI) P Value* Sexual partner who was a sex worker ( ) <.0001 Sexual relations with a partner while under the influence of drugs or alcohol ( ) <.0001 Exchanged sex for money, food, shelter, drugs, or protection ( ).070")
57
HIV High-Risk Behavior % Prior to Migration % After Migration OR (95% CI) P Value* Sexual Partner who was male 3.66.9 13.00 (2.28-278.9).001 Low condom use (never, rarely, or sometimes) 81.465.1 0.21 (0.10-0.43) <.0001 * Mid-p value Change in Behaviors after Migration for Men (n=364)
 P Value* Sexual Partner who was male ( ).001 Low condom use (never, rarely, or sometimes) ( ) <.0001 * Mid-p value Change in Behaviors after Migration for Men (n=364)")
58
Sexual Partner who was a Sex Worker Stratified by Venue Type: Men (n=364) Venue % Prior to Migration % After Migration OR (95% CI) P Value* Male Work Sites (n=200) 21.537.0 2.94 (1.69-5.32) <.0001 Community Sites (n=112) 12.521.4 2.67 (1.07-7.43).035 Bars and Clubs (n=52) 17.317.3 1.00 (0.17-5.82) 1.000 * Mid-p value
 Venue % Prior to Migration % After Migration OR (95% CI) P Value* Male Work Sites (n=200) ( ) <.0001 Community Sites (n=112) ( ).035 Bars and Clubs (n=52) ( ) * Mid-p value")
59
Sexual Partner who was Male Stratified by Venue Type: Men (n=364)Venue % Prior to Migration % After Migration OR (95% CI) P Value* Male Work Sites (n=200).0200.015 1.00 (0.00-19.00).500 Community Sites (n=112) 1.81.8**** Bars and Clubs (n=52) 13.538.5 18.26 (3.86-Infty).0001 *Mid-p value **Degenerate conditional distribution
Venue % Prior to Migration % After Migration OR (95% CI) P Value* Male Work Sites (n=200) ( ).500 Community Sites (n=112) **** Bars and Clubs (n=52) (3.86-Infty).0001 *Mid-p value **Degenerate conditional distribution")
60
Conclusion Results indicate an increase in the number of male migrants adopting HIV high-risk behaviors after migration related to sex with a sex worker, sex while under the influence of drugs or alcohol, sex work, and having sex with a male partner. –Those male migrants identified as being at particularly elevated risk include: –Those living or working in the U.S. for over 5 years –The youngest age cohort (18-29 years old) –Those frequenting male work sites and bars and clubs where women are infrequently present These stratified results suggest targeting HIV prevention interventions and HIV-related medical care needs to these male subgroups and male- dominated venues where this hard-to-reach population is concentrated. Migrations significant effect on increased HIV high-risk behaviors among male Mexican migrants, specifically, suggests that, without intervention, the HIV epidemic may expand among this population
 –Those frequenting male work sites and bars and clubs where women are infrequently present These stratified results suggest targeting HIV prevention interventions and HIV-related medical care needs to these male subgroups and male- dominated venues where this hard-to-reach population is concentrated. Migrations significant effect on increased HIV high-risk behaviors among male Mexican migrants, specifically, suggests that, without intervention, the HIV epidemic may expand among this population.")
61
La migración: una condición de vulnerabilidad social relacionada con la transmisión del SIDA Sexo transaccional: Como un medio para el tránsito por México hacia Estados Unidos, como forma de sobrevivencia y como Medio de inserción laboral en US Violencia sexual 30% de las mujeres migrantes violadas en el tránsito por México (La casa del Migrante, 2007) Incremento en el número de parejas ocasionales Nuevas prácticas sexuales desprotegidas Estigma preexistente: Migrante y Potencial portador de problemas (VIH, entre otros) Migración de Mujeres y SIDA
 Incremento en el número de parejas ocasionales Nuevas prácticas sexuales desprotegidas Estigma preexistente: Migrante y Potencial portador de problemas (VIH, entre otros) Migración de Mujeres y SIDA")
62
HIV/AIDS AND LATINOS IN THE UNITED STATES Source: HEALTH INITATIVE OF THE AMERICAS | UNIVERSITY OF CALIFORNIA (UC) UCBERKELEY SCHOOL OF PUBLIC HEALTH. HIV/AIDS AND LATINOSIN THE UNITEDSTATES OCTOBER 2008 UNITED STATES: Of the 1.2 million people in the U.S. affected by HIV/AIDS, approximately 200,000 are Latino. Although Latinos comprise only 14% of the U.S. population, they account for 19% of the AIDS cases diagnosed in 2006.4 Their HIV infection rate is 10 times higher than the U.S. national rate. In 2005, HIV/AIDS was the 4th leading cause of death for Latino men and women aged 35-44. The AIDS case rate per 100,000 among Latinos is 20.8, the second highest among racial ethnic groups in the U.S. Although Latino males have an AIDS case rate of 31.3 per 100,000, more than 3 times greater than Latinas (9.5), Latinas are disproportionately affected in comparison to other female racial/ethnic groups. Latinas have an AIDS case rate 5 times greater than white women (1.9).
, Latinas are disproportionately affected in comparison to other female racial/ethnic groups. Latinas have an AIDS case rate 5 times greater than white women (1.9)..")
63
HIV/AIDS AND LATINOS IN THE UNITED STATES CALIFORNIA: In 2006, Latinos represented 36% of the population in California and 34% of newly diagnosed cases of AIDS. Approximately 70% of Latinos living with AIDS are of Mexican descent. California attracts 28% of all Mexican immigrants in the U.S., most with dependents across the border, as urban day laborers in service or commercial industries. Young adult Latinos age 20-24 are also disproportionately impacted by the epidemic. In 2005, they accounted for 22% of the new AIDS diagnoses reported among young adults, but represented only 18% of the U.S young adult population. HIV/AIDS cases among Latinos vary by place of birth. Latinos born in the U.S. accounted for 34% of estimated AIDS cases among Latinos in 2006, followed by Latinos born in Puerto Rico (17%) and Mexico (17%). Source: HEALTH INITATIVE OF THE AMERICAS | UNIVERSITY OF CALIFORNIA (UC) UCBERKELEY SCHOOL OF PUBLIC HEALTH. HIV/AIDS AND LATINOSIN THE UNITEDSTATES OCTOBER 2008
 and Mexico (17%). Source: HEALTH INITATIVE OF THE AMERICAS | UNIVERSITY OF CALIFORNIA (UC) UCBERKELEY SCHOOL OF PUBLIC HEALTH. HIV/AIDS AND LATINOSIN THE UNITEDSTATES OCTOBER")
64
La Tuberculosis en los estados fronterizos con los estados Unidos de Norteamérica representan una prioridad y un verdadero reto para la Salud Pública de ambos países. México dentro de su convenio de colaboración con la USAID, para el control de la tuberculosis prioriza sus acciones de prevención y control en los estados de BC., Son., Chih., Coah., NL. y Tams., además de otros 7 estados con alto potencial de Migración: Chis., Ver., Oax., Gro., Jal,. Mich., y Zac. Prioritarios Otros con alto potencial de migración Sin proyecto USAID Situación de la Tuberculosis en la Frontera México-EUA

65
Incidencia de Tuberculosis Pulmonar Entidades Fronterizas de México y Estados Unidos de América, 2006 Tasa por 100,000 habitantes México (Fuente: DGE/SSA) Nacional: Casos: 13,813 Tasa: 13.17 Estados fronterizos: Casos: 4,587; 33.2 % del total nacional. El número de casos bajó respecto a 2005, pero el % se elevó. Estados Unidos (Fuente: MMWR CDC, Atlanta,Georgia) Nacional: Casos: 9,678 Tasa: 4.6 Desde el resurgimiento de TB 1985-1992, la tasa anual ha tenido descenso estable. En 2006, se alcanzó la tasa histórica más baja. Calif. y Tx. siguen entre los 7 estados con más de 500 casos. Estados Fronterizos: 3,358 casos, 34.7% del total nacional México 2007BCSONCHIHCOAHNLTAMPS Casos/ Tasa 1147/ 35,34 644/ 26,67 612/ 18,40 430/ 16,67 783/ 17,87 1011/ 32,67 NOTA: debido a que no hay oficialmente disponibles cifras de 2007 de EUA, la comparación de ambos es 2006, sin embargo se agrega este recuadro con la inf. de México 2007 aunque no es muy significatvo el cambio
 Nacional: Casos: 9,678 Tasa: 4.6 Desde el resurgimiento de TB , la tasa anual ha tenido descenso estable. En 2006, se alcanzó la tasa histórica más baja. Calif. y Tx. siguen entre los 7 estados con más de 500 casos. Estados Fronterizos: 3,358 casos, 34.7% del total nacional México 2007BCSONCHIHCOAHNLTAMPS Casos/ Tasa 1147/ 35,34 644/ 26,67 612/ 18,40 430/ 16,67 783/ 17, / 32,67 NOTA: debido a que no hay oficialmente disponibles cifras de 2007 de EUA, la comparación de ambos es 2006, sin embargo se agrega este recuadro con la inf. de México 2007 aunque no es muy significatvo el cambio.")
66
Población Baja California SonoraChihuahuaCoahuilaNuevo LeónTamaulipasFronteraNacional 2 993 4222 463 7073 326 8822 573 9504 337 0853 116 05418 811 100105 790 725 Casos Total 13897277245019411100538217616 Tasa 46.4029.5121.7619.4621.7035.3028.6116.65 % (del total nacional) 7.884.134.112.845.346.2430.55 Casos TBP 11636526224377811020467514746 Tasa 38.8526.4618.7016.9818.0132.7324.8513.94 % (del total nacional) 7.894.424.222.965.306.9231.70 Casos TBP Bk+ 880538424362653795365211532 Tasa 29.4021.8412.7414.0615.0625.5119.4110.90 % (del total nacional) 7.634.673.683.145.666.8931.67 Cohorte TBP Bk+ Curados 52.7373.6159.6767.4078.4177.9968.1570.72 Termino Tx 7.613.167.782.212.761.644.276.73 Fracaso 0.910.560.242.491.072.261.261.17 Defunción 7.168.7412.748.845.214.787.346.04 Abandono 13.866.513.303.597.358.188.135.56 referido 4.323.353.071.660.613.022.822.34 NO evaluados 13.414.0913.2113.814.592.148.027.43 Tuberculosis en Estados Fronterizos, 2007
 Casos TBP Tasa % (del total nacional) Casos TBP Bk Tasa % (del total nacional) Cohorte TBP Bk+ Curados Termino Tx Fracaso Defunción Abandono referido NO evaluados Tuberculosis en Estados Fronterizos, 2007")
67
Morbilidad por Tuberculosis Pulmonar* 2007 TASA* >22.03 15.48 – 22.03 8,93 – 15.47 <8.92 Fuente: SINAVE, DGE, SSA. Población a mitad del año. Indicadores demográficos 1990-2030. CONAPO. *Tasa por 100 mil habitantes. Información Preliminar Los 6 estados fronterizos con EUA rebasan la media nacional

68
Mortalidad por Tuberculosis Pulmonar* 2006 Nacional 1.81 *Tasa por cada 100,000 habitantes Fuente: Base de datos de defunciones 1997-2006; INEGI/Secretaría de Salud. Base de datos de la Vigilancia Epidemiológica de la Mortalidad año 2006 TASA* 2.40 – 3.12 1.67 – 2.39 0-80 – 1.66 0.2 – 0.79 Los 6 estados fronterizos con EUA rebasan la media nacional

69
50% de casos en tratamiento Casos de TB-MDR Estados de la Frontera Norte 2008 Programa Binacional Programa Nacional Sub-total Baja California10212517 Coahuila0441115 Chihuahua9413215 Nuevo León010 4555 Sonora*044610 Tamaulipas25934741 Totales44337776153 Fuente: Programas de Tuberculosis de los Servicios Estatales de Salud * Preliminar, consulta base de Componente TB-MDR PAET En espera de tratamiento EstadosTotal de casos En tratamiento

70
Hipertensión arterial Población Mexicana (%) Migrante nacida en México (%) Migrante nacida en EUA (%) HTA33.317.322.4 HTA con tratamiento12.944.653.9 HTA en control entre la población 3.732.137.9 HTA en control con tratamiento 29.073.656.8 Conciencia de la HTA25.248.366.2 Fuente : Barquera, S y col. Hypertension in Mexico and among mexican americans: Prevalence and treatment patterns. INSP y Loyola University Medical center, Maywood Il. EUA

71
Diabetes: 5a causa de muerte en adultos Latinos

72
Obesidad En Estados Unidos, los latinos tienen mayores tasas de obesidad que los nativos blancos. Fuente: Department of Health and Human Services, The Office of Minority Health, 2005

73
Cancer de Mama Mexicanas migrantes:Mexicanas migrantes: a mayor tiempo de estancia en EUA, mayor probabilidad de hacerse mastografía Proporción de mujeres (40 años y más) con estudio de mastografía (últimos dos años). –Mexicanas en México 4-12% –Mexicanas migrantes 49% –Americanas (blancas) 72% Fuente: CONAPO
 72% Fuente: CONAPO.")
74
Perfil de Mortalidad niños mexicanos en USA (1-12 años) 1.Lesiones por accidentes 2.Deficiencias al nacimiento 3.Cáncer
 1.Lesiones por accidentes 2.Deficiencias al nacimiento 3.Cáncer")
75
Consumo de Drogas* Cualquier droga, alguna vez en la vida. Fuente: ENA, CONADIC, INEGI, DGE MigranteNo migrante Hombre21.5%7.2% Mujer2.652.1% MigranteNo migrante Consumo de alcohol 59%12% Consumo de mariguana 5.7%1.8% Consumo cocaina 6.9%1.8% Fuente: CENSIDA/ UC

76
Fuente: U.S. Bureau of Labor Statistic, U.S. Department of labor, 2008 Accidentes mortales de trabajadores inmigrantes en Estados Unidos por región de origen, 2007

77
44% tensión muscular y lumbalgias 37% gastritis y cefaleas 25% insomnio 22% colitis Tres o más veces al mes Las mujeres cuyo cónyuge es migrante tienen 30% más probabilidad de reportar síntomas de alta calificación en relación a las mujeres cuyo compañero permanece en la comunidad El Síndrome de Penélope se caracteriza en las mujeres por estar sometidas a cargas físicas y emocionales que pueden dar lugar a trastornos tanto somáticos como psíquicos en un ambiente social de alta migración masculina Efectos a la salud en Mujeres con Familiares Migrantes

78
Físicos: Cansancio generalizado (debilidad y decaimiento) Hipertensión arterial Padecimientos metabólicos y digestivos Taquicardias, dificultad para respirar, mareos, desvanecimientos Cefaleas, migrañas, lumbalgias Emocionales: Malestar general e impreciso Ansiedad Tristeza, desánimo, falta de motivación Depresión en diversos grados Hiperactividad Nervios y poco control de las emociones Insomnio Trastornos alimentarios Sentimientos de culpa Insatisfacción sexual Trastornos en Mujeres con Familiares Migrantes
 Hipertensión arterial Padecimientos metabólicos y digestivos Taquicardias, dificultad para respirar, mareos, desvanecimientos Cefaleas, migrañas, lumbalgias Emocionales: Malestar general e impreciso Ansiedad Tristeza, desánimo, falta de motivación Depresión en diversos grados Hiperactividad Nervios y poco control de las emociones Insomnio Trastornos alimentarios Sentimientos de culpa Insatisfacción sexual Trastornos en Mujeres con Familiares Migrantes")
79
MENTAL HEALTH OF LATINOS IN THE UNITED STATES In 2006, Latino immigrants in California were more likely to have psychological distress (4.3%) than whites (3.2%), and 22.0% of Latino immigrants needed help for mental/emotional distress compared to 18.4% of whites. LATINO CHILDRENS MENTAL HEALTH Of all racial/ethnic groups, Latino children in California utilizing Medicaid have the lowest probability of using psychiatric emergency intervention (9.5% compared to 10.9% for non-Hispanic whites), and the lowest average number of psychiatric intervention visits (1.8 vs. 2.0 for non-Hispanic whites). The top three diagnoses among this group were: mood disorders (25.2% of all diagnoses), adjustment disorders (17.6%), and disruptive behavior disorders (15.4%). Source : HEALTH INITATIVE OF THE AMERICAS | UNIVERSITY OF CALIFORNIA (UC) UCBERKELEY SCHOOL OF PUBLIC HEALTH. MENTAL HEALTH OF LATINOS IN THE UNITED STTES OCTOBER 2008
, and the lowest average number of psychiatric intervention visits (1.8 vs. 2.0 for non-Hispanic whites). The top three diagnoses among this group were: mood disorders (25.2% of all diagnoses), adjustment disorders (17.6%), and disruptive behavior disorders (15.4%). Source : HEALTH INITATIVE OF THE AMERICAS | UNIVERSITY OF CALIFORNIA (UC) UCBERKELEY SCHOOL OF PUBLIC HEALTH. MENTAL HEALTH OF LATINOS IN THE UNITED STTES OCTOBER")
80
LATINOS AND ACCESS TO CARE Despite displaying greater need for mental health care, only 2.7% of Latino immigrants in California saw a health professional for emotional/mental problems compared to 11% of whites. Latinos in California may use fewer mental health services because their families may act as informal mental health care providers. They are more likely to live with their families (62% compared to 22% of whites in California) and receive family support (21.1% versus 12.3% of whites). Nationwide, some of the most commonly given reasons for not seeking mental health care include: language barriers, being too busy, lacking transportation, and a belief that the participant could handle it myself. Latinos with health care coverage were significantly more likely to seek care. Puerto Rican participants usage (66%) was much higher than that of participants from Mexico, Central, and South America (20%) MENTAL HEALTH OF LATINOS IN THE UNITED STATES Source: HEALTH INITATIVE OF THE AMERICAS | UNIVERSITY OF CALIFORNIA (UC) UCBERKELEY SCHOOL OF PUBLIC HEALTH. MENTAL HEALTH OF LATINOS IN THE UNITED STTES OCTOBER 2008
 and receive family support (21.1% versus 12.3% of whites). Nationwide, some of the most commonly given reasons for not seeking mental health care include: language barriers, being too busy, lacking transportation, and a belief that the participant could handle it myself. Latinos with health care coverage were significantly more likely to seek care. Puerto Rican participants usage (66%) was much higher than that of participants from Mexico, Central, and South America (20%) MENTAL HEALTH OF LATINOS IN THE UNITED STATES Source: HEALTH INITATIVE OF THE AMERICAS | UNIVERSITY OF CALIFORNIA (UC) UCBERKELEY SCHOOL OF PUBLIC HEALTH. MENTAL HEALTH OF LATINOS IN THE UNITED STTES OCTOBER")
81
Effect of pesticides The U.S. Environmental Protection Agency (EPA) has estimated that there are 10,000 to 20,000 incidents of physiciandiagnosed pesticide illnesses and injuries per year in farm work (while recognizing that this is a conservative estimate because of the widespread pattern of underreporting). Acute symptoms of pesticide exposure range from relatively mild headaches to fatigue, nausea, skin rashes, eye irritation, burns, paralysis, and even death. Chronic illnesses and those with delayed onsets, such as cancer, which may only appear years after exposure to pesticides, can also result. EPA has reported that of the 1.2 billion pounds of pesticides used in the United States annually, about 950 million pounds of which is used in the agriculture industry. Farmworkers are among the primary populations exposed to these pesticides. Children may be exposed to pesticides by doing farm work, by eating fruits and vegetables directly from the fields, by being caught in the drift from field applications of pesticides, or by direct contact with treated plants and soil. Children are more vulnerable than adults are to the effects of pesticides. For example, some pesticides pose a greater risk to infants and children because they breathe more and eat more than adults per unit of body weight, and their bodies and internal organs are still developing, which makes them much more susceptible to the effects of pesticides.
 has estimated that there are 10,000 to 20,000 incidents of physiciandiagnosed pesticide illnesses and injuries per year in farm work (while recognizing that this is a conservative estimate because of the widespread pattern of underreporting). Acute symptoms of pesticide exposure range from relatively mild headaches to fatigue, nausea, skin rashes, eye irritation, burns, paralysis, and even death. Chronic illnesses and those with delayed onsets, such as cancer, which may only appear years after exposure to pesticides, can also result. EPA has reported that of the 1.2 billion pounds of pesticides used in the United States annually, about 950 million pounds of which is used in the agriculture industry. Farmworkers are among the primary populations exposed to these pesticides. Children may be exposed to pesticides by doing farm work, by eating fruits and vegetables directly from the fields, by being caught in the drift from field applications of pesticides, or by direct contact with treated plants and soil. Children are more vulnerable than adults are to the effects of pesticides. For example, some pesticides pose a greater risk to infants and children because they breathe more and eat more than adults per unit of body weight, and their bodies and internal organs are still developing, which makes them much more susceptible to the effects of pesticides..")
82
Fatal injuries at work to foreign-born workers in the U.S., 2006 44% of all immigrants who suffer a fatal injury on the job are Mexicans. Farm work is one of the most dangerous jobs in the country, employing 3% of the workforce but accounting for 13% of all facilities.

83
Mexican Population Resident in United States without Medical Insurance 1992-2007

84
Immigrant Population (from Mexico and Other Regions) without Medical Insurance by Length of Stay in United States, 2007
 without Medical Insurance by Length of Stay in United States, 2007")
85
Immigrant Population (from Mexico and Other Regions) and White U.S.-born Population without Medical Insurance in United States, 2007 Source: CONAPO estimates, based on Current Population Survey (CPS), March 2007 supplement. Note: 1/Includes: Guatemala, El Salvador, Honduras, Nicaragua, Colombia and Ecuador.

86
Immigrant Population (from Mexico and Other Regions) with Medical Insurance by Citizenship Status in United States, 2007
 with Medical Insurance by Citizenship Status in United States, 2007")
87
Low-income* Immigrant Population (from Mexico and Other Regions) without Health Coverage in United States, 2007 Source: CONAPO estimates, based on Current Population Survey (CPS), March 2007 supplement. Note: 1/Includes: Guatemala, El Salvador, Honduras, Nicaragua, Colombia and Ecuador. *Income below 150% of U.S. federal poverty line.

88
Employed Immigrant Population (from Mexico and Other Regions) and White U.S.-born population without Health Coverage by Work Shift in United States, 2007
 and White U.S.-born population without Health Coverage by Work Shift in United States, 2007")
89
Immigrant Population (from Mexico and Other Regions) and Low-Income* White U.S.-Born Populationby Type of Medical Coverage in United States, 2007
 and Low-Income* White U.S.-Born Populationby Type of Medical Coverage in United States, 2007")
90
HEALTH SERVICE DISPARITIES AMONG MEXICAN IMMIGRANTS Pneumonia and influenza cause over 30,000 deaths annually in the U.S., primarily among the elderly, yet in 2000 over half of Mexican immigrants age 65 and older had not gotten a flu shot the previous year (Figure 1). The rate for immigrants was worse than that for U.S.-born Mexican Americans (43%) and U.S.-born non- Hispanic whites (33%). Immigrants of this age also had the lowest rate of pneumonia immunizations. Oral health screening and prevention have significant pay-offs in improved health and decreased costs,1 yet almost two-thirds of adult Mexican immigrants and half of U.S.-born Mexican Americans had not gotten a dental exam in the past year.
 and U.S.-born non- Hispanic whites (33%). Immigrants of this age also had the lowest rate of pneumonia immunizations. Oral health screening and prevention have significant pay-offs in improved health and decreased costs,1 yet almost two-thirds of adult Mexican immigrants and half of U.S.-born Mexican Americans had not gotten a dental exam in the past year..")
91
HEALTH SERVICE DISPARITIES AMONG MEXICAN IMMIGRANTS In 2000, Mexican immigrant women age 40 and over were the least likely to have had a mammogram in the past two years: only 49% did. U.S.-born Mexican Americans were more likely to have had a mammogram (66%), not far below the rate for U.S.-born non-Hispanic whites (72%). In 2000, Mexican immigrant women ages 18-64 were about twice as likely as U.S.-born non-Hispanic whites not to have had a pap smear test in the previous three years. U.S.-born Mexican Americans also had worse screening rates than non-Hispanic whites. Hispanics have the highest cervical cancer rate of any racial or ethnic group (not shown) in the U.S.3 Colorectal exams, including sigmoidoscopy, colonoscopy, or proctoscopy, are not common among adults age 50 and over, but are least common among Mexican immigrants.
, not far below the rate for U.S.-born non-Hispanic whites (72%). In 2000, Mexican immigrant women ages were about twice as likely as U.S.-born non-Hispanic whites not to have had a pap smear test in the previous three years. U.S.-born Mexican Americans also had worse screening rates than non-Hispanic whites. Hispanics have the highest cervical cancer rate of any racial or ethnic group (not shown) in the U.S.3 Colorectal exams, including sigmoidoscopy, colonoscopy, or proctoscopy, are not common among adults age 50 and over, but are least common among Mexican immigrants..")
92
HEALTH INSURANCE COVERAGE OF LATINOS IN THE UNITED STATES The foreign-born U.S. population is about 2.5 times more likely to be uninsured than the native-born population: 33.8% of the foreign-born population are uninsured compared to 13.2% of the native-born population IMMIGRATION STATUS AND BARRIERS TO COVERAGE Source: HEALTH INITATIVE OF THE AMERICAS | UNIVERSITY OF CALIFORNIA (UC) UCBERKELEY SCHOOL OF PUBLIC HEALTH HEALTH INSURANCE COVERAGE OF LATINOS IN THE UNITED STATES. October 2008
 UCBERKELEY SCHOOL OF PUBLIC HEALTH HEALTH INSURANCE COVERAGE OF LATINOS IN THE UNITED STATES. October")
93
Naturalization status is directly correlated to an individuals health insurance coverage: 45% of non-U.S. citizens lacked insurance in 2006 compared to 16.4% of naturalized citizens. Documented immigrants are 11% less likely than the U.S.-born population to have a usual source of health care. Undocumented immigrants are 20% less likely than the U.S.-born population to have a usual source of health care. Many immigrants face eligibility restrictions for public health coverage through Medicaid and the State Childrens Heath Insurance Plan, so the continuing decline in employer-sponsored health coverage in the U.S. is a particularly acute problem for immigrant families. Of the 4.8 million Californians interviewed in 2005, 21%, or 1,038,000, were undocumented immigrant adults. 3% or 136,000 of the uninsured were undocumented children. HEALTH INSURANCE COVERAGE OF LATINOS IN THE UNITED STATES Source: HEALTH INITATIVE OF THE AMERICAS | UNIVERSITY OF CALIFORNIA (UC) UCBERKELEY SCHOOL OF PUBLIC HEALTH HEALTH INSURANCE COVERAGE OF LATINOS IN THE UNITED STATES. October 2008
 UCBERKELEY SCHOOL OF PUBLIC HEALTH HEALTH INSURANCE COVERAGE OF LATINOS IN THE UNITED STATES. October")
94
OPORTUNIDADES OPORTUNIDADES Los programas de salud para migrantes deben ser co-responsabilidad binacional Complementarios Continuos Sincrónicos

95
Legislación EEUU. –La legislación de salud de cada estado de la Unión Americana requiere certificación vigente a los médicos y enfermeras para poder ejercer. State Medical Boards State Boards of Nursing Enfermeras certificadas –La asesoría médica telefónica es dada por enfermeras con certificación en los diferentes estados de la Unión Americana. –Los protocolos ayudan al paciente a determinar si es un caso que Es grave (sala de urgencias más cercana) Requiere atención (médico en las siguientes 48 hrs) Puede ser pasajero (recomendación y volver a llamar si persiste) Médicos certificados. –La CMT está bien delimitada para ciertos casos. 01 800 SALUD MX Programa de Apoyo por Teléfono a los Mexicanos en EU y Frontera con EU Antecedentes
 Requiere atención (médico en las siguientes 48 hrs) Puede ser pasajero (recomendación y volver a llamar si persiste) Médicos certificados. –La CMT está bien delimitada para ciertos casos SALUD MX Programa de Apoyo por Teléfono a los Mexicanos en EU y Frontera con EU Antecedentes.")
96
Experiencia en México de Consulta Médica Telefónica Asesoría médica telefónica desde 98. Protocolos de CCF. Uno de los Call Centers médicos más grandes de México. Motivos de Consulta más frecuentes: –78% de Tipificación de casos de acuerdo a la solicitud del paciente, Enfermedades Estacionales relacionadas –Golpe de frío, Golpe de Calor Crónico degenerativas y Otras –20% de Referencia en forma directa 12% constituyen requerimientos de Especialistas 8% requieren la referencia a proveedor de Servicios (Laboratorio o Gabinete) –2% de casos de Atenciones de Pacientes con una situación asumida como Crisis 1% de Casos que requirieron coordinación de una ambulancia o envío a Servicios de Urgencia 01 800 SALUD MX Programa de Apoyo por Teléfono a los Mexicanos en EU y Frontera con EU
 –2% de casos de Atenciones de Pacientes con una situación asumida como Crisis 1% de Casos que requirieron coordinación de una ambulancia o envío a Servicios de Urgencia SALUD MX Programa de Apoyo por Teléfono a los Mexicanos en EU y Frontera con EU.")
97
Operando en casi todo EEUU (menos OK y SC) Cumple con todos los requerimientos del HIPAA 91% de las consultas ser resuelven por teléfono –9% son referidas a un médico o sala de emergencias 70% de las consultas desembocan en receta médica. Motivos de consulta más frecuentes: Infecciones respiratoriasAlergias Infecciones del tractor urinario Dolores musculares Traumas Articulares Menores (esguinces y torceduras) Si no hubiera usado el servicio de CMT, ¿qué hubiera hecho? 53% Acudir a un médico general o familiar 23% Acudir a un centro de urgencias (Urgent Care Center) 9% Sala de emergencias 2% Especialista 13% No hubiera hecho nada 01 800 SALUD MX Programa de Apoyo por Teléfono a los Mexicanos en EU y Frontera con EU Experiencia en EEUU de Consulta Médica Telefónica
 Si no hubiera usado el servicio de CMT, ¿qué hubiera hecho. 53% Acudir a un médico general o familiar 23% Acudir a un centro de urgencias (Urgent Care Center) 9% Sala de emergencias 2% Especialista 13% No hubiera hecho nada SALUD MX Programa de Apoyo por Teléfono a los Mexicanos en EU y Frontera con EU Experiencia en EEUU de Consulta Médica Telefónica.")
98
Alcance del programa piloto Etapas 1. Seguro Popular mas membresía con consulta telefónica de primer (enfermera) y 2º contacto (médico), descuentos en servicios y programa de educación. Tres meses. 2. Medicina preventiva.- estudios y búsqueda de recursos adicionales. 10,000 afiliados. Tres meses 3. Repatriación de restos y seguros complementarios en EEUU Alcance geográfico California: Los Ángeles; Sacramento Texas: Dallas - Fort Worth Puntos de afiliación: Consulados (Ventanillas de Salud) Asociaciones de migrantes Michoacán (Clubes Morelia, Ucácuaro, Tupátaro, Carácuaro, Cantabria, B. Dmngz., L. Cárdenas del Rio, Purépecha, etc.) Zacatecas (Clubes Jalpa, Fresnillo, Rio Grande, Guadalupe, etc.) Guanajuato (Casa Gto.) 01 800 SALUD MX Programa de Apoyo por Teléfono a los Mexicanos en EU y Frontera con EU
 y 2º contacto (médico), descuentos en servicios y programa de educación. Tres meses. 2. Medicina preventiva.- estudios y búsqueda de recursos adicionales. 10,000 afiliados. Tres meses 3. Repatriación de restos y seguros complementarios en EEUU Alcance geográfico California: Los Ángeles; Sacramento Texas: Dallas - Fort Worth Puntos de afiliación: Consulados (Ventanillas de Salud) Asociaciones de migrantes Michoacán (Clubes Morelia, Ucácuaro, Tupátaro, Carácuaro, Cantabria, B. Dmngz., L. Cárdenas del Rio, Purépecha, etc.) Zacatecas (Clubes Jalpa, Fresnillo, Rio Grande, Guadalupe, etc.) Guanajuato (Casa Gto.) SALUD MX Programa de Apoyo por Teléfono a los Mexicanos en EU y Frontera con EU.")
99
Primera etapa 01 800 SALUD MX Programa de Apoyo por Teléfono a los Mexicanos en EU y Frontera con EU Servicios en Estados Unidos para los migrantes Mexicanos –Enfermeras en línea 24x7 –Consulta Médica Telefónica 24x7 –Descuentos en Médicos Hospitales Farmacias Dentistas Visión Quiroprácticos –Call center con: Orientación sobre el Seguro Popular (también disponible en México) –Beneficios –Ubicación de Centros de Salud en México Información de Centros de Salud de bajo costo Traducción simultánea Opciones que ofrece el sistema de Salud local Transferencia de llamadas a números 800 de apoyo gratuito. Información y promoción del Seguro Popular para el migrante y su familia en México.

100
Primera etapa (cont.) Los servicios de la membresía en Estados Unidos están respaldados por departamentos jurídicos internos que garantizan, para cada estado de la Unión Americana: Su apego a la ley, así como Seguimiento de cambios de la legislación en materia de salud y seguros Toda vez que la implementación del programa para migrantes de la Secretaría de Salud traerá beneficios para las comunidades en México que reciben sus remesas y Estados Unidos (al reducir el uso de salas de emergencia, y de recursos para traducción simultánea de pacientes), se puede acudir a instancias gubernamentales en EEUU para pedir apoyo para el programa. 01 800 SALUD MX Programa de Apoyo por Teléfono a los Mexicanos en EU y Frontera con EU

101
Segunda etapa Estudios de medicina preventiva : Mama Cáncer cervicouterino Glucosa Triglicéridos Para minimizar el impacto financiero de la segunda etapa, se buscarán entidades que ofrezcan dichos servicios de manera gratuita o a precios negociados por volumen. Programa 5 pasos para ser parte del México triunfador 01 800 SALUD MX Programa de Apoyo por Teléfono a los Mexicanos en EU y Frontera con EU

102
Tercera etapa Repatriación de restos mortales.- Dados ciertos volúmenes de afiliados, la dispersión del riesgo permitirá pronosticar la siniestralidad y con ello crear un fondo que permita financiar el costo de los casos que se presenten previa negociación con proveedores de dicho servicio. Seguros complementarios de salud en EEUU. Se sugiere que sean de costo accesible para que sean financiados directamente por los migrantes. Algunos ejemplos: Seguro de accidentes que permita cubrir los costos del uso de las salas de emergencia cuando así se amerite. Se diseñaría un producto ad hoc. Siniestralidad del 90% de los casos es inferior a US $ 2,500 con lo que una cobertura de éste tipo tiene un costo bajo. La Secretaría de Salud podría financiar un seguro de exceso ( de US $ 1,001 a 2,500) para que el costo para el migrante sea mínimo (al comprar un seguro opcional por los primeros US $ 1,000 de gasto) Seguros de indemnización por hospitalización Implementación de expediente médico electrónico. Vinculado a las UNEMEs y posteriormente al sector salud. 01 800 SALUD MX Programa de Apoyo por Teléfono a los Mexicanos en EU y Frontera con EU
 para que el costo para el migrante sea mínimo (al comprar un seguro opcional por los primeros US $ 1,000 de gasto) Seguros de indemnización por hospitalización Implementación de expediente médico electrónico. Vinculado a las UNEMEs y posteriormente al sector salud SALUD MX Programa de Apoyo por Teléfono a los Mexicanos en EU y Frontera con EU.")
103
El fenómeno de los migrantes que cada año cruzan la frontera México- Estados Unidos, tiene importantes implicaciones en la salud pública debido a que favorece el incremento de problemas de salud como VIH/SIDA, enfermedades de transmisión sexual, adicciones, padecimientos mentales, violencia intrafamiliar, nutrición y salud bucal. Los ilegales mexicanos tienen una incidencia del 88% de sufrir patologías crónicas degenerativas, como diabetes e hipertensión y aquellos que no logran pasar adicionalmente sufren un alto grado de frustración y son proclives a sufrir de algún de tipo de adicción y problemas de prostitución. El fenómeno de la migración además genera riesgos de traumatismos físicos y muerte, ante la dificultad por cruzar, y las condiciones adversas propias de la topografía y clima de la región y como consciencia de largas y duras caminatas clandestinas, situación que se prevé se agravará ante la construcción del muro fronterizo (caídas de dos ó tres metros de altura) Programa Fronterizo de Atención a la Salud
 Programa Fronterizo de Atención a la Salud.")
104
El programa de acción para el desarrollo y complemento de los albergues fronterizos en los Estados del norte del país, se sustenta en acercar los servicios médicos preventivos que actualmente la presente administración impulsa a través de las Unidades de Especialidades Médicas (UNEMES) en sus diferentes modalidades como son: Adicciones, Salud Mental, Enfermedades Crónicas, CAPASITS, entre las áreas mas relevantes de acuerdo a la siguiente distribución en los Estados del norte. 43 3 2 Cirugía Ambulatoria 2 Oncología 1 CAPASITS 8 Hemodiálisis 2 Salud Mental 5 Enfermedades Crónicas15 CAPA27 TOTAL60 Programa Fronterizo de Atención a la Salud

105
Objetivo Formando parte de la serie de acciones promovidas por la Secretaría de Salud para la atención de la salud de migrantes en el área de 100 Km. a cada uno de los lados de la frontera, que incluye 6 estados fronterizos de México y 4 de los Estados Unidos, su objetivo es coadyuvar a proteger y atender la salud de los migrantes de la frontera México-Estado Unidos en situaciones de riesgo, cuidando su integridad física, y fortaleciendo la infraestructura y acciones para la prevención y atención oportuna de mexicanos en ambos lados de la frontera Líneas de Acción Fortalecimiento de la Oferta de Servicios en la Zona Fronteriza Servicio de Atención Telefónica Fronterizo Brigadas de Salvamento Fronterizas Albergues Fronterizos Programa Fronterizo de Atención a la Salud

106
Este programa se estableció coordinación con el DIF Nacional a fin de sumar esfuerzos en su política asistencial a través del Programa Interinstitucional de Atención a Menores Fronterizos que actualmente desarrolla, a fin de que las acciones de salud queden inmersos, en lo cual la atención integral del menor repatriados quede garantizada con los siguientes servicios. Brindarle Asistencia Psicológica para determinar su situación emocional. Valoración Médica para determinar sus condiciones de salud Esquema de Referencia a una unidad medica para su atención integral Trabajo Social y Asistencia Jurídica para conformar el expediente del menor, localización y apoyo para lograr la reintegración con sus familiares Identidad Cultural para promover sus valores, desarrollo y arraigo nacionalista. Albergues Fronterizos

107
La Secretaría de Salud y el DIF Nacional esta realizando el análisis de información estadística sobre las actuales condiciones de la migración de los niños, para identificar las áreas de oportunidad para desarrollar o complementar la atención médica en los albergues fronterizos, con nuevas instalaciones médicas adjuntas a los albergues y/o el aprovechamiento de espacios físicos disponibles. Albergues Fronterizos Actualmente se tienen 25 albergues identificados en la frontera norte, entre el DIF, ONGS y del INM.

108
Esta Red de Albergues denominados de Tránsito para menores migrantes y repatriados informan las siguientes características sobre una población Migrante. Albergues Fronterizos

113
Base de Datos con registro, control, seguimiento y evaluación de la los trastornos de la salud del niño y/o niña migrante y repatriado hasta su lugar de origen Niños Y Niñas Migrantes y Repatriados en la Frontera Norte Sur de Estados Unidos Sistema de Atención Preventivo de Especialidades Médicas Diagnostico de Referencia RED DE UNEMES FRONTERIZ AS Salud Mental Salud Mental CAPASIT`S Enfermedades Crónicas Enfermedades Crónicas ADICCION ES Recepción y Tratamiento En los Servicios De Salud Estatal a los niños Repatriados a su lugar de origen Valoración y Procesos de Contrareferencia por Tratamiento Especifico Esquema de Operación y Vinculación del Sistema de Salud por Especialidad Médica para los niños Migrantes y Repatriados

114
El programa VDS busca mejorar la salud de la población mexicana en Estados Unidos, favoreciendo los conocimientos y responsabilidades del migrante mexicano, de tal forma que mejore su calidad de vida. El principal objetivo de las VDS es mejorar las condiciones de salud y el fortalecimiento de los mecanismos de prevención de enfermedades de las familias mexicanas que residen en Estados Unidos, a través de la difusión y la utilización de los programas públicos de salud, tratando de convertirse en un centro de información confiable para los mexicanos en el exterior. Los servicios que ofrecen las VDS son: 1.Inscripción en Programas Públicos de Salud. 2.Facilitar el acceso a Servicios Médicos a Clínicas u Hospitales Locales. 3.Concientizar y Educar en temas de Salud. Ventanillas de Salud

115
Actualmente, son 29 (Incluyendo la que se abrirá el 21 de noviembre del 2008 en Albuquerque, Nuevo México) Consulados de México en Estados Unidos los que ofrecen los servicios que otorgan las Ventanillas de Salud. Una de ellas es móvil, la cual es operada por el Consulado de Fresno, California. La evolución que ha tenido el Programa en cuanto a la apertura de dichas Ventanillas en los Consulados, es la siguiente: 2003Los Ángeles y San Diego 2004Chicago 2005El Paso, Mc Allen y Tucson 2006Calexico y Houston 2007Atlanta, Denver, Nueva York, Salt Lake City, San José, Washington D.C. y Yuma 2008 Austin, Brownsville, Dallas, Fresno, Las Vegas, Saint Paul, San Francisco, Santa Ana, Raleigh, Seattle, Eagle Pass, el Consulado Móvil del Fresno y Albuquerque Nota: Se contempla la próxima apertura de 2 Ventanillas de Salud más en los Consulados de Indianápolis y Miami, con lo cual se cumple la meta programada de 30 Ventanillas de Salud para el 2008. Ventanillas de Salud

116
The Bi-national Health Week Celebrated yearly since 2001 –One of the largest mobilization efforts in the US to improve the health and well-being of underserved immigrants and migrants of Latin American origin living in the United States and Canada Partners from the US and Mexico, extended to Central America, Colombia and Ecuador since 2008 –Ministries of Health and of Foreign Affairs of Mexico –All Mexican consulates in the USA are participating –Academic institutions –NGOs Activities: –Health promotion and health education activities –Workshops –Insurance referrals –Medical screenings

117
Bi-national Policy Forum on Migration and Health Convenes key stakeholders every year to discuss migrant health challenges and to explore opportunities to work collaboratively to improve the health and well-being of migrants Forum topics include: –Global health and migration –Chronic diseases –HIV/AIDS of mobile populations –Occupational health and safety –Access to health services –Workforce development –Health of vulnerable people

118
Ventanillas de Salud at 28 Mexican Consulates Implemented in the last 6 years, exist now in 28 consulates Reach 197,114 Mexican citizens visiting consulates for passports and IDs Provide health promotion and health service information, and do community outreach Collaboration of local NGOs with proffessional health educators Funded by Mexican government and mobilizing additional community resources

119
Mesoamerican project for HIV prevention among mobile groups in Central America Objectives favouring mobile populations –Extend access to quality, comprehensive HIV/AIDS prevention and care –Establish and strengthen quality HIV/AIDS prevention services –Strengthen the supportive policy environmental Participation of all countries and stakeholders in Central America –Key stakeholders at local and national levels –Government and migration authorities –Civil organizations –National AIDS Programs –International cooperations agencies Strategic and governing role of Regional Coordination Mechanism with a Presidents office Executive operations by Mexicos National Institute of Public Implementation of local activities through coordination with actors and contracting with NGOs

120
Mesoamerican Project for HIV prevention Focus in 15 transit stations in border towns Transit stations

121
Other current HIV prevention projects for mobile population in Central America, Mexico and the US-Mexico border HIV Regional Project for Central America focusing on migrant workers –Supported by World Bank, 2006-2011 Provision of comprehensive HIV care to mobile populations at the Mexico-Guatemala border and at the Mexico-US border (Nuevo Laredo) –Supported by Mexicos CENSIDA and CONACYT Regional Project for People Living with HIV/AIDS in Central America –Supported by Global Fund, 2008-2012 Diverse cross-border programs at the US-Mexico border –Supported by different governmental and NGOs initiatives in California, Texas and Arizona
 –Supported by Mexicos CENSIDA and CONACYT Regional Project for People Living with HIV/AIDS in Central America –Supported by Global Fund, Diverse cross-border programs at the US-Mexico border –Supported by different governmental and NGOs initiatives in California, Texas and Arizona")
122
Support for Primary Care for Migrants in the USA Federally Subsidized Community Health Centers –1,200 total –6,300 points of service in all 50 states –17 millon persons attended per year de personas atendidas –147 Migrant Health Centers 800,000 clients –Highly interested in collaborating with Mexican government and NGOs Clubes de Oriundos (Migrant Clubs) –Operate in many urban areas –Highly involved in providing health promotion services through contracting with state and local agencies –Collaborate with Mexican Government in a number of development initiatives –Great potential to support action in the USA
 –Operate in many urban areas –Highly involved in providing health promotion services through contracting with state and local agencies –Collaborate with Mexican Government in a number of development initiatives –Great potential to support action in the USA")
123
Challenges: access to health care Government health services –Restrictions still exist to access by non-nationals –Even when there is legal access, migrants perceptions and fears pose formidable barriers NGOs south of the US border –Complex, unruly network with diverse services –Scarce coordination between NGOs and government –There is little relation to migrants social needs –Reduced capacity to solve health problems Migrants –Self-care

124
07/05/2014124 New opportunities for collaboration

125
New opportunities to strengthen regional collaboration The Mesoamerican Public Health System –Signed as part of Mesoamerican Development Project by presidents of Mexico, Central American countries and Colombia in June 2008 –Multi-donor collaboration –National Institute of Pubic Health of Mexico leading technical development Binational Health Insurance –Has been a concern of Binational Forum since its inception –Analysis has demonstrated feasibility –Importance of having an initiative in place to support binational migrant worker agreements

126
Proposed Mesoamerican Health Initiative would address four critical changes

127
The Mesoamerican Public Health System COMISCA-M-C Donor consortium Operation Sub-receptors 5 Unidades Ejecutoras Regionales ( Receptores Principales) Regional Thematic Executive Unit ( Principal receptor) 4 MCRs TEMÁTICOS E IMSP Thematic RCMs Mesoamerican agenda Technical support MIPH Strengthening of health systems Project Approval Resource allocation Contracts Recognition Designation Strategy: To foster auto gestion of thematic Regional Coordination Mechanisms
 Regional Thematic Executive Unit ( Principal receptor) 4 MCRs TEMÁTICOS E IMSP Thematic RCMs Mesoamerican agenda Technical support MIPH Strengthening of health systems Project Approval Resource allocation Contracts Recognition Designation Strategy: To foster auto gestion of thematic Regional Coordination Mechanisms")
128
Possible Architecture for Binational Health Insurance US PHC Providers Community Health Centers Contracts Case management & coordination Comprehensive Care in Mexico MoH providers Transfers Migrants Affiliation, marketing & case approval Community agencies Promotion Referral, Articulation Agency Charter Enabling & accreditation Mexico Insurance Seguro Popular Insurance Departments Regulation Enabling & licensing Primary Care Insurers (Mx or US) Defined primary care package in the US Affiliation to health insurance in Mexico, from US
 Defined primary care package in the US Affiliation to health insurance in Mexico, from US")
129
Instrumento que permita dar atención a los migrantes tanto en USA como en México. Acuerdo entre el Seguro Popular y el Health Insurance de los USA. Programa piloto que permita medir fortalezas. CARTILLA BINACIONAL DE SALUD

130
Ciudades Hermanas Área Fronteriza. Tarjeta Binacional para TB en Migrantes, 2003- 2004 (Estudio Piloto)
.")
131
RESULTADOS DE CURACION EN PACIENTES MIGRANTES BINACIONALES MEXICO-EUA 2004- 2007. 67% curados 73% curados Resultados (I) Participación de los estados según etapa del proyecto: I Resultado comparativo del tratamiento usando o no la tarjeta binacional N= 76: de EUA a México N= 14: de México a EUA %
 Participación de los estados según etapa del proyecto: I Resultado comparativo del tratamiento usando o no la tarjeta binacional N= 76: de EUA a México N= 14: de México a EUA %.")
132
Fortalezas: Mejora en la curación, disminuye el abandono y muerte pacientes que Homologación de criterios en capacitación, promoción a la población y reconocimiento de los socios. Referencia y contrarreferencia de pacientes en México y EUA. Solicitud de Tarjeta Binacional para VIH/SIDA Solicitud de la metodología para implementar en República Dominicana-HaitíA Debilidades: El reporte mensual y la aplicación de la cédula de riesgo de migración no es consistente por los estados. La capacitación a estados con potencial migratorio no se ha consolidado en 2008 Perspectivas: Fortalecimiento del proyecto para 2009 en SLRC, Sonora-San Diego Reforzamiento de la capacitación a todos los estados con alto potencial de migración Resultados y Perspectivas del Proyecto

Presentaciones similares
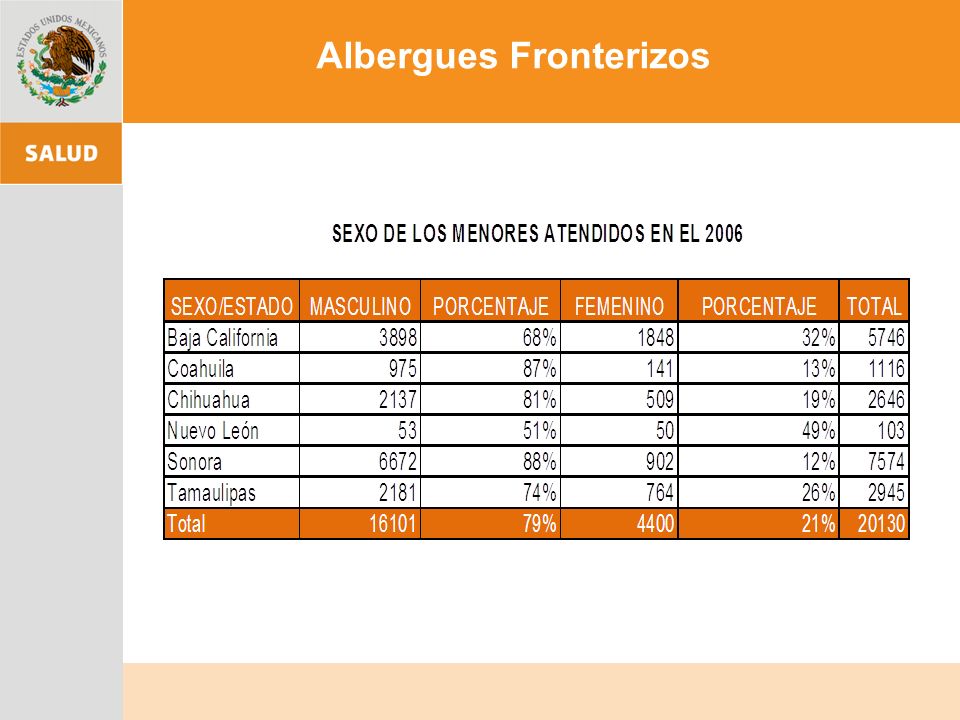
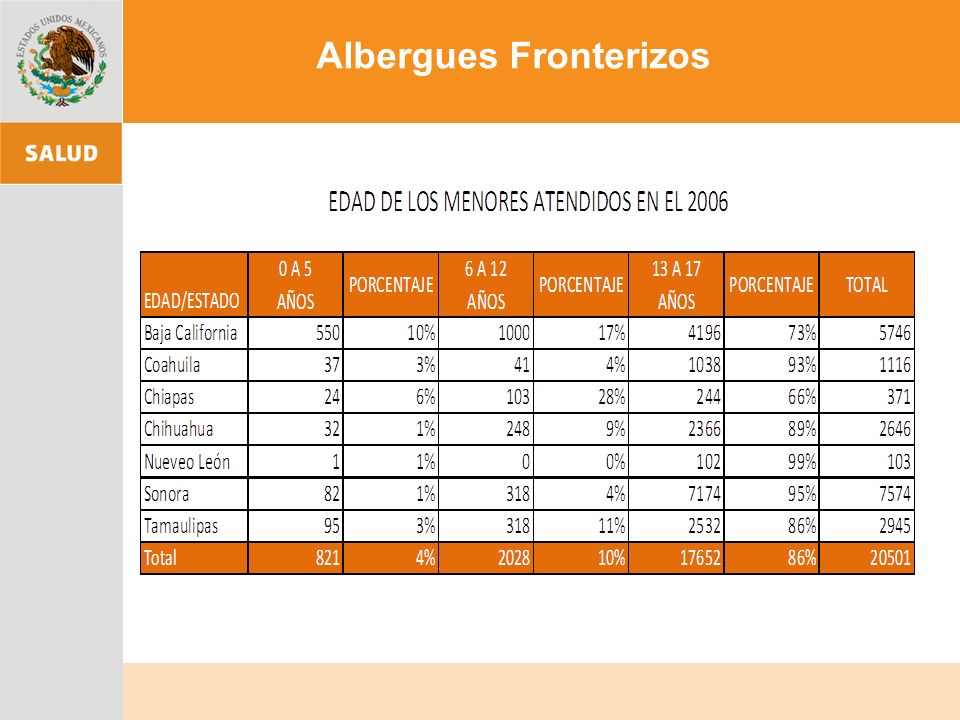
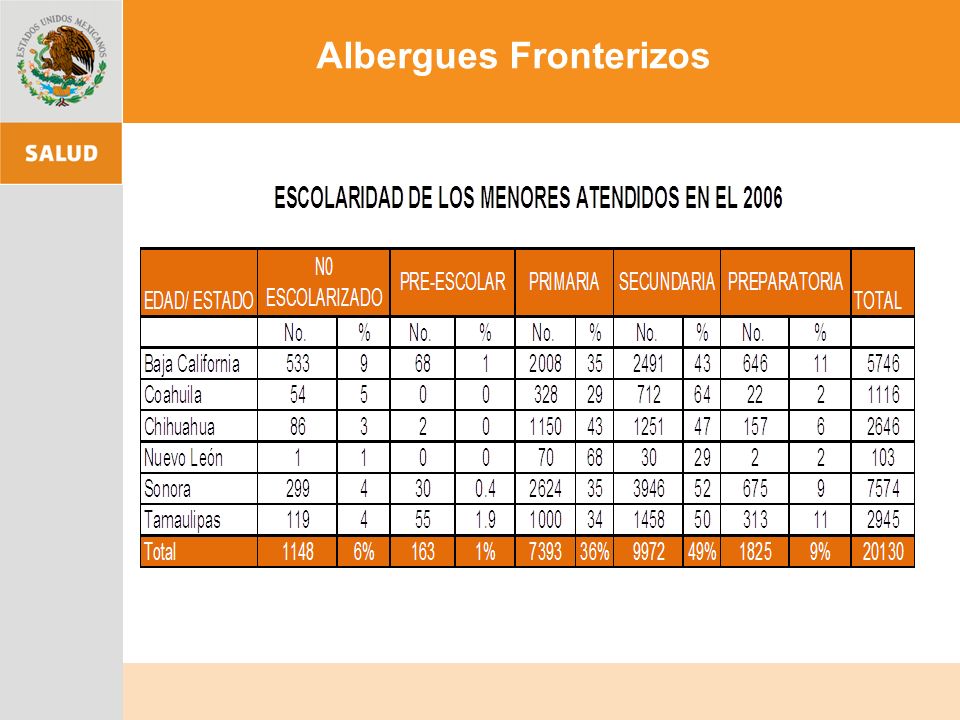
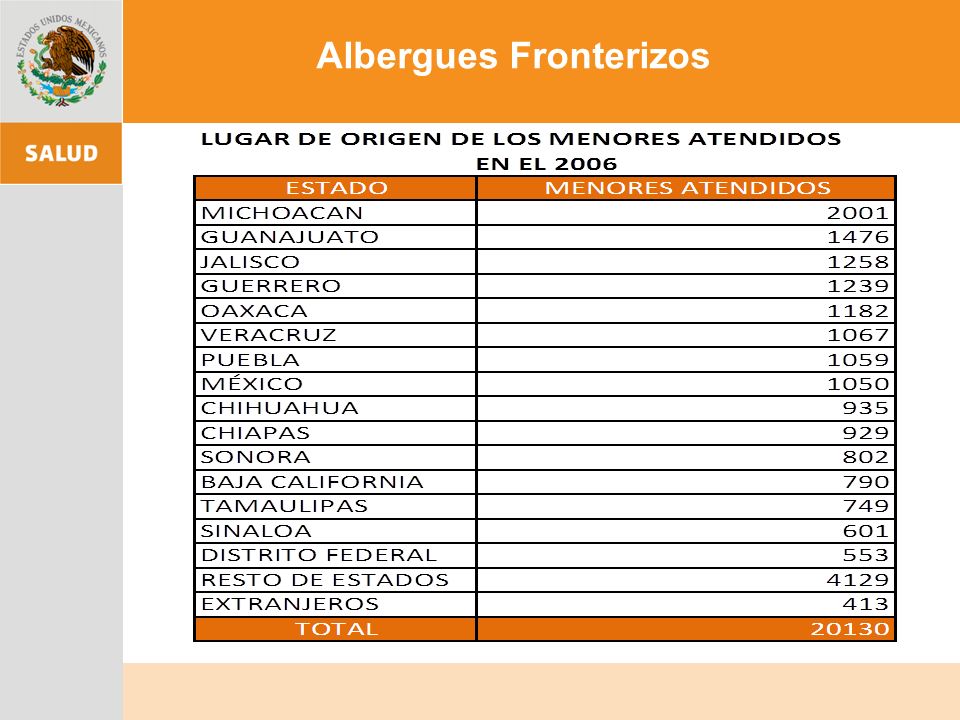

 European Transfer Credit System (ECTS) Methodology in.>")


.>")


