Descargar la presentación
La descarga está en progreso. Por favor, espere

1
Guías Europeas: Diagnóstico y Manejo de la Osteoporosis J. Kanis JY. Reginster P. D. Delmas R. Rizzoli N. Burlet C. Cooper F. Borgstrom ESCEO – IOF Osteoporosis Int (2008) 19:339-428
 19:")
2
Hueso Normal Hueso con Osteoporosis La osteoporosis se define como una enfermedad del esqueleto caracterizada por un compromiso en la resistencia del hueso que predispone a una persona a un incremento en el riesgo de fracturas. La resistencia del hueso refleja la integración de densidad y calidad óseas. Definición Actual de Osteoporosis NIH Consensus Development Panel on Osteoporosis. JAMA. 2001;285:785-95

3
Importancia de la definición Osteoporosis DMO Fracturas HTA Presión arterial ACV

4
Fracturas Vertebrales

5
Fracturas de cadera

6
Costo de la enfermedad Europa anualmente 2.7 millones de fracturas y Costo: $36 billones de Euros Osteoporos Int (2008)
")
7
Osteoporosis facts for the Orthopaedic Surgeon, American Academy of Orthopaedic Surgeons. Annual Meeting, Dalla, Tx, Feb 2002 Magnitud del problema en el mundo Estados Unidos 2000 350.000 fracturas de cadera 2050 650.000 fracturas de cadera Costo anual de fracturas de cadera 2000 = $9.8 billones En 30 años = $60 billones

8
DALY´s Osteoporos Int (2008) Skin Cervix Oesophagus Bladder Uterus Ovary Liver Prostate Oropharynx Pancreas Leukaemia Lymphoma/Myeloma Stomach Breast Colorectum Lung Osteoporosis DALY´s (000)
 Skin Cervix Oesophagus Bladder Uterus Ovary Liver Prostate Oropharynx Pancreas Leukaemia Lymphoma/Myeloma Stomach Breast Colorectum Lung Osteoporosis DALY´s (000)")
9
Habilidad para: Caminar 1Km Caminar sin ayuda Vestirse sin ayuda Subir escaleras Incapacidad a largo plazo por fractura de cadera 0 20 40 60 80 100 Antes de fractura 6 meses post-fractura

10
Diagnóstico de la enfermedad Diagnóstico, pronóstico y seguimiento

11
Edad y DMO Baja Como Predictores de Fractura Hui SL, et al. J Clin Invest 1988;81:1804-1809 DMO (g/cm 2 ) Riesgo de fractura por 1,000 personas-año Edad (años) 0 20 40 60 80 100 120 140 160 >1.00.90-0.990.80-0.890.70-0.790.60-0.69<0.60 <45 50-54 45-49 55-59 60-64 65-69 70-74 75-79 80+
 Riesgo de fractura por 1,000 personas-año Edad (años) > <0.60 <")
12
Riesgo de fractura Gradiente de riesgo: Sitio de medición Fractura foramenFractura cadera Fractura vertebral Todas las fracturas Radio distal1.7 (1.4 - 2.0)1.8 (1.4 - 2.2)1.7 (1.4 - 2.1)1.7 (1.3 - 1.6) Cuello femoral1.4 (1.4 - 1.6)2.6 (2.0 - 3.5)1.8 (1.1 - 2.7)1.6 (1.4 - 1.8) Espina lumbar1.5 (1.3 - 1.8)1.6 (1.2 - 2.2)2.3 (1.9 - 2.8)1.5 (1.4 - 1.7) Osteoporos Int (2008)
1.8 ( )1.7 ( )1.7 ( ) Cuello femoral1.4 ( )2.6 ( )1.8 ( )1.6 ( ) Espina lumbar1.5 ( )1.6 ( )2.3 ( )1.5 ( ) Osteoporos Int (2008)")
13
Riesgo de fractura DMO en cadera gradiente de riesgo 2.6 Por cada DS que baje DMO en cadera –Riesgo fx – 2.6 veces Ejemplo: –Z-score -3 en cadera vs Z-score 0 Rx Fx: 2.6 3 17.5 veces RxFx

14
T-Scores Diagnóstico T-score Normal T-score > - 1 SD T-score > - 1 SD Osteopenia - 2.5 SD <T score < -1 SD Osteoporosis T-score < -2.5 SD Osteoporosis Severa (= establecida ) T-score < -2.5 SD y al menos una fractura osteoporótica
 T-score < -2.5 SD y al menos una fractura osteoporótica")
15
Manejo NO farmacológico Osteoporos Int (2008) NúmeroFactor de riesgo 1.Mejorar movilidad 2.Mejorar balance 3.Enfermedades neuromusculares 4.Edad 5.Mejorar visión 6.Enfermedades neurológicas y C-V 7.Histroría de caídas 8.Medicaciones 9.Mejorar función cognitiva Disminuye el riesgo de fractura: prevenir caídas
 NúmeroFactor de riesgo 1.Mejorar movilidad 2.Mejorar balance 3.Enfermedades neuromusculares 4.Edad 5.Mejorar visión 6.Enfermedades neurológicas y C-V 7.Histroría de caídas 8.Medicaciones 9.Mejorar función cognitiva Disminuye el riesgo de fractura: prevenir caídas")
16
Manejo NO farmacológico Calcio1.000 mg/día Vitamina D800 UI/día Proteinas1 gr/kg/día Hiperparatiroidismo Riesgo caídas Función músculo-esquelética Osteoporos Int (2008)
")
17
Intervenciones farmacológicas mayores

18
Eficacia antifractura: vertebral Osteoporos Int (2008) InterventionStudyEntry criteria Mean age (years) Number of patients randomised Fracture incidence (percentage over 3 years) d RR (95% CI) PlaceboDrug Vertebral fracture (high-risk population) Alendronate 5-10 mg 51 Vertebral fractures, BMD 0.68 g/m 2 712.02715.08.00.53 (0.41 - 0.68) Risedronate 5 mg 55 2 vertebral fractures or 1 vertebral fracture and T-score - 2.0 692.45816.311.30.59 (0.43 - 0.82) Risedronate 5 mg 56 2 or more vertebral fractures - no bmd entry criteria 711.22629.018.00.51 (0.36 - 0.73) Raloxifene 60 mg 45 Vertebral fractures, no BMD entry criteria 667.70521.214.70.70 (0.60 - 0.90) Teriparatide 20 µg a 65 Vertebral fractures and FN or LS t-score -1 if less than 2 moderate fractures 691.63714.05.00.35 (0.22 - 0.55) Ibandronate 2.5 mg 58 Vertebral fractures and LS -5< T- score -2.0 692.9469.64.70.38 (0.25 - 0.59) FN: femoral neck; LS: lumbar spine: NA: not available a 20-month study b 4.2-year study c BMD adjusted to NHANES population d Except where indicated in column 1
 InterventionStudyEntry criteria Mean age (years) Number of patients randomised Fracture incidence (percentage over 3 years) d RR (95% CI) PlaceboDrug Vertebral fracture (high-risk population) Alendronate 5-10 mg 51 Vertebral fractures, BMD 0.68 g/m ( ) Risedronate 5 mg 55 2 vertebral fractures or 1 vertebral fracture and T-score ( ) Risedronate 5 mg 56 2 or more vertebral fractures - no bmd entry criteria ( ) Raloxifene 60 mg 45 Vertebral fractures, no BMD entry criteria ( ) Teriparatide 20 µg a 65 Vertebral fractures and FN or LS t-score -1 if less than 2 moderate fractures ( ) Ibandronate 2.5 mg 58 Vertebral fractures and LS -5< T- score ( ) FN: femoral neck; LS: lumbar spine: NA: not available a 20-month study b 4.2-year study c BMD adjusted to NHANES population d Except where indicated in column 1")
19
Eficacia antifractura: vertebral Osteoporos Int (2008) InterventionStudyEntry criteria Mean age (years) Number of patients randomised Fracture incidence (percentage over 3 years) d RR (95% CI) PlaceboDrug Vertebral fracture (high-risk population) Ibandronate 20 mg 59 Vertebral fractures and LS -5< T- score -2.0 707089.64.90.50 (0.34 - 0.74) Strontium ranelate 2 g 68 Vertebral fractures, LS BMD 0.840 g/m 2 691.64932.820.90.59 (0.48 - 0.73) Zoledronic acid 5 mg 63 FN t-score -2.5, ± vertebral fracture, or T-score -1.5 and 2+ mild or 1 moderate vertebral fracture 737.76510.93.30.30 (0.24 - 0.38) Vertebral fracture (low-risk population) Alendronate 5-10 mg b 54 FN T-score -2684.4323.82.10.56 (0.39 - 0.80) Alendronate 5-10 mg b 54 Subgroup of women, T-score <2.5 NA1.6314.02.00.50 (0.31 - 0.82) Raloxifene 60 mg 45 FN or LS T-score -2.5, ± vertebral fractures 667.7054.52.30.50 (0.40 - 0.80) FN: femoral neck; LS: lumbar spine: NA: not available a 20-month study b 4.2-year study c BMD adjusted to NHANES population d Except where indicated in column 1
 InterventionStudyEntry criteria Mean age (years) Number of patients randomised Fracture incidence (percentage over 3 years) d RR (95% CI) PlaceboDrug Vertebral fracture (high-risk population) Ibandronate 20 mg 59 Vertebral fractures and LS -5< T- score ( ) Strontium ranelate 2 g 68 Vertebral fractures, LS BMD g/m ( ) Zoledronic acid 5 mg 63 FN t-score -2.5, ± vertebral fracture, or T-score -1.5 and 2+ mild or 1 moderate vertebral fracture ( ) Vertebral fracture (low-risk population) Alendronate 5-10 mg b 54 FN T-score ( ) Alendronate 5-10 mg b 54 Subgroup of women, T-score <2.5 NA ( ) Raloxifene 60 mg 45 FN or LS T-score -2.5, ± vertebral fractures ( ) FN: femoral neck; LS: lumbar spine: NA: not available a 20-month study b 4.2-year study c BMD adjusted to NHANES population d Except where indicated in column 1")
20
Osteoporos Int (2008) InterventionStudyEntry criteria Mean age (years) Number of patients randomised Fracture incidence (percentage over 3 years) d RR (95% CI) PlaceboDrug Hip fracture Alendronate 5-10 mg 51 Vertebral fractures with BMD 0.68 g/m 2 712.0272.21.10.49 (0.23 - 0.99) Alendronate 5-10 mgb 54 FN T-score -2 c 684.4320.80.70.79 (0.43 - 1.44) Alendronate 5-10 mgb 54 FN T-score 2.5 c (subgroup analysis) NA1.6311.60.70.44 (0.18 -1.97) Risedronate 2.5 and 5 mg 57 T-score <-3c or < -2 c and 1 non-skeletal risk factor for hip fracture (subgroup analysis osteoporotic patients 70 - 79 years) 779.3313.21.90.60 (0.40 - 0.90) FN: femoral neck; LS: lumbar spine: NA: not available a 20-month study b 4.2-year study c BMD adjusted to NHANES population d Except where indicated in column 1 Eficacia antifractura: cadera
 InterventionStudyEntry criteria Mean age (years) Number of patients randomised Fracture incidence (percentage over 3 years) d RR (95% CI) PlaceboDrug Hip fracture Alendronate 5-10 mg 51 Vertebral fractures with BMD 0.68 g/m ( ) Alendronate 5-10 mgb 54 FN T-score -2 c ( ) Alendronate 5-10 mgb 54 FN T-score 2.5 c (subgroup analysis) NA ( ) Risedronate 2.5 and 5 mg 57 T-score <-3c or < -2 c and 1 non-skeletal risk factor for hip fracture (subgroup analysis osteoporotic patients years) ( ) FN: femoral neck; LS: lumbar spine: NA: not available a 20-month study b 4.2-year study c BMD adjusted to NHANES population d Except where indicated in column 1 Eficacia antifractura: cadera")
21
Osteoporos Int (2008) InterventionStudyEntry criteria Mean age (years) Number of patients randomised Fracture incidence (percentage over 3 years) d RR (95% CI) PlaceboDrug Hip fracture Raloxifene 60 and 120 mg 45 FN or LS T-score -2.5, ± vertebral fractures 667.7050.70.81.10 (0.60 - 1.90) Strontium ranelate 2 g 69 Osteoporosis (T-score < - 2.5) with or without prior fracture 774.9323.42.90.85 (0.61 - 1.19) Strontium ranelate 2 g 69 Age 74 with T-score - 2.4 c (subgroup analysis) 801.9776.44.30.64 (0.412 - 0.997) Zoledronic acid 5 mg 63 FN T-score -2.5 or less, ± vertebral fracture, or T- score -1.5 and 2+ mild or 1 moderate vertebral fracture 737.7651.42.50.59 (0.42 - 0.83) FN: femoral neck; LS: lumbar spine: NA: not available a 20-month study b 4.2-year study c BMD adjusted to NHANES population d Except where indicated in column 1
 InterventionStudyEntry criteria Mean age (years) Number of patients randomised Fracture incidence (percentage over 3 years) d RR (95% CI) PlaceboDrug Hip fracture Raloxifene 60 and 120 mg 45 FN or LS T-score -2.5, ± vertebral fractures ( ) Strontium ranelate 2 g 69 Osteoporosis (T-score < - 2.5) with or without prior fracture ( ) Strontium ranelate 2 g 69 Age 74 with T-score c (subgroup analysis) ( ) Zoledronic acid 5 mg 63 FN T-score -2.5 or less, ± vertebral fracture, or T- score -1.5 and 2+ mild or 1 moderate vertebral fracture ( ) FN: femoral neck; LS: lumbar spine: NA: not available a 20-month study b 4.2-year study c BMD adjusted to NHANES population d Except where indicated in column 1")
22
Eficacia antifractura Osteoporos Int (2008) Efecto riesgo de fractura vertebralEfecto riesgo de fractura no vertebral Osteoporosis Osteoporosis establecida Osteoporosis Osteoporosis establecida Alendronate++NA+ (incluida cadera) Risedronate++NA+ (incluida cadera) IbandronateNA+ + b Zoledronic acid++NANA (+) c HRT++++ Raloxifene++NA Teriparatide and PTHNA+ + Strontium ranelate++ + (incluida cadera) NA: not evidence available +: effective drug a Women with a prior vertebral fracture b In subsets of patients only (post-hoc analysis) c Mixed group of patients with or without prevalent vertebral fractures
 Efecto riesgo de fractura vertebralEfecto riesgo de fractura no vertebral Osteoporosis Osteoporosis establecida Osteoporosis Osteoporosis establecida Alendronate++NA+ (incluida cadera) Risedronate++NA+ (incluida cadera) IbandronateNA+ + b Zoledronic acid++NANA (+) c HRT++++ Raloxifene++NA Teriparatide and PTHNA+ + Strontium ranelate++ + (incluida cadera) NA: not evidence available +: effective drug a Women with a prior vertebral fracture b In subsets of patients only (post-hoc analysis) c Mixed group of patients with or without prevalent vertebral fractures")
23
Marcadores de recambio óseo Utilidad en seguimiento del tto Utilidad en adherencia del tto Utilidad en persistencia del tto

24
Valorando el riesgo de fractura Riesgo a diez años fractura de cadera en Suecia Osteoporos Int (2008) Edad (años)PoblaciónT-score = -1T-score -1T-score = -2.5T-score -2.5 450.4 0.81.42.2 500.60.51.11.72.9 551.20.72.02.95.1 602.31.13.34.47.8 653.91.55.05.910.9 707.32.08.38.816.7 7511.72.311.811.121.5 8015.52.514.611.523.8 8516.12.114.710.021.9
 Edad (años)PoblaciónT-score = -1T-score -1T-score = -2.5T-score")
25
Osteoporos Int (2008) Valorando el riesgo de fractura Osteoporos Int (2008) Indicador de riesgo Sin BMDCon BMD RR95% CIRR95% CI IMC (20 v 25 kg/m 2 )1.951.71 - 2.221.421.23 - 1.65 (30 v 25 kg/m 2 )0.830.69 - 0.991.000.82 - 1.21 Fractura previa despues de 50 años1.851.58 - 2.171.621.30 - 2.01 Historia familiar fractura de cadera2.271.47 - 33.492.281.48 - 3.51 tabaquismo1.841.52 - 2.221.601.27 - 2.02 Uso de corticoides2.311.67 - 3.202.251.60 - 3.15 Ingesta alcohol1.681.19 - 2.361.701.20 - 2.42 Artritis reumatoidea1.951.11 - 3.421.730.94 - 3.20
 Valorando el riesgo de fractura Osteoporos Int (2008) Indicador de riesgo Sin BMDCon BMD RR95% CIRR95% CI IMC (20 v 25 kg/m 2 ) (30 v 25 kg/m 2 ) Fractura previa despues de 50 años Historia familiar fractura de cadera tabaquismo Uso de corticoides Ingesta alcohol Artritis reumatoidea")
26
Algoritmo de manejo UK Osteoporos Int (2008) Mujeres con CRFs Otros CRFs Fractura previa por fragilidad Considerar tratamiento Edad 65+ Edad < 65 Considerar tratamiento BMDBMD Historia familiar de fractura de cadera Tratamiento: T-score < -1 T-score < -1 Historia familiar de fractura de cadera Tratamiento: T-score < -1 T-score < -1 GlucocorticoidesTratamiento: T-score < -2 T-score < -2GlucocorticoidesTratamiento: Causas secundarias de OP Tabaquismo, alcohol Tratamiento: T-score < -2.5 T-score < -2.5 Causas secundarias de OP Tabaquismo, alcohol Tratamiento: T-score < -2.5 T-score < -2.5
 Mujeres con CRFs Otros CRFs Fractura previa por fragilidad Considerar tratamiento Edad 65+ Edad < 65 Considerar tratamiento BMDBMD Historia familiar de fractura de cadera Tratamiento: T-score < -1 T-score < -1 Historia familiar de fractura de cadera Tratamiento: T-score < -1 T-score < -1 GlucocorticoidesTratamiento: T-score < -2 T-score < -2GlucocorticoidesTratamiento: Causas secundarias de OP Tabaquismo, alcohol Tratamiento: T-score < -2.5 T-score < -2.5 Causas secundarias de OP Tabaquismo, alcohol Tratamiento: T-score < -2.5 T-score < -2.5")
27
Impacto de la visión integral Osteoporos Int (2008) Age (years) Number of DXA tests/1000 Number of high risk women identified/1000 * Number of hip fractures expected * Number of hip fractures avoided (cost/avoided fracture £000 EURWHOEURWHOEURWHO 504502641<110.1 (174)0.4 (63) 604505265240.7 (37)1.2 (22) 7050012035516305.7 (5)10.6 (3) 80550235606519217.9 (1.8)32.0 (1.2) * In women at high risk
 Age (years) Number of DXA tests/1000 Number of high risk women identified/1000 * Number of hip fractures expected * Number of hip fractures avoided (cost/avoided fracture £000 EURWHOEURWHOEURWHO <110.1 (174)0.4 (63) (37)1.2 (22) (5)10.6 (3) (1.8)32.0 (1.2) * In women at high risk")
28
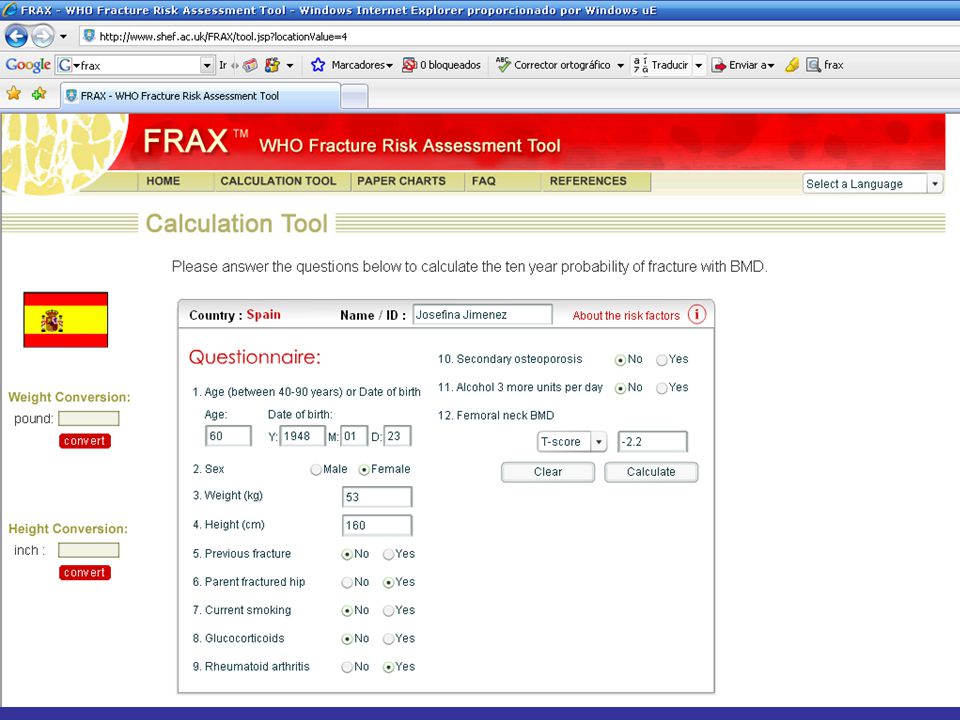
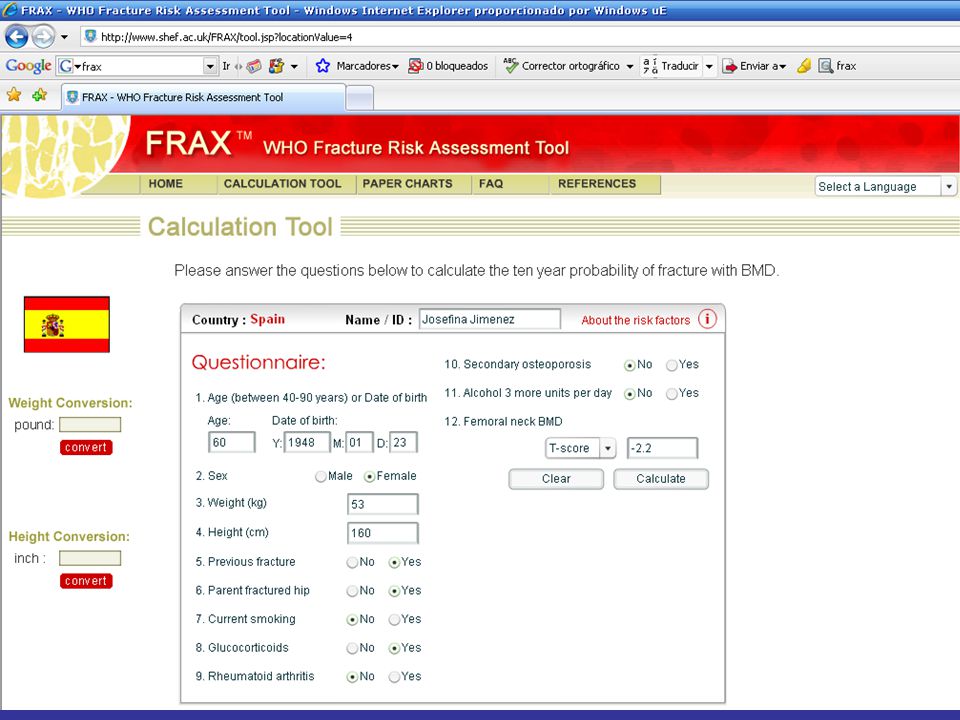
FRAX Herramienta de la WHO que integra DMO y factores de riesgo clínicos para calcular a 10 años el riesgo de fractura de cadera ó fracturas osteoporóticas mayores* (http://www.shef.ac.uk/FRAX) * Vertebral Clinica, cadera, húmero, antebrazo

30
Países en riesgo Osteoporos Int (2008) Categoría de riesgoPaís tipoPaises Similares Muy altoSwedenDenmark Iceland Norway AltoUK Italy Germany Finland Germany Greece Hungary Netherlands Portugal Switzerland MedioFrance Spain BajoTurkey
 Categoría de riesgoPaís tipoPaises Similares Muy altoSwedenDenmark Iceland Norway AltoUK Italy Germany Finland Germany Greece Hungary Netherlands Portugal Switzerland MedioFrance Spain BajoTurkey")
31
FRAX Numero de CRFs BMD T-score (femoral neck) -4.0-3.0-2.001.0 023127.75.54.64.1 132 (29 - 37)18 (15 - 21)11 (8.2 - 14)8.0 (5.5 - 11)6.8 (4.5 - 9.5)6.0 (3.9 - 8.4) 244 (38 - 54)25 (19 -34)16 (10 - 24)12 (6.7 - 18)9.8 (5.4 - 16)8.6 (4.6 - 14) 358 (48 - 68)35 (25 - 49)23 (14 - 36)16 (8.7 - 28)14 (6.9 - 25)12 (5.9 - 22) 471 (59 - 78)46 (35 - 59)31 (22 - 44)22 (14 - 35)19 (11 - 31)17 (9.4 - 28) Osteoporos Int (2008)
 ( )18 ( )11 ( )8.0 ( )6.8 ( )6.0 ( ) 244 ( )25 (19 -34)16 ( )12 ( )9.8 ( )8.6 ( ) 358 ( )35 ( )23 ( )16 ( )14 ( )12 ( ) 471 ( )46 ( )31 ( )22 ( )19 ( )17 ( ) Osteoporos Int (2008)")
36
Algoritmo para valorar el riesgo de fractura Osteoporos Int (2008) CRFsCRFs Probabilidad de fractura IntermediaIntermediaBajaBaja TratamientoTratamiento AltaAlta BMDBMD Valorar probabilidad AltaAltaBajaBaja TratamientoTratamiento
 CRFsCRFs Probabilidad de fractura IntermediaIntermediaBajaBaja TratamientoTratamiento AltaAlta BMDBMD Valorar probabilidad AltaAltaBajaBaja TratamientoTratamiento")
Presentaciones similares


 15,000 Mexicanos 43.2% HAS (Salud Publica de México 2010) EUA 1999-2000 29-31% >18 años 58-65.>")


