Descargar la presentación
La descarga está en progreso. Por favor, espere

1
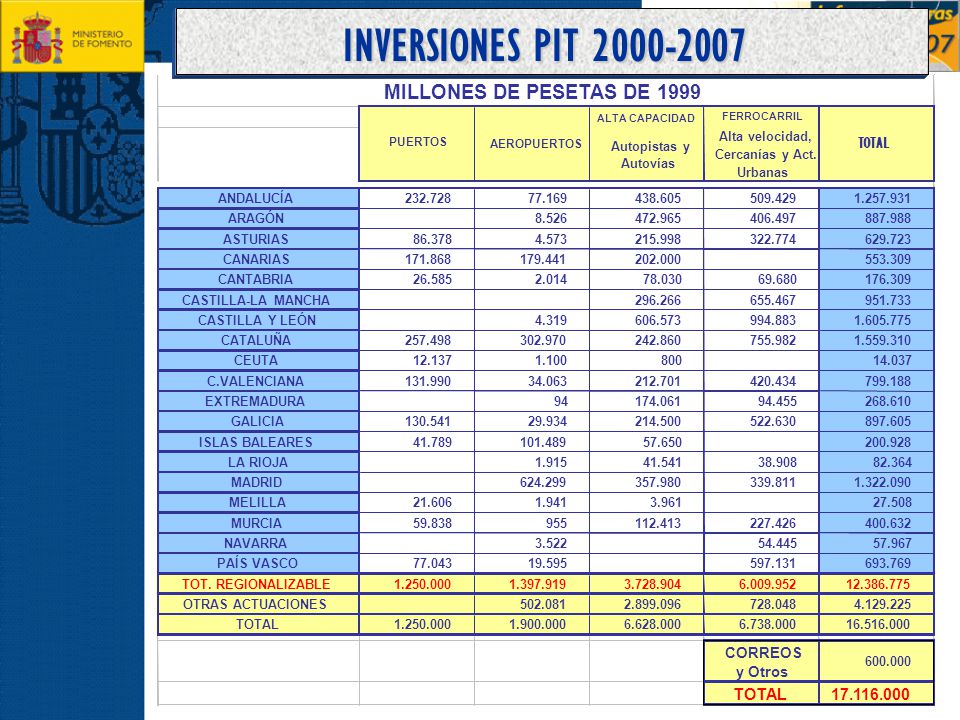
INVERSIONES PIT 2000-2007

3
PIT 2000-2007 EN ARAGÓN M.PTAS AUTOVÍAS 2.842,6 472.965 FERROCARRILES 2.443,1 406.497 AEROPUERTOS 51,2 8.526 TOTAL ARAGÓN 5.336,9 887.988 INVERSIÓN TERRITORIALIZADA PRESUPUESTO M. M.€

4
PIT 2000-2007 EN ARAGÓN CARRETERAS 3.396,4 565.120 FERROCARRILES 2.581,9 429.596 AEROPUERTOS 69,6 11.588 TOTAL ARAGÓN 6.155,1 1.024.118 CORREOS Y OTROS 107,2 17.814 INVERSIÓN TOTAL PRESUPUESTO M.PTAS M. M.€

5
CREACIÓN DE EMPLEO

6
225.000 puestos de trabajo / año Al final del Plan 102.869 M€ 17,1 Bptas 1,4% PIB anual de inversion 32% stock de capital neto 550.000 empleos permanentes Suponen cada año Que requieren durante la construcción Mayor productividad 5,2% PIB (una vez ejecutado todo el Plan) CREACIÓN DE EMPLEO DEL PIT 2000-2007
 CREACIÓN DE EMPLEO DEL PIT")
7
13.400 puestos de trabajo / año 5.155 M€ 1,02 Bptas 17.000 empleos permanentes EMPLEO GENERADO DURANTE LA CONSTRUCCIÓN EMPLEO DERIVADO DEL INCREMENTO DEL “STOCK” DE INFRAESTRUCTURAS ARAGÓN (AL FINAL DEL PLAN) CREACIÓN DE EMPLEO DEL PIT 2000-2007
 CREACIÓN DE EMPLEO DEL PIT")
Presentaciones similares