Descargar la presentación
La descarga está en progreso. Por favor, espere

1
Private enrollment Japan: 1994 -- 75%; 2000 -- 77.1% Brazil: 1994 -- 60%; 2003 -- 70.8% Chile: 1994 -- 28.4%; 2000 -- 71% Argentina: 1994 – 16%; 2001 -- 25.7% Mexico: 1994 -- 17%; 2003 -- 33.1%

2
Mexican Higher Education 2004-2005 School year –2,847 “Schools” of Higher Education –1,604 private –2.5 Million students (aprox) –2,087,698 in “Licenciatura” –146,308 in Normal (Teacher ed) –67,000 in Técnico superior (2 yr progr) –150,852 in Graduate Ed (M.A. most)
.")
3
Accumulated increase in licenciatura. Base 1990-1991 1990-1991 898,934 --- 1991-1992 948,008 49,079 1992-1993 909,815 10,881 1993-1994 942,631 43,697 1994-1995 949,196 50,262 1995-1996 996,777 97,843 1996-19971´010,452 112,000 1997-19981´056,262 157,328 1998-19991´104,420 205,486 1999-20001´160,034 261,100 2000-20011´192,959 294,025 2001-20021´253,313 354,379 2002-20031´310,734 411,800 2003-20041´374,835 475,901 2004-20051´425,480 526,546 1990-1991 198,207 ----- 1991-1992 215,969 17,762 1992-1993 234,362 36,155 1993-1994 250,061 51,854 1994-1995 267,977 69,770 1995-1996 298,269 100,062 1996-1997 319,216 121,009 1997-1998 357,781 159,574 1998-1999 411,673 213,466 1999-2000 469,124 270,917 2000-2001 525,058 326,851 2001-2002 577,189 378,982 2002-2003 620,897 422,690 2003-2004 648,769 450,562 2004-2005 662,218 464,011 public private

4
Private enrollment by type of institution (%)
")
5
Type of institution Enroll ment 2000- 2001 % Enroll ment 2001- 2002 % Enroll ment 2002- 2003 % High profile 214,20043.12220,54239.09229,81636.98 Mid profile67,83513.6679,46314.0889,06814.33 Low profile 214,69643.22264,25746.83302,65448.69 Total496,731100.00564,262100.00621,538100.00

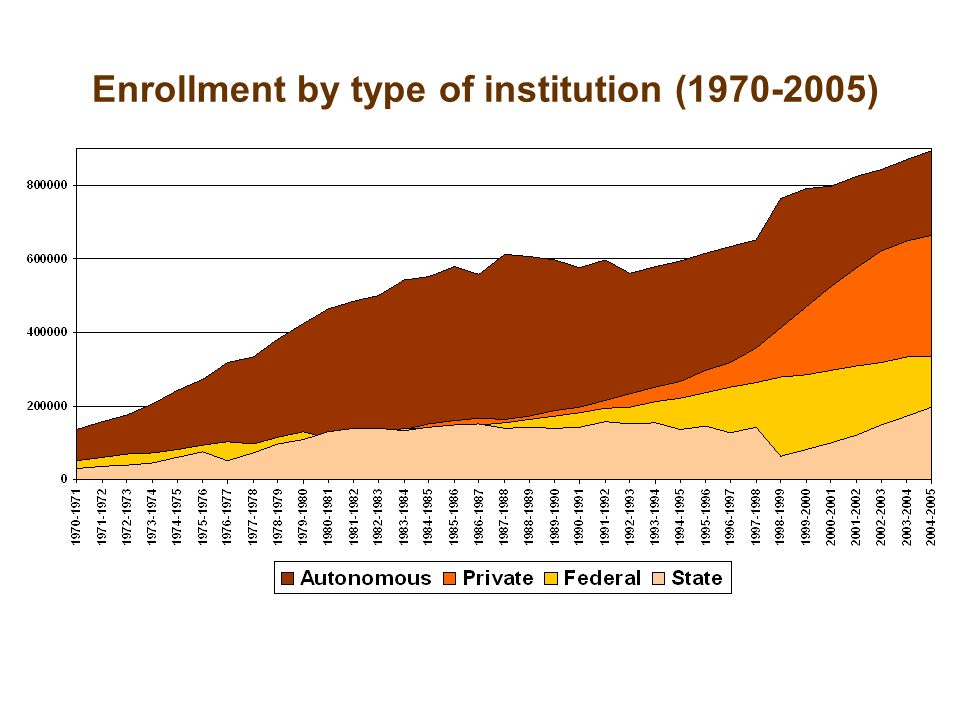
6
Enrollment by type of institution (1970-2005)
")
8
Enrollment trend by type of institution (1990-2003)
")
9
“Expansión y diversificación de la matrícula de la educación superior en México.” For the year 2004: –Expected 533,853 students in private –Actual 646,064 students

10
2000-2001 2001-2002 2002-2003 2003-2004 Guanajuato (65) Yucatán (49) Puebla (48) Chiapas (47) N. León (47) Morelos (46) Jalisco (42) Edo. México (41) D. Federal (38) Querétaro (36) Hidalgo (34) Tamaulipas (33) MÉXICO (33.1) Veracruz (32) Coahuila (29) B. California (25) Aguascalientes (24) San Luis P. (23)++ B. C. Sur (22)### Nayarit (21)*** Chihuahua (19) Quintana Roo (19) Durango (19) Oaxaca (17) Tabasco (15) Michoacán (14) Sinaloa (12) Guerrero (12) Tlaxcala (11) Sonora (10) Zacatecas (9) Campeche (8) Colima (7) Guanajuato (59) Puebla (47) Chiapas (46) Jalisco (44) Yucatán (43) N. León (42) Morelos (37) Edo. México (37) D. Federal (36) Querétaro (33) Tamaulipas (31) Veracruz (31) MÉXICO (30.6) B. C. Sur (30)### Coahuila (29) Hidalgo (27) B. California (20) Aguascalientes (20) Durango (20) Chihuahua (19) Quintana Roo (18) San Luis P. (17)++ Michoacán (15) Oaxaca (12) Tlaxcala (12) Tabasco (10) Sinaloa (10) Sonora (9) Nayarit (8)*** Guerrero (8) Zacatecas (7) Campeche (5) Colima (5) Guanajuato (60) Chiapas (48) Puebla (46) Yucatán (45) N. León (45) Jalisco (44) Morelos (42) Edo. México (37) D. Federal (37) Querétaro (34) Tamaulipas (34) Veracruz (32) MÉXICO (31.5) Coahuila (28) B. C. Sur (26)### Hidalgo (26) B. California (24) Chihuahua (20) Durango (19) San Luis P. (19)++ Aguascalientes (19) Quintana Roo (19) Oaxaca (15) Michoacán (15) Tlaxcala (12) Tabasco (11) Sinaloa (11) Nayarit (9)*** Sonora (9) Guerrero (8) Zacatecas (7) Campeche (7) Colima (5) Guanajuato (61) Yucatán (46) Puebla (45) Chiapas (46) N. León (45) Morelos (44) Jalisco (42) Edo. México (39) D. Federal (37) Tamaulipas (34) Querétaro (33) Veracruz (33) MÉXICO (32.1) Coahuila (26) B. California (25) Hidalgo (25) B. C. Sur (25)### San Luis P. (21)++ Chihuahua (20) Aguascalientes (20) Durango (20) Quintana Roo (18) Oaxaca (17) Nayarit (15)*** Tabasco (14) Michoacán (14) Sinaloa (12) Guerrero (12) Tlaxcala (11) Zacatecas (10) Sonora (9) Campeche (9) Colima (6) 8 11 13 7 10 15 7 9 16 6 9 17
 Morelos (46) Jalisco (42) Edo. México (41) D. Federal (38) Querétaro (36) Hidalgo (34) Tamaulipas (33) MÉXICO (33.1) Veracruz (32) Coahuila (29) B. California (25) Aguascalientes (24) San Luis P. (23)++ B. C. Sur (22)### Nayarit (21)*** Chihuahua (19) Quintana Roo (19) Durango (19) Oaxaca (17) Tabasco (15) Michoacán (14) Sinaloa (12) Guerrero (12) Tlaxcala (11) Sonora (10) Zacatecas (9) Campeche (8) Colima (7) Guanajuato (59) Puebla (47) Chiapas (46) Jalisco (44) Yucatán (43) N. León (42) Morelos (37) Edo. México (37) D. Federal (36) Querétaro (33) Tamaulipas (31) Veracruz (31) MÉXICO (30.6) B. C. Sur (30)### Coahuila (29) Hidalgo (27) B. California (20) Aguascalientes (20) Durango (20) Chihuahua (19) Quintana Roo (18) San Luis P. (17)++ Michoacán (15) Oaxaca (12) Tlaxcala (12) Tabasco (10) Sinaloa (10) Sonora (9) Nayarit (8)*** Guerrero (8) Zacatecas (7) Campeche (5) Colima (5) Guanajuato (60) Chiapas (48) Puebla (46) Yucatán (45) N. León (45) Jalisco (44) Morelos (42) Edo. México (37) D. Federal (37) Querétaro (34) Tamaulipas (34) Veracruz (32) MÉXICO (31.5) Coahuila (28) B. C. Sur (26)### Hidalgo (26) B. California (24) Chihuahua (20) Durango (19) San Luis P. (19)++ Aguascalientes (19) Quintana Roo (19) Oaxaca (15) Michoacán (15) Tlaxcala (12) Tabasco (11) Sinaloa (11) Nayarit (9)*** Sonora (9) Guerrero (8) Zacatecas (7) Campeche (7) Colima (5) Guanajuato (61) Yucatán (46) Puebla (45) Chiapas (46) N. León (45) Morelos (44) Jalisco (42) Edo. México (39) D. Federal (37) Tamaulipas (34) Querétaro (33) Veracruz (33) MÉXICO (32.1) Coahuila (26) B. California (25) Hidalgo (25) B. C. Sur (25)### San Luis P. (21)++ Chihuahua (20) Aguascalientes (20) Durango (20) Quintana Roo (18) Oaxaca (17) Nayarit (15)*** Tabasco (14) Michoacán (14) Sinaloa (12) Guerrero (12) Tlaxcala (11) Zacatecas (10) Sonora (9) Campeche (9) Colima (6)")
11
Enrollment by type of institution (%)
")
12
Graduates from private HEIs 1991-2000 Religion 100% Graph Design 56% Marketing 51% Comunication 44% Administration 42% Turism 36% Normal Educ. 35% Industrial Des 34% Sea Sc. 0% Forestal 0% Geography0% Archive st. 0% Topopgraphy 0% Biology 1% Theatre y film 1% Antrop y Arq 3% Agronomy 4% Chemistry 4%

13
1994 a 2004 Money for Public HEIs grew 33.5% Public HEIs enrollment grew 66.1%. Thousands of pesos (2003) Total public% 199435,984,465.3100 199533,571,840.496.30 199632,968,554.691.62 199735,710,849.599.24 199838,681,505.2107.5 200041,596,246.7115.60 200246,036,337.2127.93 200348,028,141.1133.47 200448,004,560.4133.47 Health Debt Poverty reduction Drug fight National security Crime fight
 Total public% ,984, ,571, ,968, ,710, ,681, ,596, ,036, ,028, ,004, Health Debt Poverty reduction Drug fight National security Crime fight.")
14
Private Growth and Low-Profile institutions

Presentaciones similares


 8.6% (2T-2014)>")


