Descargar la presentación
La descarga está en progreso. Por favor, espere

1
Aplicaciones Biológicas de la Espectrometría de Masa
Matías Möller

2
Espectrometría en Tándem: Secuenciación de péptidos
Espectrometría de masa MS/MS Espectrometría en Tándem: Secuenciación de péptidos

3
MS/MS: Espectrometría en Tándem
Espectrometría de masa MS/MS: Espectrometría en Tándem Seleccionar uno de los iones de la muestra, fragmentarlo y estudiar la formación de iones “hijos” mp+ md+ + mn0 Aplicaciones: Identificación de moléculas Secuenciación de péptidos “al vuelo” Modificaciones posttraduccionales

4
MS/MS: Espectrometría en Tandem
Espectrometría de masa MS/MS: Espectrometría en Tandem ESI-Q Q1Q2Q3: Triple Cuadrupolo. Q1 y Q3 separan iones moleculares, mientras Q2 sirve de cámara de colisión: Se introduce un gas para que los iones acelerados choquen y se fragmenten CID: Collision Induced Dissociation Se usa mucho para realizar cuantificaciones por LC-MS-MS

5
Mass Ionization Analysis Digestion peptides peptides protein MS m/z +

6
Mass Analysis Digestion Ionization Isolation Fragmentation peptide
fragments protein peptides ++ + + + ++ ++ + + + + + + + + ++ + Mass Analysis Digestion Ionization Isolation Fragmentation MS Isolation MS/MS m/z m/z m/z

7
Analyse Fragment Masses
Tandem en el espacio MS Analyse Parent Masses MS/MS Select Parent Fragment Analyse Fragment Masses

8
Secuenciación peptídica
MS/MS Secuenciación peptídica Mezcla de péptidos MS/MS + 1 péptido seleccionado para MS/MS Espectro MS/MS: masa de los fragmentos Espectro MS Carlos Cerveñansky

9
MS/MS: Espectrometría en Tandem
ESI-IT IT: Trampa de Iones La trampa de iones puede analizar los iones de una muestra MS También puede seleccionar uno, y concentrarlo en la trampa Luego se introduce Helio para que los iones acelerados choquen y se fragmenten Luego se analizan los iones hijo CID: Collision Induced Dissociation Las trampas de iones tienen capacidad de hacer MSn se seleccionan iones hijo se fragmentan, analizan, seleccionan uno fragmentan, analizan, seleccionan uno hasta que les de la sensibilidad MS2

10
Tandem en el tiempo Isolate Parent Ion Intact ions Intact ion This analysis/isolation/fragmentation can be carried out in an ion trap Fragment 426.7 Daughters

11
MS/MS: Espectrometría en Tandem
Espectrometría de masa MS/MS: Espectrometría en Tandem MALDI-TOF Iones moleculares que se fragmentan durante el vuelo llegan juntos al “reflector” y pueden ser analizados por el mismo. PSD: Post Source Decay

12
ESQUEMA: Instrumento de tecnología MALDI-TOF
Camera Laser plate Pumping Beam guide Timed ion selector Reflector Linear detector Extraction grids

13
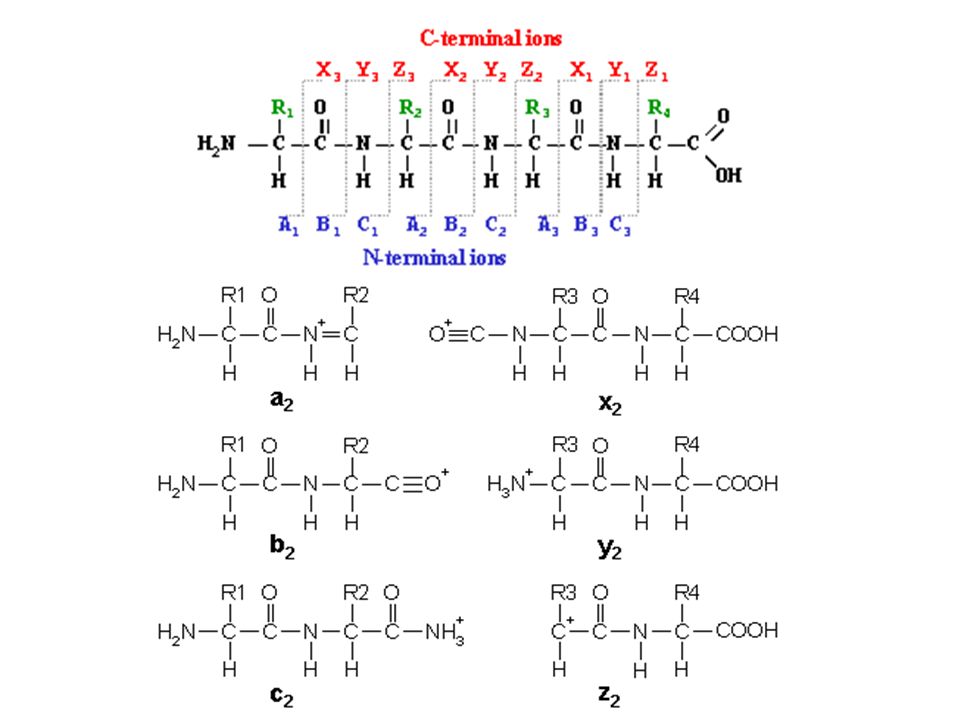
C-terminal N-terminal

14
y ions b ions b1 b2 b3 b4 y4 y3 y2 y1 IV. Determining the amino acid sequence of a peptide. By using tandem mass spectrometry, data specific to an individual peptide is collected. Fragmentation information can be used to determine the amino acid sequence of a peptide. Shown is the manner in which peptides fragment by the bonds that have been observed to dissociate. The most common fragment ions are the b and y-type ions, which provide overlapping information about the sequence.

15
CID F L G K + b1 b2 b3 y3 y2 y1 b1 b2 b3 y1 y2 y3 L F K G
Relative Intensity m/z

16
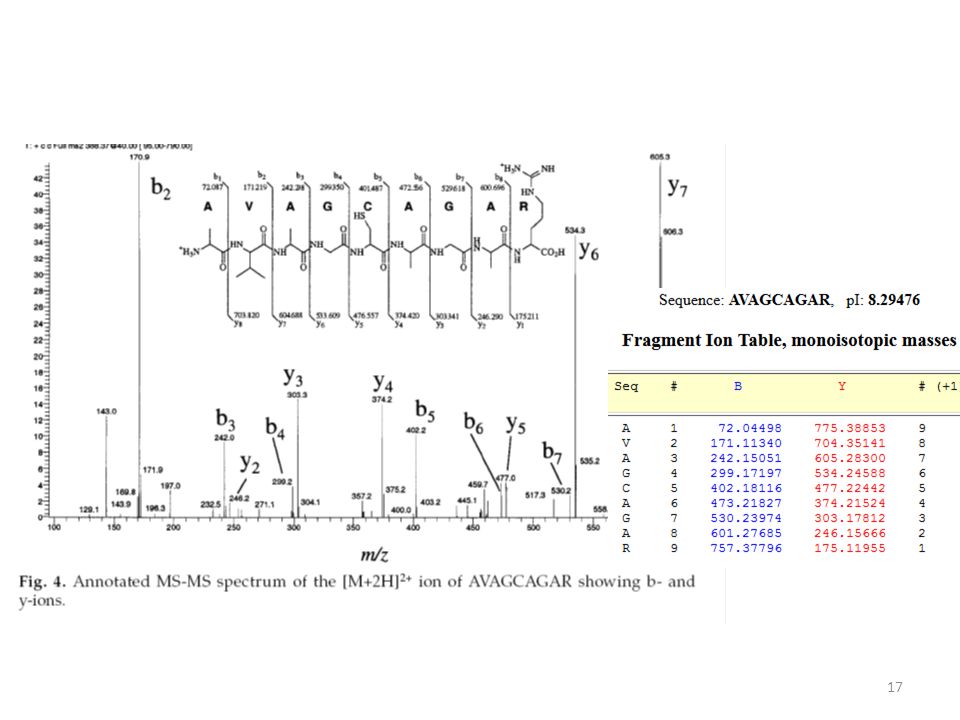
Peptide Fragmentation by MS/MS
887.6 100 y10 90 986.6 80 y8 70 y12 b5 774.5 Relative Abundance 60 y12* 1186.7 494.3 y11 b6 50 1168.7 y13 1085.7 y7 607.4 1243.7 40 673.5 b4 b11 30 b8 b12 395.2 b5* b6* 1006.6 b7 1119.6 b13 20 476.3 779.5 589.3 772.5 885.6 a5 708.4 984.6 a12 1184.7 10 466.3 b10 400 500 600 700 800 900 1000 1100 1200 1300 1400 y13 y10 y11 y9 y8 y7 y6 y5 y4 y12 y3 y2 y1 m/z His-Gly-Thr-Val-Val-Leu-Thr-Ala-Leu-Gly-Gly-Ile -Leu-Lys b1 b4 b3 b5 b6 b7 b8 b9 b10 b2 b11 b12 b13

19
MS/MS: Espectrometría en Tandem
Espectrometría de masa MS/MS: Espectrometría en Tandem Fragmentación peptídica

22
Identificación de proteínas
Peptide mass fingerprinting y proteomica

23
Identificación de proteínas

24
Mapeo peptídico por EM (Peptide Mass Fingerprinting/MS)
proteína intacta péptidos enzima proteolítica MEMEKEFEQIDKSGSWAAIYQDIRHEASDFPCRVAKLPKNKNRNRYRDVS PFDHSRIKLHQEDNDYINASLIKMEEAQRSYILTQGPLPNTCGHFWEMVW EQKSRGVVMLNRVMEKGSLKCAQYWPQKEEKEMIFEDTNLKLTLISEDIK SYYTVRQLELENLTTQETREILHFHYTTWPDFGVPESPASFLNFLFKVRE SGSLSPEHGPVVVHCSAGIGRSGTFCLADTCLLLMDKRKDPSSVDIKKVL LEMRKFRMGLIQTADQLRFSYLAVIEGAKFIMGDSSVQDQWKELSHEDLE PPPEHIPPPPRPPKRILEPHNGKCREFFPNHQWVKEETQEDKDCPIKEEK GSPLNAAPYGIESMSQDTEVRSRVVGGSLRGAQAASPAKGEPSLPEKDED HALSYWKPFLVNMCVATVLTAGAYLCYRFLFNSNT Basics of Peptide Mass Fingerprinting for the genomics audience. We start with a protein, it is cleaved at certain residues by a enzyme, the resulting peptide are then analyze by (single stage) MS. The group of peptides that are created from the protein form a signature for this protein we can use to search the protein databases. Each peptide is small subset of the protein sequence (see arrows in slide) Trypsin cleaves at R-X and K-X But usually don’t get complete sequence coverage
 MS. The group of peptides that are created. from the protein form a signature for this protein we can use to search the protein databases. Each peptide is small subset of the. protein sequence (see arrows in slide) Trypsin cleaves at R-X and K-X. But usually don’t get complete sequence coverage.")
25
Espectro de masa del citocromo c de caballo
A. Molécula entera. Matriz: ácido sinapínico 5000 7000 9000 11000 13000 15000 Mass (m/z) 6.0E+4 10 20 30 40 50 60 70 80 90 100 % Intensity Voyager Spec #1=>BC=>NF0.9[BP = , 60367]
 6.0E % Intensity. Voyager Spec #1=>BC=>NF0.9[BP = , 60367]")
26
B. Molécula digerida con tripsina
B. Molécula digerida con tripsina. Matriz: ácido -ciano hidroxicinámico 1000 1160 1320 1480 1640 1800 Mass (m/z) 2.0E+4 10 20 30 40 50 60 70 80 90 100 % Intensity Voyager Spec #1=>MC=>BC[BP = , 19883] 163 3 . 8 2
 2.0E % Intensity. Voyager Spec #1=>MC=>BC[BP = , 19883]")
27
Niveles de información……… en la caracterización de proteínas por MS.
medida de masa de una molécula entera valor experimental medidas de masas en mapeo peptídico valores experimentales secuenciado de péptidos por MS/MS más de 100 valores experimentales …mejora en cantidad y calidad de la información

28
Peptide fragmentation fingerprinting
PFF = ion search MS/MS database matching Protein(s) Peptides Ions peaklists MS/MS spectra of peptides Enzymatic digestion Result: ranked list of peptide and protein candidates Match In-silico fragmentation MAIILAG MAIILA MAIIL MAII MAI M AIILAG …MAIILAGGHSVRFGPKAFAEVNGETFYSRVITLESTNMFNEIIISTNAQLATQFKYPNVVIDDENHNDKGPLAGIYTIMKQHPEEELFFVVSVDTPMITGKAVSTLYQFLV … In-silico digestion - MAIILAGGHSVR - FGPK - AFAEVNGETFYSR - VITLESTNMFNEIIIK - YPNVVIDDENNDK … Theoretical fragmented peptides Sequence database entry Theoretical proteolytic peptides Theoretical peaklist
 Peptides. Ions peaklists. MS/MS spectra of peptides. Enzymatic. digestion Result: ranked list of peptide and protein candidates. Match. In-silico. fragmentation. MAIILAG. MAIILA. MAIIL. MAII. MAI. M. AIILAG. …MAIILAGGHSVRFGPKAFAEVNGETFYSRVITLESTNMFNEIIISTNAQLATQFKYPNVVIDDENHNDKGPLAGIYTIMKQHPEEELFFVVSVDTPMITGKAVSTLYQFLV … In-silico. digestion. - MAIILAGGHSVR. - FGPK. - AFAEVNGETFYSR. - VITLESTNMFNEIIIK. - YPNVVIDDENNDK. … Theoretical. fragmented peptides. Sequence. database entry. Theoretical. proteolytic peptides. Theoretical. peaklist.")
30
Proteoma Producto final del genoma más variedad
Es una entidad dinámica Fenotipo Modificaciones posttraduccionales No todos los genes se expresan como proteínas en todos los estadios/tipos celulares

31
1 gen = 1proteina? 1 gen ya no equivale a una proteina
La definición de gen es debatible (ORF, promotor, pseudogen, producto de gen, etc) 1 gen = cuántas proteinas? (no sabemos) Exam question…find a DNA sequence that codes for more than one protein Or How do you test to see if your DNA sequence of interest codes for more than one protein?
 1 gen = cuántas proteinas (no sabemos) Exam question…find a DNA sequence that codes for more than one protein. Or. How do you test to see if your DNA sequence of interest codes for more than one protein")
32
Sujetos de estudio de la Proteómica
Identificación de Proteínas (pept mass fingerprint) Comparación de niveles de expresión de Proteinas Función de Proteinas Modificaciones posttraduccionales de Proteinas Localización y Compartimentalización de Proteinas Interacciones Proteina-Proteina
 Comparación de niveles de expresión de Proteinas. Función de Proteinas. Modificaciones posttraduccionales de Proteinas. Localización y Compartimentalización de Proteinas. Interacciones Proteina-Proteina.")
34
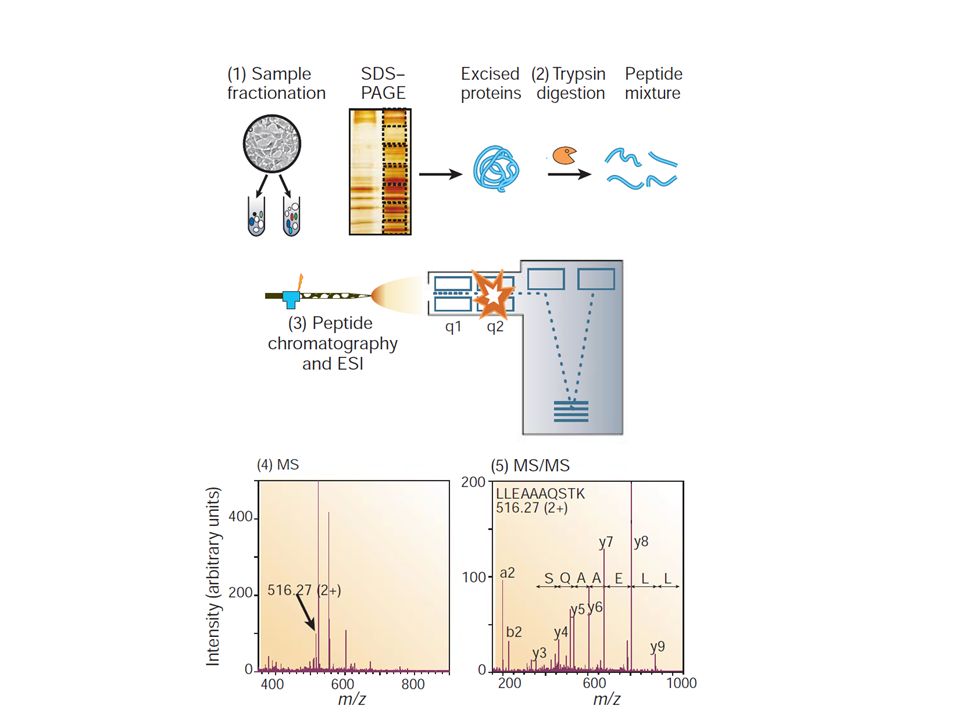
Outline of a generic shotgun proteomics workflow
Outline of a generic shotgun proteomics workflow. Depending on the study, optional organellar enrichment, enrichment of modifications, or affinity purification is performed up front as indicated in the colored boxes. For example, expression proteomics can be performed on whole cell lysates or purified organelles, peptides bearing posttranslational modifications are often specifically enriched, and interaction partners are affinity purified. Prefractionation at the protein or peptide level can be introduced to increase the coverage and dynamic range. Analysis with chromatography and mass spectrometry (MS) then results in large data sets of MS and tandem mass spectrometry (MS/MS) data containing quantitative peptide information and characteristic fragmentation patterns that are used for determining the sequence. m/z, mass-to-charge ratio.
 then results in large data sets of MS and tandem mass spectrometry (MS/MS) data containing quantitative peptide information and characteristic fragmentation patterns that are used for determining the sequence. m/z, mass-to-charge ratio.")
35
Quantitative proteomics

36
Quantitative proteomics

37
Identified yeast proteins per copy number for shotgun proteomics and two tagging approaches. MS, mass spectrometry; GFP, green fluorescent protein; TAP, tandem affinity purification. (b) Using SILAC Haploid to diploid ratios for the yeast proteome. Proteins are color coded according to their haploid/diploid expression ratio as in the color legend in panel c. (c) Pheromone response pathway with fold change color coded for each of its members according their haploid/diploid expression ratio (see color legend). Haploid/diploid ratios are shown as red numbers. MAPK, mitogen-activated protein kinase. (d ) Abundances of proteins detected by targeted proteomics using MRM assays according to Reference 70. Colored labels indicate the copy numbers per yeast cell of the proteins that they point to. Proteins for which the absolute abundance was measured are indicated on top of the graph (open circles).
 Pheromone response pathway with fold change. color coded for each of its members according their haploid/diploid expression ratio (see color legend). Haploid/diploid ratios are. shown as red numbers. MAPK, mitogen-activated protein kinase. (d ) Abundances of proteins detected by targeted proteomics using. MRM assays according to Reference 70. Colored labels indicate the copy numbers per yeast cell of the proteins that they point to. Proteins for which the absolute abundance was measured are indicated on top of the graph (open circles).")
38
Identificación de sitios de modificación Oxidación de citocromo c
Located in mitochondria, plays an important role in apoptosis intrinsic pathway and has been linked to oxidative stress responses Y74 Y67 Y48 Y97 Y74 Y67 Y48 Y97

39
aPLPC TOCL [H2O2] 37°C,1 Hr
![aPLPC TOCL [H2O2] 37°C,1 Hr](http://slideplayer.es/slide/1034774/2/images/39/aPLPC+TOCL+%5BH2O2%5D+37%C2%B0C%2C1+Hr.jpg "aPLPC TOCL [H2O2] 37°C,1 Hr")
40
T---E---R---E---D---L---I---A---Y*--L---K---K
b6 y4 Y+16 y12 y11 y10 y9 y8 y7 y6 y5 y4 y3 y2 y1 T---E---R---E---D---L---I---A---Y*--L---K---K b1 b2 b3 b4 b5 b6 b7 b8 b9 b10 b11 b12 y5 b7-CO (2+) y7 (2+) b5 y6 (2+) b7 y5 (2+) b8 b10 y9
 y7. (2+) b5. y6. (2+) b7. y5. (2+) b8. b10. y9.")
41
GAPDH Reaction with Nitro-oleic acid
Batthyany J.Biol.Chem , p.20450

42
MS-Imaging

43
MS-Imaging

44
Advancing Cell Biology Through Proteomics in
Space and Time (PROSPECTS) Molecular & Cellular Proteomics 11.3 0.1074/mcp.O –1
 Molecular & Cellular Proteomics /mcp.O –1.")
47
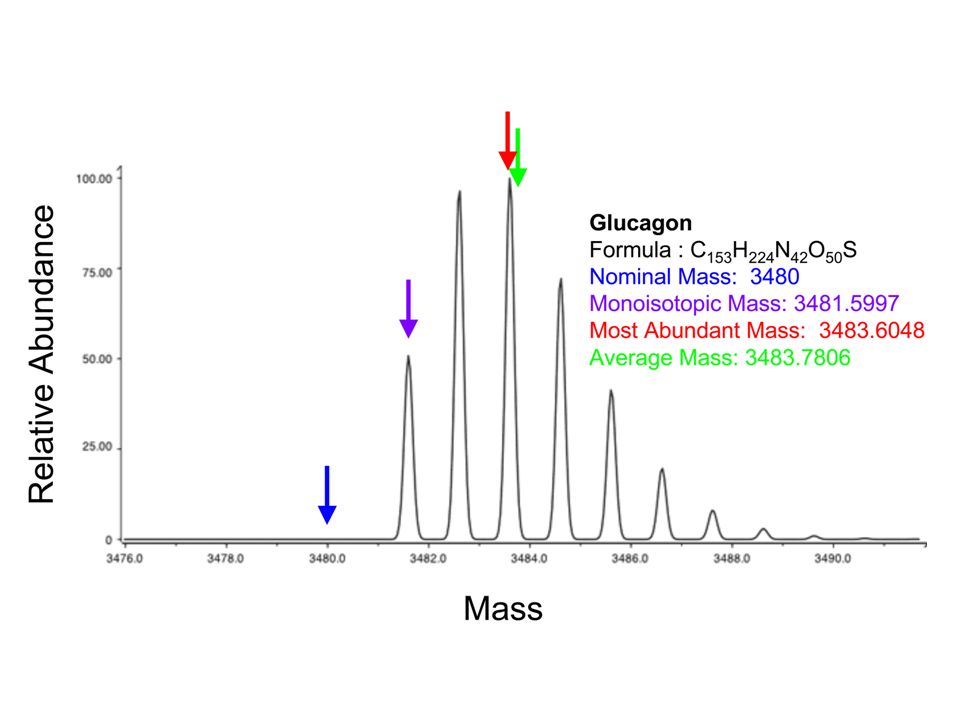
Mass is given as m/z which is the mass of the ion divided by its charge
Monoisotopic mass is the mass of an ion for a given empirical formula calculated using the exact mass of the most abundant isotope of each element (C= , H= etc) Average mass is the mass of an ion for a given empirical formula calculated using the average exact mass for each element (C= , H= etc) Nominal mass is the mass of an ion for a given empirical formula calculated using the integer mass of the most abundant isotope for each element (C=12, H=1 etc)
 Average mass is the mass of an ion for a given empirical formula calculated using the average exact mass for each element (C= , H= etc) Nominal mass is the mass of an ion for a given empirical formula calculated using the integer mass of the most abundant isotope for each element (C=12, H=1 etc)")
49
Electrospray Ionisation and Charge
Substance P 300 400 500 600 700 800 900 1000 1100 1200 1300 Da/e 100 % 674.7 666.1 600.4 462.8 685.7 693.6 1347.7 [M+2H]2 + [M+H] +

50
Determining Charge State
520 521 522 523 524 525 526 527 528 529 5 10 15 20 25 30 35 40 45 50 55 60 65 70 75 80 85 90 95 100 Relative Abundance 524.3 525.3 526.2

51
Determining Charge State
258 259 260 261 262 263 264 265 266 267 5 10 15 20 25 30 35 40 45 50 55 60 65 70 75 80 85 90 95 100 Relative Abundance 262.6 263.1 263.6 Double Charge State Delta = 0.5 amu Delta = 0.5 amu Delta = 0.5 amu

Presentaciones similares