Descargar la presentación
La descarga está en progreso. Por favor, espere

1
NIRS ASPECTOS TEÓRICO-PRÁCTICOS
José María Olivares Rossell

2
concentración absorbente
coeficiente absorción distancia atravesada por luz

3
Absorbancia (A) = [c] x l x α
[c]= A / l x α
![Absorbancia (A) = [c] x l x α](http://slideplayer.es/slide/2657702/10/images/3/Absorbancia+%28A%29+%3D+%5Bc%5D+x+l+x+%CE%B1.jpg "[c]= A / l x α.")
4
J = - D (dc/dx) Ley de Fick
Ley de Fick D: Coeficiente de difusión. Gradiente de concentración J = - D (dc/dx)
")
5
NIRS. ESPECTRO

6
O2Hb tHb = O2Hb + HHb CROMÓFOROS ESPECTRO NIR rSO2 = O2Hb / tHb HHb
INDICE OXIGENACIÓN HEMOGLOBINA (HbD) = O2Hb - HHb
 = O2Hb - HHb.")
8
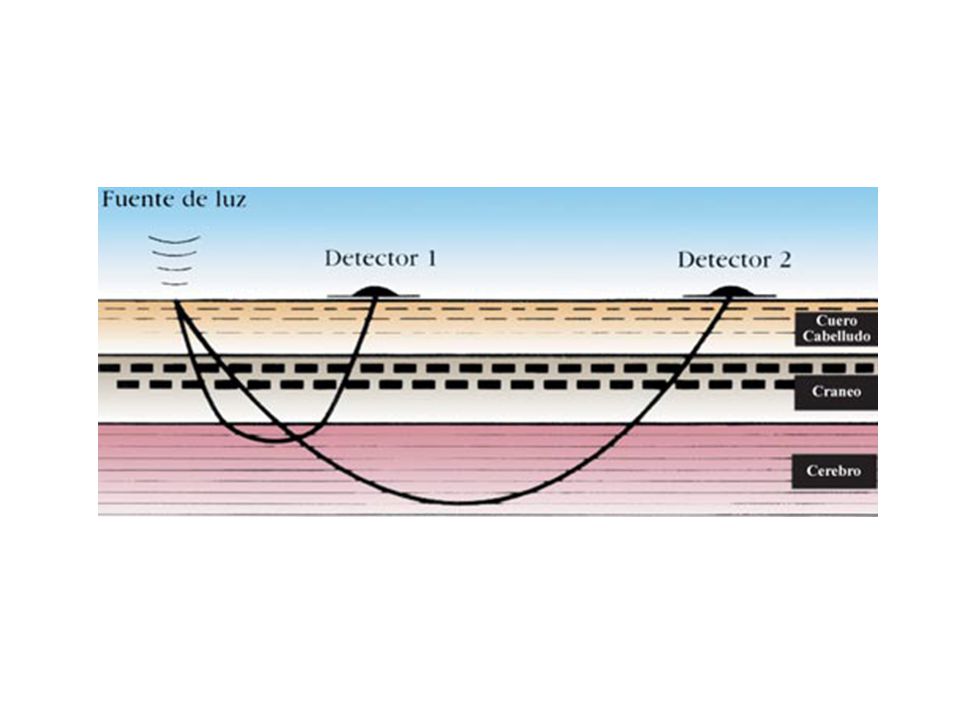
NIRS. ESPECTROSCOPIA DE RESOLUCIÓN ESPACIAL
StO2 calculada a través de diferencia en intensidad señal

10
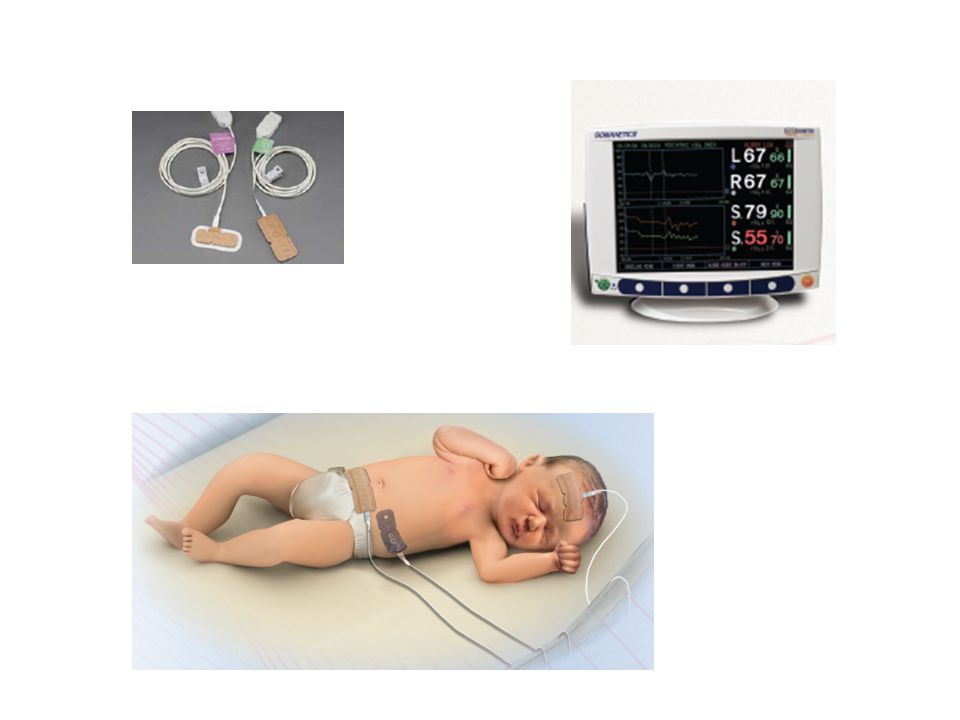
Mediciones NIRS. CONSIDERACIONES BIOLÓGICAS Profundidad : 2 - 3 cm
Medida no enfocada Media mediciones tisulares de fuente - detector

11
NIRS. CONSIDERACIONES BIOLÓGICAS
Mediciones tHB NIRS. rSO2 NIRS . .

12
EFO2 = (SatO2 – rSO2) / SatO2 VN 0.23 - 0.47
NIRS. CONSIDERACIONES BIOLÓGICAS Consumo > Aporte EFO2 = (SatO2 – rSO2) / SatO2 Consumo < Aporte Petrova et al, 2006 Wardle et al, 1998 VN
 / SatO2. Consumo < Aporte. Petrova et al, Wardle et al, VN")
13
EFO2 = (SatO2 – rSO2) / SatO2 NIRS. CONSIDERACIONES BIOLÓGICAS
Hipoxia cerebral

14
Mediciones rSO2 NIRS NIRS. CONSIDERACIONES BIOLÓGICAS
Ajustada a volumen sanguíneo. Representatividad tisular (flujo sanguíneo) Sangre extravascular absorbe más luz NIR que intravascular. [Hb] en hematoma agudo que en tejido vasculocerebral. Absorción luz NIR mayor en lado que alberga hematoma agudo. Hematomas intracerebrales y extracerebrales de hasta 0.3 cm. No : Subdurales crónicos. Hematomas profundos o menor tamaño. Insensibilidad NIRS para hipoxia en esta población (por profundidad) < S detección de hipoxia áreas menos perfundidas Peculiaridades cerebro inmaduro (s. blanca)
 Sangre extravascular absorbe más luz NIR que intravascular. [Hb] en hematoma agudo que en tejido vasculocerebral. Absorción luz NIR mayor en lado que alberga hematoma agudo. Hematomas intracerebrales y extracerebrales de hasta 0.3 cm. No : Subdurales crónicos. Hematomas profundos o menor tamaño. Insensibilidad NIRS para hipoxia en esta población (por profundidad) < S detección de hipoxia áreas menos perfundidas. Peculiaridades cerebro inmaduro (s. blanca)")
15
rSO2 Dependiente flujo. NIRS. OXIMETRÍA TISULAR. FIABILIDAD
Dificultad patrón referencia estándar SatO2 sangre venosa (SvO2) Dependiente flujo. Sesgo (medición SatO2 zonas más perfundidas)
 Dependiente flujo. Sesgo (medición SatO2 zonas más perfundidas)")
16
Φ = 30 mL/100 g/min SvO2 media = (30 x 0.75 + 10 x 0.35) / 40 = 65%
SatO2 = 95% Consumo O2 tisular = n SatO2 = 95% SvO2 = 75% 20% extracción O2 Φ = 10 mL/100 g/min Consumo O2 tisular = n SvO2 = 35% 60% extracción O2 SvO2 media = (30 x x 0.35) / 40 = 65% rSO2 media = ( ) / 2 = 55%
 / 40 = 65% rSO2 media = ( ) / 2 = 55%")
17
NIRS. OXIMETRÍA TISULAR. PRECISIÓN
Oxigenación cerebral estable en tiempo Poca variación espontánea flujo cerebral y tasa metabólica Poca variabilidad oxigenación cerebral entre regiones ÍNDICES VARIABILIDAD PULSIOXIMETRÍA 2-3 % NIRS % Rais-Bahrami et al, 2006; Sorensen et al, 2006; Lemmers et al, 2009

18
Espectrofotometría.Oximetría de pulso.
Sola et al, 2005

19
NIRS PULSIOXIMETRÍA SatO2 arterial Media SatO2 arterial – SatO2 venosa
Aporte oxígeno tisular Dependiente onda pulso Media SatO2 arterial – SatO2 venosa Metabolismo oxigeno tisular Aporte local oxígeno – demanda tisular. No dependiente pulso

20
k ΔVSC = (ΔHbt / Hb) Hbt x PmHb VSC = [Hb] x Dtc VSC
Peso Molecular Hb (64500 g/mol) Densidad tisular (1050 g / l) VSC k ΔVSC = (ΔHbt / Hb) Hbt x PmHb VSC = [Hb] x Dtc Hbt : Hb total cerebral (NIRS) Hb : Hb en sangre periférica Pm : Peso molecular Dtc : Densidad tejido cerebral Takahashi et al, 1999
![k ΔVSC = (ΔHbt / Hb) Hbt x PmHb VSC = [Hb] x Dtc VSC](http://slideplayer.es/slide/2657702/10/images/20/k+%CE%94VSC+%3D+%28%CE%94Hbt+%2F+Hb%29+Hbt+x+PmHb+VSC+%3D+%5BHb%5D+x+Dtc+VSC.jpg "Peso Molecular Hb (64500 g/mol) Densidad tisular (1050 g / l) VSC. k. ΔVSC = (ΔHbt / Hb) Hbt x PmHb. VSC = [Hb] x Dtc. Hbt : Hb total cerebral (NIRS) Hb : Hb en sangre periférica. Pm : Peso molecular. Dtc : Densidad tejido cerebral. Takahashi et al,")
21
VSC. NIRS SatO2 PERIFÉRICA AUMENTO HbO2 y tHb CEREBRAL (ELEVACIÓN VSC)
DESCENSO HbO2 y tHb CEREBRAL Seelbach et al 1999

22
rSO2 < 35% Fallo aporte energético celular Alteración EEG.
NIRS. UMBRALES EN DAÑO CEREBRAL HIPÓXICO-ISQUÉMICO rSO2 < 35% Fallo aporte energético celular Alteración EEG. >2 h Pérdida neuronal . Hou X et al , 2007 Kurth el al, 2009

23
Depresores SNC Temperatura rSO2 O2 Aportes/demandas O2 TAM CO2 GC Hb

24
REDUCCIÓN REACTIVIDAD VSC vs CO2 PREDICTOR SENSIBLE MAL PRONÓSTICO
NIRS. DAÑO CEREBRAL HIPÓXICO-ISQUÉMICO AUMENTO VSC REDUCCIÓN REACTIVIDAD VSC vs CO2 PREDICTOR SENSIBLE MAL PRONÓSTICO Wyatt el al, 1993

25
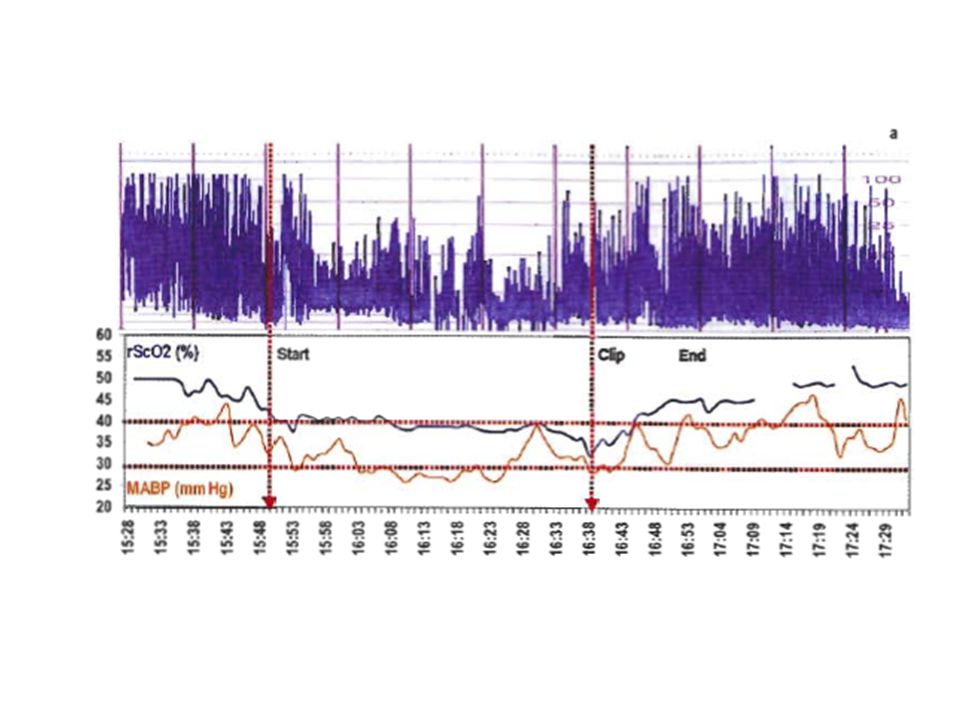
HbD [O2Hb-HHb] ~ TAM ELEVADA CORRELACIÓN (COHERENCIA > 0,5)
NIRS. DAÑO CEREBRAL HIPÓXICO-ISQUÉMICO HbD [O2Hb-HHb] ~ TAM ELEVADA CORRELACIÓN (COHERENCIA > 0,5) FALTA AUTORREGULACIÓN FLUJO CEREBRAL (PERFUSIÓN CEREBRAL PASIVA) DAÑO CEREBRAL Y MUERTE
![HbD [O2Hb-HHb] ~ TAM ELEVADA CORRELACIÓN (COHERENCIA > 0,5)](http://slideplayer.es/slide/2657702/10/images/25/HbD+%5BO2Hb-HHb%5D+%7E+TAM+ELEVADA+CORRELACI%C3%93N+%28COHERENCIA+%3E+0%2C5%29.jpg "NIRS. DAÑO CEREBRAL HIPÓXICO-ISQUÉMICO. HbD [O2Hb-HHb] ~ TAM. ELEVADA CORRELACIÓN (COHERENCIA > 0,5) FALTA AUTORREGULACIÓN FLUJO CEREBRAL. (PERFUSIÓN CEREBRAL PASIVA) DAÑO CEREBRAL Y MUERTE.")
26
28 semanas. Normalidad neuroimagen
Tsuji et al, 2000

27
27 s. Leucomalacia periventricular.
Tsuji et al, 2000

28
Tsuji et al, 2000

29
NeoReviews Vol.10 No.3 March 2009

30
No SDR Petra M et al, 2006

31
SDR Petra M et al, 2006

32
NIRS. CRISIS SILENTES. Hans Shuhaiber et al , 2004
Neonato. Displasia cortical. Cambios NIRS lateralizados sugestivos hipoxia. Manifestación contraria a crisis sintomáticas. Crisis>100 s asociadas con descenso rSO2. Hans Shuhaiber et al , 2004

33
NIRS. CRISIS CLÍNICAS. Alfonso et al, 2003
Recién nacido hemimegaloencefalia derecha. Status eléctrico. Fluctuaciones rSO2 persisten en ambos hemisferios tras crisis. Tardan en llegar a nivel basal. Neuroprotección contralareral de hemisferectomía Alfonso et al, 2003

34
NIRS. CIRUGÍA CARDIACA (DTGA)
Before surgery rSat was <50% in 16 patients. During CPB rSat increased to normal values, with a sharp decrease during brief CA (median 6.5 min). Post-CPB rSat showed a transient decrease (30–45%) despite normal PaO2 with sustained normalization after 6–26 h. Recovery time of the rSat seemed longer when pre-operative rSat was below 35%, and for lower minimum nasopharyngeal temperature and longer duration of CPB and of DHCA. Recovery time of the aEEG varied and did not correlate with normalization of rSat. Neurodevelopmental outcome was normal in all but two patients. Patients with lower pre-operative rSat (<35%) tended to have lower DQ (developmental quotient) scores at 30–36 months. Toet et al, 2005
. Post-CPB rSat showed a transient decrease (30–45%) despite normal PaO2 with sustained normalization after 6–26 h. Recovery time of the rSat seemed longer when pre-operative rSat was below 35%, and for lower minimum nasopharyngeal temperature and longer duration of CPB and of DHCA. Recovery time of the aEEG varied and did not correlate with normalization of rSat. Neurodevelopmental outcome. was normal in all but two patients. Patients with lower pre-operative rSat (<35%) tended to have lower DQ (developmental quotient) scores at 30–36 months. Toet et al,")
35
NeoReviews Vol.10 No.3 March 2009

Presentaciones similares