Descargar la presentación
La descarga está en progreso. Por favor, espere

1
Evaluating and (Re)-Designing Conditional Cash Transfers Orazio Attanasio (Centre for the Evaluation of Development Policies – EDePo at IFS & UCL) Impact Evaluation Network – Bogotá October 3 rd 2007
-Designing Conditional Cash Transfers Orazio Attanasio (Centre for the Evaluation of Development Policies – EDePo at IFS & UCL) Impact Evaluation Network – Bogotá October 3 rd 2007")
2
Introduction CCT have become extremely important and visible Since PROGRESA/Oportunidades perceived success CCT have become a model intervention PROGRESA/ Oportunidades was also a model for the evaluation work that generated. Oportunidades and some of the other programs have now run for a number of years and are now on the verge of a new phase There are new challenges ahead: Design and changes to the program Evaluation

3
Introduction I will use this presentation to talk about some of the results obtained and present some thoughts on the future of these programs I will use mainly my experience in the evaluation of two programs: Oportunidades in Mexico and Familias en Acción in Colombia

4
Outline Results: Rural areas Education Health & Nutrition Urban Areas Take up Other results Challenges: Limitations of CCT and changes to CCT programs Supply interventions? CCT and social policy in Latin America Evaluation Challenges Beyond impact evaluation The long run: Results? GE consequences

5
Results The evaluation has been crucial to the political success of the program Randomization is difficult to manage Design and new modules evaluation work should be informed by the results of the evaluations obtained so far

6
Results: rural areas Both in Colombia and in Mexico the results have been quite positive. Secondary school enrollment: large increases. Primary school enrollment: small or zero increases. Health and nutrition: positive effects Inputs (diet, growth and development check ups, Height Occurrence of illnesses Some limitations: anemia

7
Results: rural areas Consumption: Increases, especially in food Within food, protein rich commodities No effects on adult goods Some saving (investment –see Gertler et al.) Other effects Transfers Social capital? Migration Knowledge?

8
Results urban areas Mexico: Low take up Positive but not as positive as in rural More ambiguous due to the lack of randomization Colombia: Positive in education but not as large Zero in nutrition and health Positive in consumption (and some saving)
")
9
New challenges: CCT expansions Different context from rural PROGRESA/ Oportunidades or rural Familias en Acción. Very poor regions/areas/countries Africa, or even very marginal regions in LAC Not so poor regions/areas countries Urban areas. Are CCT the right answer in these situations? And if they are, do they need adjustment?

10
CCT limitations and new challenges. Nutrition and early years: Are we satisfied with the effects? Anemia Should we use the CCT to deliver Early Years stimulation? Should the intervention be adjusted from area to area? Malnutrition and obesity Evaluation and design are key! Oportunidades experiments with Nutrisano, sprinklers. Delivering Early Years stimulation in marginalized communities.

11
CCT limitations and new challenges. Education The effect on primary school enrolment is often negligible. (and for a reason) Enrolment is up: what about learning and academic achievement? Tertiary education is the big challenge, especially in urban areas? What role do credit constraint play? What about the quality of education? Design and evaluation are key! Bogotá experiment
 Enrolment is up: what about learning and academic achievement. Tertiary education is the big challenge, especially in urban areas. What role do credit constraint play. What about the quality of education. Design and evaluation are key. Bogotá experiment.")
12
Supply interventions Effects have been shown to be very heterogeneous. Are there heterogeneous effects driven by the availability of health and education services supply? What is the quality of these services? What are the bottlenecks?

13
CCT politics and social policies in Latin America CCT and populism. Brazil Colombia Mexico CCT should not be burdened with many other aims and objectives Operation difficulties Transparency and accountability The political economy of evaluation

14
Evaluation Challenges: beyond impact effects Rigorous evaluations have been instrumental to the political success of the programs and their continuation It should be instrumental to the design of changes to the programs Experimental and quasi-experimental methods have played an important role But it is necessary to understand the mechanisms behind the impacts observed in the evaluation

15
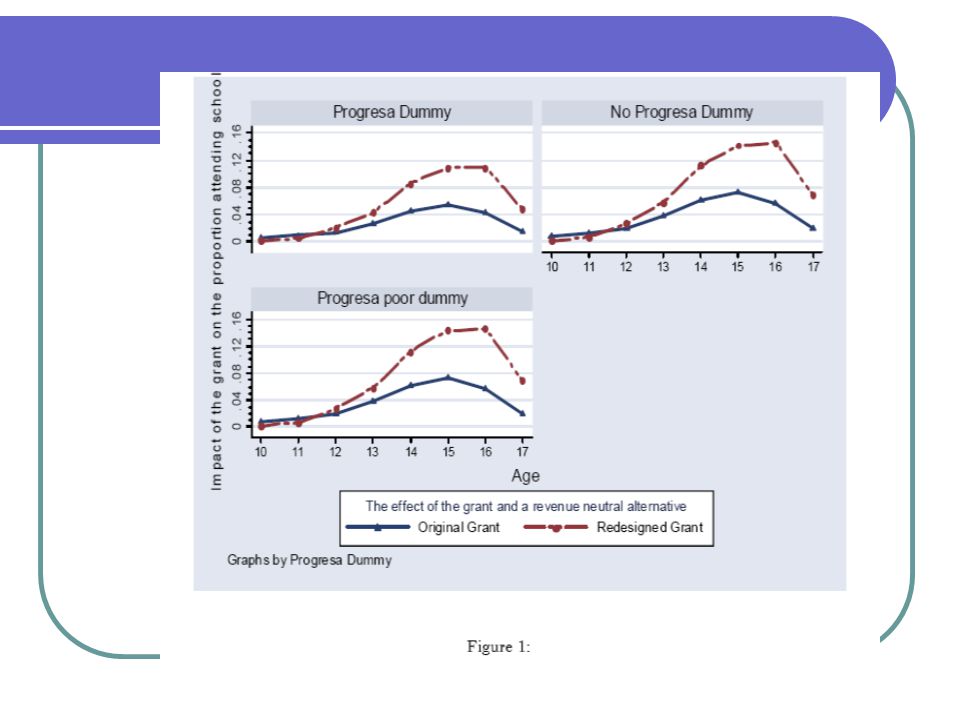
An example Changes to the structure to the grant Increase in the secondary school grant and reduction or elimination of the primary school grant (but what is the effect of the primary school grant on nutritional outcomes at early ages?) We need structural models: Todd and Wolpin (2002, forthcoming AER) Attanasio, Meghir and Santiago (2002)
 We need structural models: Todd and Wolpin (2002, forthcoming AER) Attanasio, Meghir and Santiago (2002)")
17
Other changes to the program New modules: Nutrition Cognitive development Education

18
Results: the long run Next to nothing is known The analysis is difficult … and yet these results are crucial for any cost benefit analysis. GE effects.

19
Conclusions CCT have been the most exciting piece of news in Social Policy The risk is that they are seen as a silver bullet that can work in all sort of situations. … and that one neglects the new challenges ahead: New modules (nutrition, early year stimulation). Supply interventions Integration with other policies (Chile Solidario, Red Juntos in Colombia). Evaluation has a key role to play in helping to shape the new generation of CCTs and maintaining them independent from the executive.
. Supply interventions Integration with other policies (Chile Solidario, Red Juntos in Colombia). Evaluation has a key role to play in helping to shape the new generation of CCTs and maintaining them independent from the executive..")
20
Thank you!

21
Impact on school enrolment: 8-13, 14-17, 2 nd follow-up Notes: Based on all (original plus switchers) treated areas Parametric specification using 4 periods of data. * Nivel de significancia del 5 % o menos ** Nivel de significancia del 1 % o menos UrbanRural 8-130.0119 (0.0064) 0.0282 (0.0076)** 14-170.0500 (0.0185)** 0.0805 (0.0243)**
 (0.0076)** (0.0185)** (0.0243)**.")
22
Es el consumo afectado por el Programa? DD. Tratamiento vs Control Primer SeguimientoSegundo Seguimiento Log consumo total urbano0.147 (0.034)*** 0.092 (0.040)** Log consumo total rural0.145 (0.051)*** 0.112 (0.040)*** Log consumo de alimentos urbano0.158 (0.034)*** 0.111 (0.039)*** Log consumo de alimentos rural0.157 (0.056)*** 0.116 (0.039)*** p<0.1, ** p<0.05, *** p<0.01 Nota: En SS se incluye a los municipios que pasaron de control a tratamiento entre línea de base y segundo seguimiento
*** (0.040)** Log consumo total rural0.145 (0.051)*** (0.040)*** Log consumo de alimentos urbano0.158 (0.034)*** (0.039)*** Log consumo de alimentos rural0.157 (0.056)*** (0.039)*** p<0.1, ** p<0.05, *** p<0.01 Nota: En SS se incluye a los municipios que pasaron de control a tratamiento entre línea de base y segundo seguimiento.")
23
Efectos sobre diferentes alimentos Tratamiento vs control, (D-D) ($ pesos) UrbanoRural Proteínas17,316.1 (5,860.6)*** 23,393.5 (5,822.2)*** Tubérculos261.2 (1,663.4) 386.3 (3,339.2) Cereales3,170.2 (2,451.2) 6,905.7 (2,798.3)** Frutas y verduras252.7 (3,185.2) 3,659.1 (3,109.5) Leguminosas-363.2 (865.2) 785.1 (1,608.6) Grasas1,086.1 (754.4) 1,870.5 (1,275.2) Azúcar492.3 (1,025.4) -1,242.0 (2,113.2) p<0.1, ** p<0.05, *** p<0.01 Nota: se incluye a los municipios que pasaron de control a tratamiento entre linea de base y segundo seguimiento
 ($ pesos) UrbanoRural Proteínas17,316.1 (5,860.6)*** 23,393.5 (5,822.2)*** Tubérculos261.2 (1,663.4) (3,339.2) Cereales3,170.2 (2,451.2) 6,905.7 (2,798.3)** Frutas y verduras252.7 (3,185.2) 3,659.1 (3,109.5) Leguminosas (865.2) (1,608.6) Grasas1,086.1 (754.4) 1,870.5 (1,275.2) Azúcar492.3 (1,025.4) -1,242.0 (2,113.2) p<0.1, ** p<0.05, *** p<0.01 Nota: se incluye a los municipios que pasaron de control a tratamiento entre linea de base y segundo seguimiento")
24
Efecto en la probabilidad de poseer bienes durables Primer seguimientoSegundo seguimiento UrbanoRuralUrbanoRural Refrigerador0.085*** (0.020) 0.033** (0.016) 0.061*** (0.016) 0.022 (0.014) Maquina de coser–0.008 (0.013) –0.041*** (0.011) –0.000 (0.010) –0.011 (0.009) TV blanco y negro–0.005 (0.018) 0.031* (0.018) –0.040*** (0.014) 0.008 (0.014) TV color0.092*** (0.021) 0.015 (0.018) 0.058*** (0.016) 0.011 (0.015) Ventilación0.022 (0.017) 0.069*** (0.014) 0.010 (0.013) 0.044*** (0.011) Licuadora0.010 (0.021) –0.001 (0.019) 0.036** (0.017) 0.019 (0.016) Bicicleta0.045*** (0.014) 0.028** (0.013) 0.110*** (0.017) 0.052*** (0.016) Animales0.039*** (0.014) 0.016* (0.009) 0.072*** (0.016) 0.007 (0.012) Variable dependiente: posesión de bien durable Dummy de tratamiento en el lado derecho de la ecuación p<0.1, ** p<0.05, *** p<0.01 Nota: se incluye a los municipios que pasaron de control a tratamiento entre línea de base y segundo seguimiento
 0.033** (0.016) 0.061*** (0.016) (0.014) Maquina de coser–0.008 (0.013) –0.041*** (0.011) –0.000 (0.010) –0.011 (0.009) TV blanco y negro–0.005 (0.018) 0.031* (0.018) –0.040*** (0.014) (0.014) TV color0.092*** (0.021) (0.018) 0.058*** (0.016) (0.015) Ventilación0.022 (0.017) 0.069*** (0.014) (0.013) 0.044*** (0.011) Licuadora0.010 (0.021) –0.001 (0.019) 0.036** (0.017) (0.016) Bicicleta0.045*** (0.014) 0.028** (0.013) 0.110*** (0.017) 0.052*** (0.016) Animales0.039*** (0.014) 0.016* (0.009) 0.072*** (0.016) (0.012) Variable dependiente: posesión de bien durable Dummy de tratamiento en el lado derecho de la ecuación p<0.1, ** p<0.05, *** p<0.01 Nota: se incluye a los municipios que pasaron de control a tratamiento entre línea de base y segundo seguimiento")
25
Evaluación de impacto VariableUrbanoRural Meses de duración de la lactancia -2.662 (1.844) 2.856** (1.241) Proporción de niños que aun están recibiendo pecho 18.0% 0.070** -1.0% (0.111) Impacto de la variable lactancia exclusiva en menores de 6 meses: Para total urbano rural 0.134 *** (0.050) Lactancia materna Nivel de significancia del 10 % o menos Nivel de significancia del 5 % o menos Nivel de significancia del 1 % o menos * * * *
 2.856** (1.241) Proporción de niños que aun están recibiendo pecho 18.0% 0.070** -1.0% (0.111) Impacto de la variable lactancia exclusiva en menores de 6 meses: Para total urbano rural *** (0.050) Lactancia materna Nivel de significancia del 10 % o menos Nivel de significancia del 5 % o menos Nivel de significancia del 1 % o menos * * * *")
26
Nivel de significancia del 10 % o menos Nivel de significancia del 5 % o menos Nivel de significancia del 1 % o menos * * * * Consumo de Alimentos Impacto en el Promedio de días en la semana que se consumieron los alimentos ricos en hierro UrbanoRural Huevos0.8 (0.2)*** Carne de res0.50.7 (0.2)**(0.3)** Hígado de res1.00.2 (0.4)***(0.6) Carne de cerdo0.50.9 (0.3)**(0.4)** Legumbres0.4 (0.2)* Hierro1.51.6 (0.4)*** * p<0.1, ** p<0.05, *** p<0.01
*** Carne de res (0.2)**(0.3)** Hígado de res (0.4)***(0.6) Carne de cerdo (0.3)**(0.4)** Legumbres0.4 (0.2)* Hierro (0.4)*** * p<0.1, ** p<0.05, *** p<0.01")
27
VariableRuralUrbano Asistencia a consulta de crecimiento y desarrollo 0.149** (0.07) 0.243*** (0.08) Vacunación completa DPT0.026 (0.06) 0.014 (0.04) Nivel de significancia del 10 % o menos Nivel de significancia del 5 % o menos Nivel de significancia del 1 % o menos * * * * Impacto en la probabilidad de cumplir con: La vacunación se realiza a los niños pequeños, pero estos no son elegibles por lo que no se aprecia impacto. Sin embargo, los controles de crecimiento y desarrollo se hacen en todas las edades

28
Impactos por grupos de edad (probabilidad de cumplir) EdadCrec y DesarrolloDPT 0 a 24 meses0.076 (0.081) 0.012 (0.087) 24 a 48 meses0.002 (0.06) -0.02 (0.06) 48 a 84 meses0.38*** (0.07) 0.047 (0.032) El programa no tiene impacto en niños de 0 a 48 meses pues la inmensa mayoría no está inscrito en el programa
 EdadCrec y DesarrolloDPT 0 a 24 meses0.076 (0.081) (0.087) 24 a 48 meses0.002 (0.06) (0.06) 48 a 84 meses0.38*** (0.07) (0.032) El programa no tiene impacto en niños de 0 a 48 meses pues la inmensa mayoría no está inscrito en el programa")
29
Crecimiento en la Talla Promedio. Nivel de significancia del 10 % o menos Nivel de significancia del 5 % o menos Nivel de significancia del 1 % o menos * * * * Impactos positivos en la zona rural, pero nulos en la urbana Zona Valor Z talla para la edad % desnutrición crónica Valor Z peso para la edad % desnutrició n global Valor Z peso para la talla Rural 0.246 (0.115)** -9.0 (4.6)** 0.243 (0.111)** -2.5 (1.9) 0.127 (0.096) Urbano -0.043 (0.085) 2.5 (3.6) -0.011 (0.139) 0.9 (2.6) 0.022 (0.145) (Desviación estándar y puntos porcentuales)
** -9.0 (4.6)** (0.111)** -2.5 (1.9) (0.096) Urbano (0.085) 2.5 (3.6) (0.139) 0.9 (2.6) (0.145) (Desviación estándar y puntos porcentuales).")
30
VariableRural 0-36 Rural 36-84 Urbano 0-36 Urbano 36-84 Talla para la edad (Desv standards) -0.053 (0.241) 0.338** (0.163) -0.248 (0.265) 0.022 (0.101) Peso para la edad (Desv standards) -0.108 (0.235) 0.372** (0.183) -0.042 (0.172) -0.029 (0.127) % desnutrición crónica-5.2 (5.9) -7.6 (5.3) 10 (11.3) -0.6 (5.3) % desnutrición global-6.0*** (1.9) 1.8 (1.9) -4.1** (2.0) 2.3 (2.7) % riesgo desnutrición crónica11 (10) -20.6** (9.7) -2.0 (10.3) -0.5 (6.3) % riesgo desnutrición global-4.8 (10.5) -17.3* (9.3) 12.2 10.6 -2.4 (7.6) Impacto en la Talla Promedio (cont). (Desviación estándar y puntos porcentuales)
.")
31
Anemia (descriptivo) ENSIN 2005 Anemia por grupos de edad en todos los niveles del sisben: 12 a 23 meses 53.2% 24 a 35 meses 33% 36 a 47 meses 25.4% 48 a 59 meses 22.1% ENSIN 2005 Anemia en niños menores de cinco años: Nivel 1 del sisben 41.9% Nivel 2 del sisben 29.9% Niños de cinco a doce años: Nivel 1 del sisben 47.7% Nivel 2 del sisben 32.9%
 ENSIN 2005 Anemia por grupos de edad en todos los niveles del sisben: 12 a 23 meses 53.2% 24 a 35 meses 33% 36 a 47 meses 25.4% 48 a 59 meses 22.1% ENSIN 2005 Anemia en niños menores de cinco años: Nivel 1 del sisben 41.9% Nivel 2 del sisben 29.9% Niños de cinco a doce años: Nivel 1 del sisben 47.7% Nivel 2 del sisben 32.9%")
32
Anemia (impacto) VariableRuralUrbano Nivel de hemoglobina0.1 (0.2) -0.2 (0.2) Probabilidad de sufrir anemia -0.1 (0.3) -0.2 (0.3) No se aprecia impacto en anemia
 VariableRuralUrbano Nivel de hemoglobina0.1 (0.2) -0.2 (0.2) Probabilidad de sufrir anemia -0.1 (0.3) -0.2 (0.3) No se aprecia impacto en anemia")
33
Impacto sobre la probabilidad de padecer diarrea UrbanoRural 0-36 meses -0.030 (0.065) -0.095** (0.04) 36-84 meses 0.015 (0.027) -0.016 (0.027) El programa mejora la prevalencia de diarrea (autopercibida) en la zona rural (niños pequeños)
 ** (0.04) meses (0.027) (0.027) El programa mejora la prevalencia de diarrea (autopercibida) en la zona rural (niños pequeños)")
Presentaciones similares
: cómo trabajarla bien en grupos.>")


 Usted tiene – You have (Formal) El tiene – He has Ella.>")


. It features two verb changes that we will see very soon.>")


