Descargar la presentación
La descarga está en progreso. Por favor, espere

1
URBAN FUTURES RAL-NCAR
Canadá, México, USA: Quinto Reporte del IPCC sobre Cambio Climático en Norteamérica y Centroamérica IMPACTOS, ADAPTACION, Y VULNERABILIDAD Patricia Romero-Lankao URBAN FUTURES RAL-NCAR * * * * * * * * * * *

2
¿Qué es diferente y relevante para México y Centroamérica?
Integración de adaptación y riesgo Amenazas, impactos, vulnerabilidad Abordaje regional Vínculos desarrollo y clima Análisis detallado de límites, barreras y opciones de adaptación

3
EMISIONES Usos del suelo
IMPACTOS CLIMA DESARROLLO Vulnerabilidad Variabilidad Natural Patrones de Desarrollo Socioeconómico Amenazas RIESGO Acciones Adaptación Mitigación Cambio Climático Antropogénico Governanza Exposición 1. What is different and socially relevant in this chapter and the report as a whole: a risk approach to - assessing climate adaptation, impacts and socioeconomic vulnerabilities - existing, possible and future options and challenges to reduce and manage climate risks. - a careful analysis of adaptation limits, barriers and potentials - A place base approach EMISIONES Usos del suelo

4
Cambios observados impactan ya
recursos naturales, economías y calidad de vida Cambios observados impactan ya ARE WIDESPREAD OBSERVED IMPACTS OF CLIMATE CHANGE AND CONSEQUENTIAL 2. Observed climate impacts are widespread and consequential for things we humans value Global patterns of impacts in recent decades attributed to climate change, based on studies since the AR4 Impacts are shown at a range of geographic scales and for all the world regions..

7
Comunidades, territorios y ecosistemas son
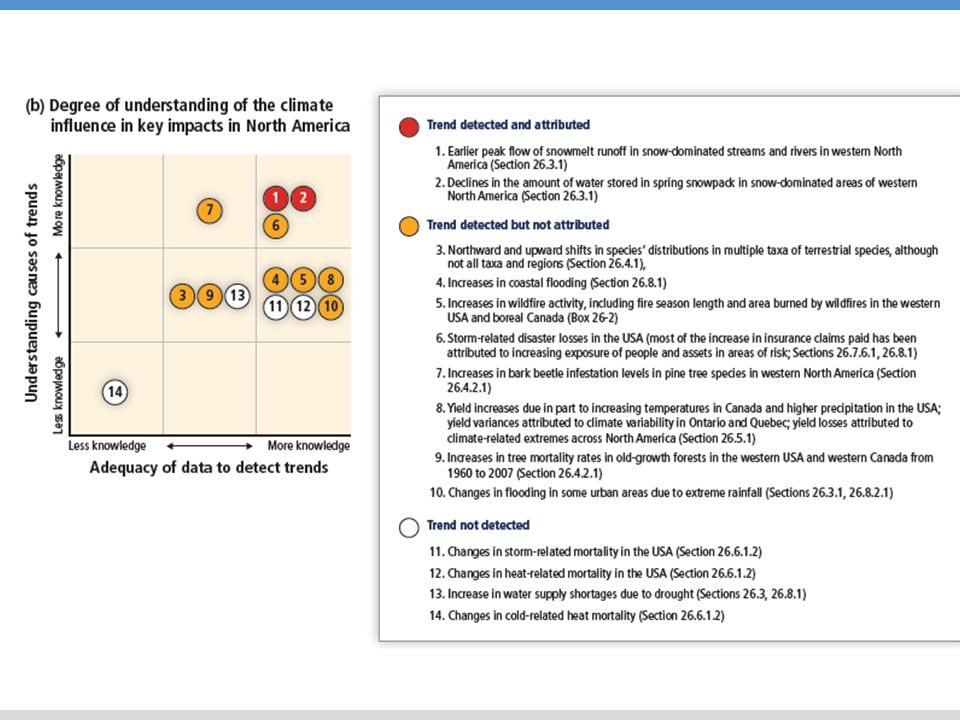
VULNERABLES Comunidades, territorios y ecosistemas son POR DISTINTAS RAZONES IN DIFFERENT WAYS VULNERABLE AND EXPOSED PEOPLE, SOCIETIES, AND ECOSYSTEMS AROUND THE WORLD 3. People, societies and ecosystems are vulnerable and exposed in different ways - Examples from other regions but particularly from urban, rural and peri-urban areas in North America - North American figure offering a graphic illustration of location of extreme events and relevant vulnerability trends

8
Mexico is already vulnerable to current climate variability and change
Figure 9.1. The total number of hydro-meteorological disaster events, (Source: Runfola, Romero-Lankao, Jiang, Nawrotski, and Sanchez 2014) Disenventar – one of the best sources for environmental impacts available. Improvements on this product would allow for significant advancements in risk studies
 Disenventar – one of the best sources for environmental impacts available. Improvements on this product would allow for significant advancements in risk studies.")
9
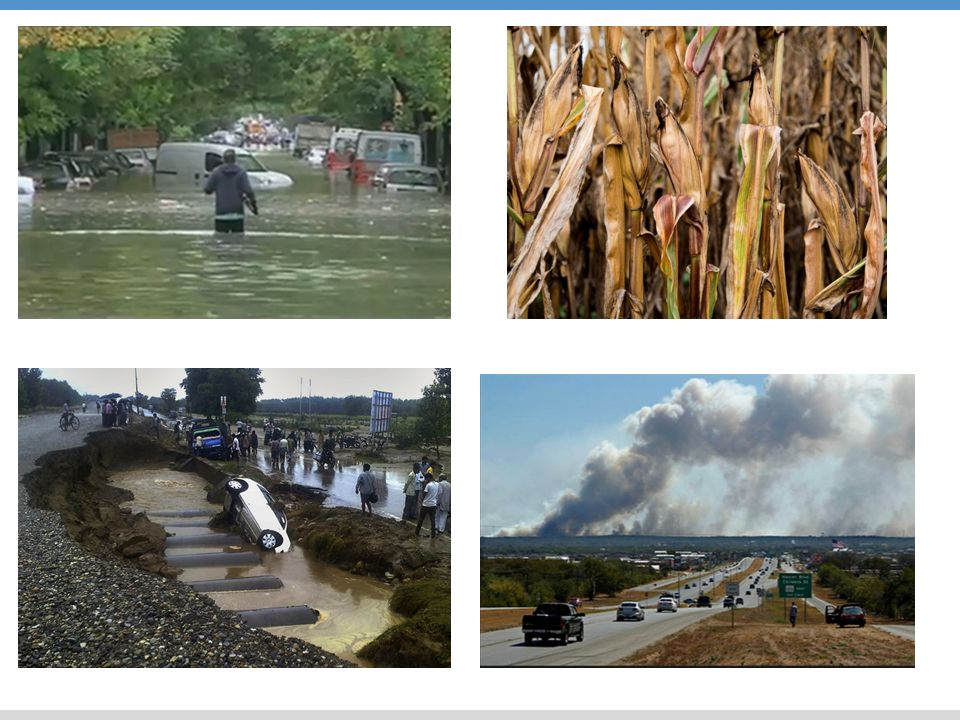
Impacts from recent climate-related extremes reveal significant vulnerability of North America Los impactos de eventos climáticos extremos muestran el alto grado de vulnerabilidad de Norteamérica This figure offers a graphic illustration of location of extreme events and relevant vulnerability trends. The observed extreme events have not been attributed to anthropogenic climate change, yet they are climate-sensitive sources of impact illustrating vulnerability of exposed systems, particularly if projected future increases in the frequency and/or intensity of such events should materialize

10
Agricultura en México Gran parte del territorio es marginal
Desertificación severa (factores sociales) Agricultores son vulnerables Sus riesgos sociales son altos (acceso a crédito, seguros) Mercados y factibilidad técnica insuficientes para promover adaptación Apoyo institucional es clave e inadecuado en muchos casos
 Agricultores son vulnerables. Sus riesgos sociales son altos (acceso a crédito, seguros) Mercados y factibilidad técnica insuficientes para promover adaptación. Apoyo institucional es clave e inadecuado en muchos casos.")
13
DE MANTENERSE EL ALTO NIVEL DE EMISIONES
SERAN IRREVERSIBLES DE MANTENERSE EL ALTO NIVEL DE EMISIONES LOS RIESGOS DEL CAMBIO CLIMATICO WITH CONTINUED HIGH EMISSIONS INCREASE RISKS OF CLIMATE CHANGE

14
Norteamérica Observed and Projected Changes in Annual Temperature and Precipitation. (Top panel, left) observed temperature trends from determined by linear regression [WGI AR5 Figures SPM.1 and 2.21]. (Bottom panel, left) Observed precipitation change from determined by linear regression. [WGI AR5 Figure SPM.2] For observed temperature and precipitation, trends have been calculated where sufficient data permits a robust estimate (i.e., only for grid boxes with greater than 70% complete records and more than 20% data availability in the first and last 10% of the time period). Other areas are white. Solid colors indicate areas where change is significant at the 10% level. Diagonal lines indicate areas where change is not significant (Top and bottom panel, right) CMIP5 multi-model mean projections of annual average temperature changes and average percent change in annual mean precipitation for and under RCP2.6 and 8.5. Solid colors indicate areas with very strong agreement, where the multi-model mean change is greater than twice the baseline variability, and >90% of models agree on sign of change. Colors with white dots indicate areas with strong agreement, where >66% of models show change greater than the baseline variability and >66% of models agree on sign of change. Gray indicates areas with divergent changes, where >66% of models show change greater than the baseline variability, but <66% agree on sign of change. Colors with diagonal lines indicate areas with little or no change, less than the baseline variability in >66% of models. (There may be significant change at shorter timescales such as seasons, months, or days.). Analysis uses model data and methods building from WGI AR5 Figure SPM.8. See also Annex I of WGI AR5. [Boxes 21-3 and CC-RC]
 observed temperature trends from determined by linear regression [WGI AR5 Figures SPM.1 and 2.21]. (Bottom panel, left) Observed precipitation change from determined by linear regression. [WGI AR5 Figure SPM.2] For observed temperature and precipitation, trends have been calculated where sufficient data permits a robust estimate (i.e., only for grid boxes with greater than 70% complete records and more than 20% data availability in the first and last 10% of the time period). Other areas are white. Solid colors indicate areas where change is significant at the 10% level. Diagonal lines indicate areas where change is not significant (Top and bottom panel, right) CMIP5 multi-model mean projections of annual average temperature changes and average percent change in annual mean precipitation for and under RCP2.6 and 8.5. Solid colors indicate areas with very strong agreement, where the multi-model mean change is greater than twice the baseline variability, and >90% of models agree on sign of change. Colors with white dots indicate areas with strong agreement, where >66% of models show change greater than the baseline variability and >66% of models agree on sign of change. Gray indicates areas with divergent changes, where >66% of models show change greater than the baseline variability, but <66% agree on sign of change. Colors with diagonal lines indicate areas with little or no change, less than the baseline variability in >66% of models. (There may be significant change at shorter timescales such as seasons, months, or days.). Analysis uses model data and methods building from WGI AR5 Figure SPM.8. See also Annex I of WGI AR5. [Boxes 21-3 and CC-RC]")
15
Projected changes in extremes Cambios proyectados en extremos
Figure 26-4: Projected changes in extremes in North America (a) The percentage of years in the 2046–2065 period of RCP8.5 (the highest climate scenario) in which the summer temperature is greater than the respective maximum summer temperature of the 1986–2005 baseline period (Diffenbaugh and Giorgi, 2012). (b) The percentage of years in the period of RCP8.5 in which the summer precipitation is less than the respective minimum summer precipitation of the baseline period (Diffenbaugh and Giorgi, 2012). (c) The percentage difference in the 20-year return value of annual precipitation extremes between the period of RCP4.5 and the baseline period (from Kharin et al., 2013). The hatching indicates areas where the differences are not significant at the 5% level. (d) The percentage of years in the period of RCP8.5 in which the March snow water equivalent is less than the respective minimum March snow water equivalent of the 1976–2005 period (Diffenbaugh et al., 2012). The black (white) stippling indicate areas where the multimodel mean exceeds 1.0 (2.0) standard deviations of the multi-model spread. (a-d) The RCPs and time periods are those used in the peer-reviewed studies in which the panels appear. The period of RCP8.5 and the period of RCP4.5 exhibit global warming in the range of 2-3˚C above the pre-industrial baseline (WGI Fig ). The and periods of RCP8.5 exhibit global warming in the range of 4-5˚C above the pre-industrial baseline (WGI Fig ). Cambios proyectados en extremos
 The percentage of years in the 2046–2065 period of RCP8.5 (the highest climate scenario) in which the summer temperature is greater than the respective maximum summer temperature of the 1986–2005 baseline period (Diffenbaugh and Giorgi, 2012). (b) The percentage of years in the period of RCP8.5 in which the summer precipitation is less than the respective minimum summer precipitation of the baseline period (Diffenbaugh and Giorgi, 2012). (c) The percentage difference in the 20-year return value of annual precipitation extremes between the period of RCP4.5 and the baseline period (from Kharin et al., 2013). The hatching indicates areas where the differences are not significant at the 5% level. (d) The percentage of years in the period of RCP8.5 in which the March snow water equivalent is less than the respective minimum March snow water equivalent of the 1976–2005 period (Diffenbaugh et al., 2012). The black (white) stippling indicate areas where the multimodel mean exceeds 1.0 (2.0) standard deviations of the multi-model spread. (a-d) The RCPs and time periods are those used in the peer-reviewed studies in which the panels appear. The period of RCP8.5 and the period of RCP4.5 exhibit global warming in the range of 2-3˚C above the pre-industrial baseline (WGI Fig ). The and periods of RCP8.5 exhibit global warming in the range of 4-5˚C above the pre-industrial baseline (WGI Fig ). Cambios proyectados en extremos.")
16
IMPACTOS SEVEROS Y PROFUNDOS
A MAYOR CALENTAMIENTO MAYOR PROBABILIDAD DE IMPACTOS SEVEROS Y PROFUNDOS THE LIKELIHOOD OF INCREASING MAGNITUDES OF WARMING INCREASE SEVERE AND PERVASIVE IMPACTS

17
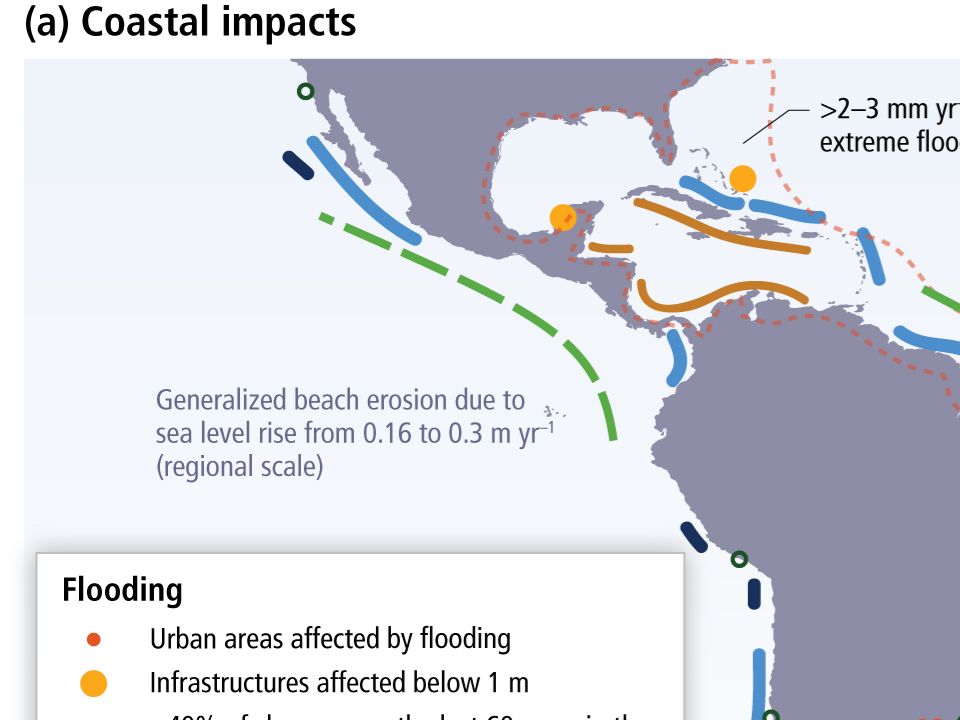
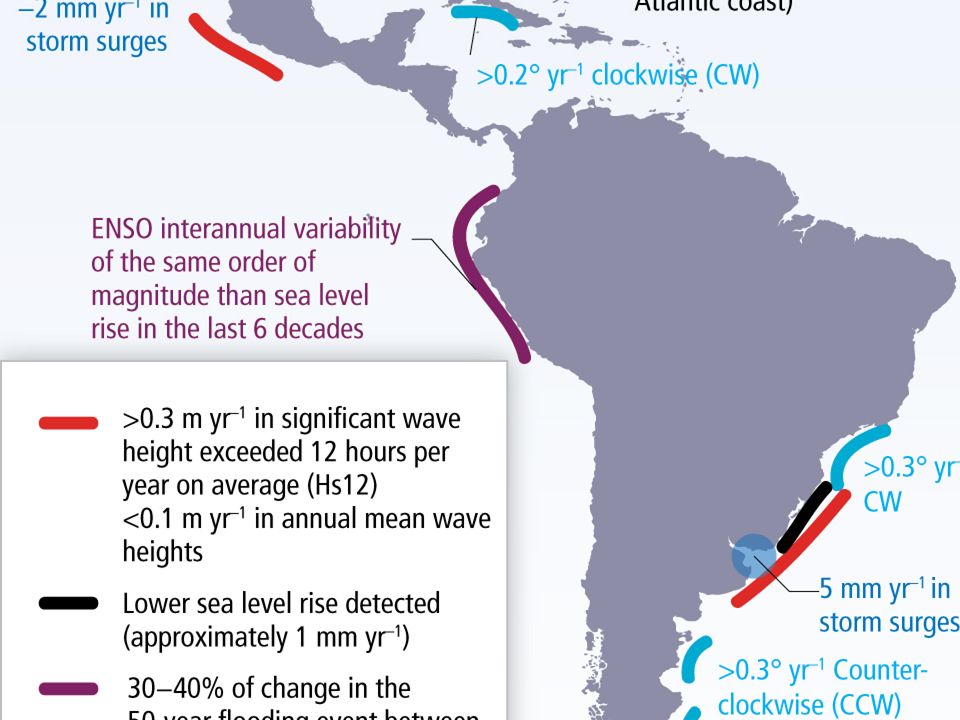
Large magnitude High probability Irreversibility Floods/Inundaciones
Wildfires/Incendios Impact Large magnitude High probability Irreversibility Vulnerability or exposure Limited mitigation or adaptation potential Water/agua Dislocación de infraestructuras costeras

18
Food security/seguridad alimentaria
Animales marinos/Marine animals Food security/seguridad alimentaria Salud urbana/urban health Animales terrestres Land animals

20
CAMBIO CLIMATICO CLIMATE CHANGE ES UN RETO A LA GESTION DE RIESGO
A CHALLENGE IN MANAGING RISKS

21
Approaches for managing the risks of climate change
Table SPM.1: Approaches for managing the risks of climate change. These approaches should be considered overlapping rather than discrete, and they are often pursued simultaneously. Mitigation is considered essential for managing the risks of climate change. It is not addressed in this table as mitigation is the focus of WGIII AR5. Examples are presented in no specific order and can be relevant to more than one category. (IPCC SPM 2014)
")
22
ADAPTATION IS ALREADY OCCURING https://www.google.com
4. Regional options for adapting to climate change - Adaptation experience is accumulating in North America. - Adaptation actions are faced with barriers however, i.e., challenges and sources of resistance facing planners at both the planning and implementation stages, particularly the adequacy of informational, institutional, financial and human resources, and lack of political will. - The question of limits to adaptation which brings me to the last point

23
Acciones climáticas en ciudad de México, New York y Vancouver
Líderes enfrentados a riesgos múltiples Sus programas climáticos son ambiciosos Tensión entre crecimiento y mitigación de riesgo Adaptación y gestión de riesgo enfrentan retos institucionales Coordinación entre niveles y sectores Conflictos políticos y de prioridades entre actores sectores

24
Incertidumbres, vacíos y necesidades de investigación
Crecimiento en investigación sobre AIV Considerable en US y Canadá no en México Prevalecen estudios sectoriales Se necesitan análisis integrales de articulaciones especificas de Procesos de desarrollo, físicos, y climáticos determinantes de riesgo climáticos regionales/locales Dinámicas y factores sociales y físicos determinantes de diferencias de vulnerabilidad a diferentes escalas

Presentaciones similares