Descargar la presentación
La descarga está en progreso. Por favor, espere

52
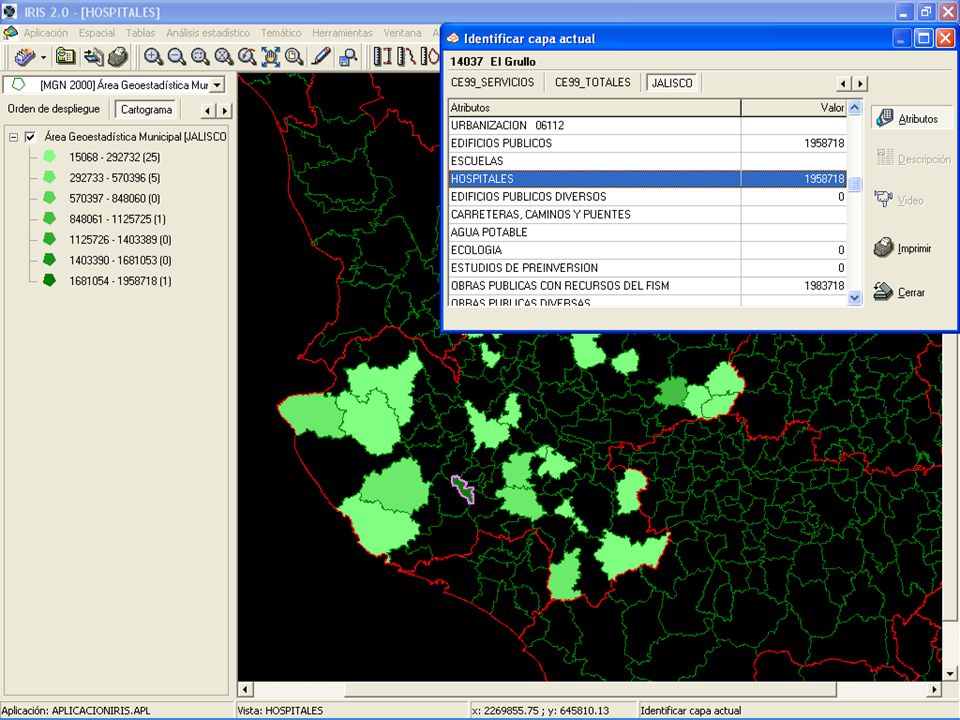
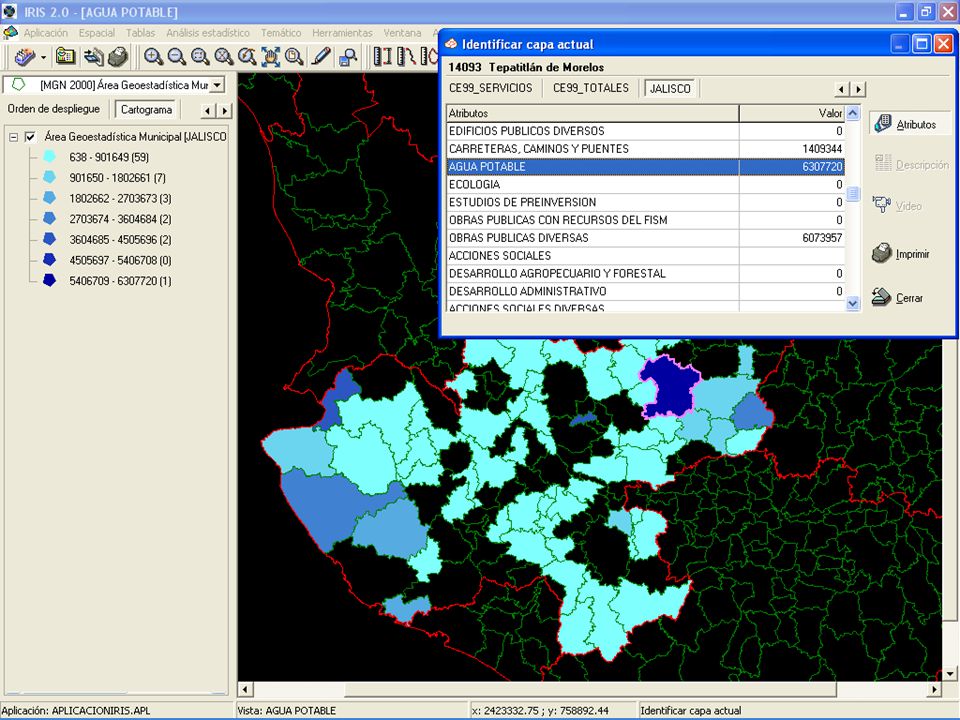
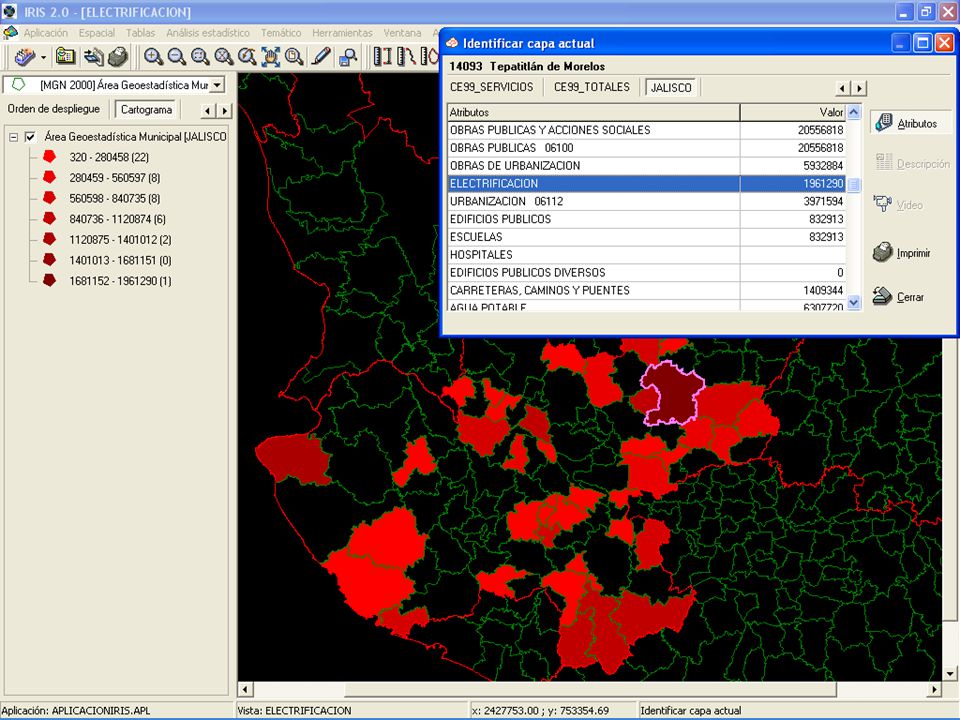
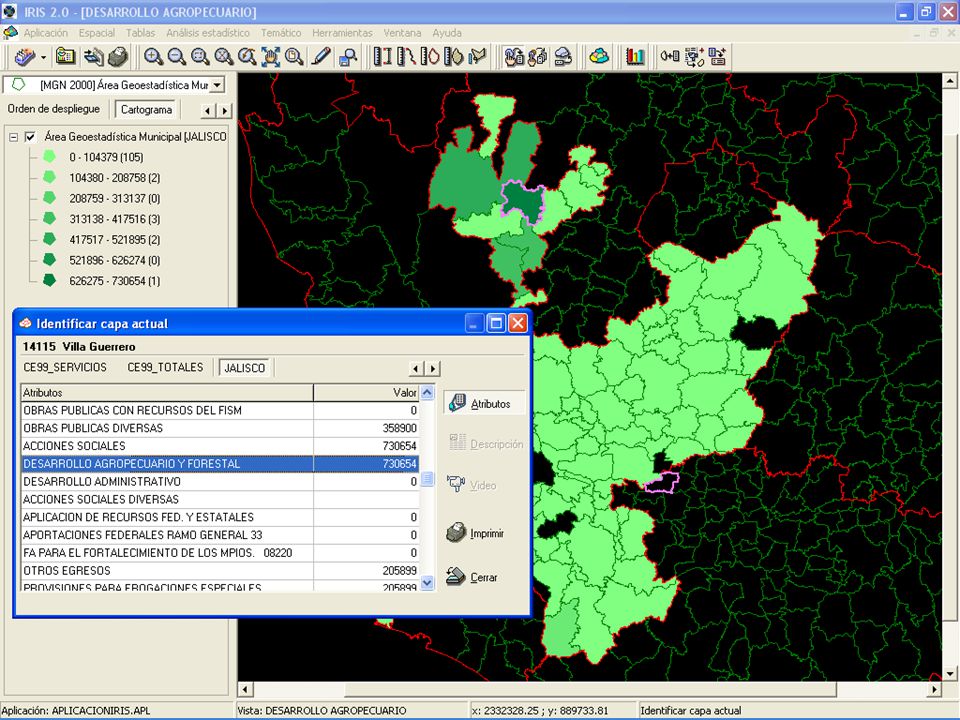
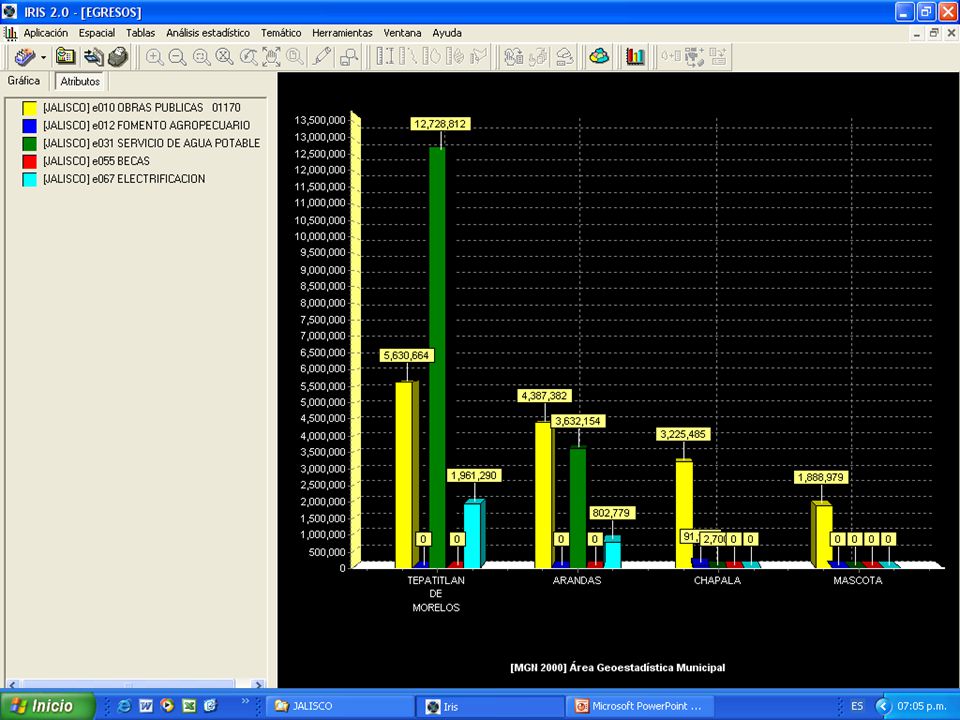
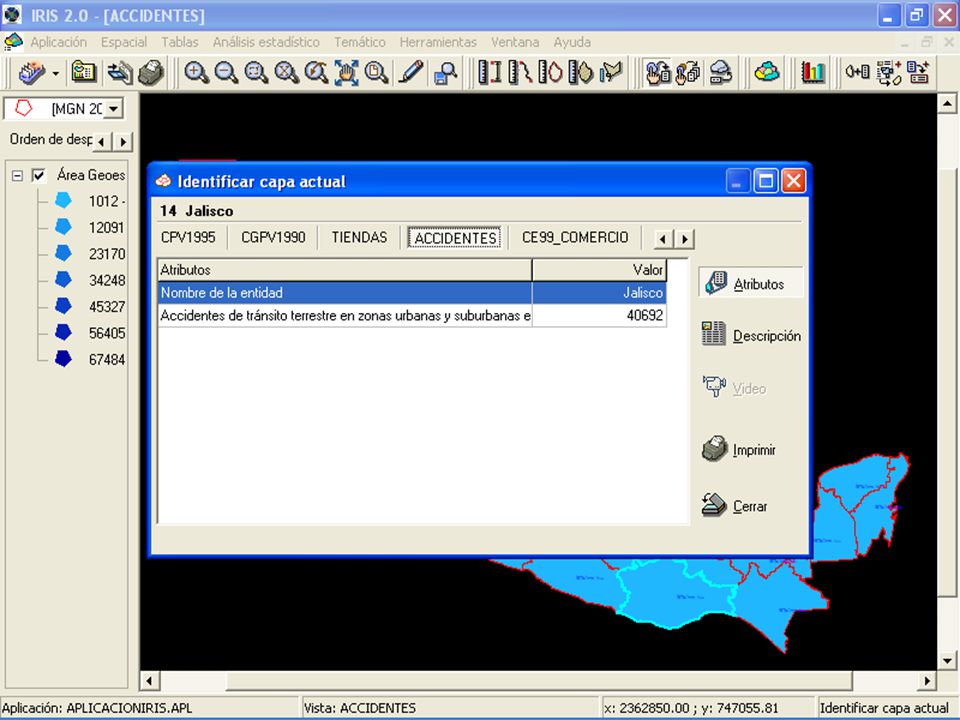
INGRESOS / EGRESOS Municipios Jalisco

59
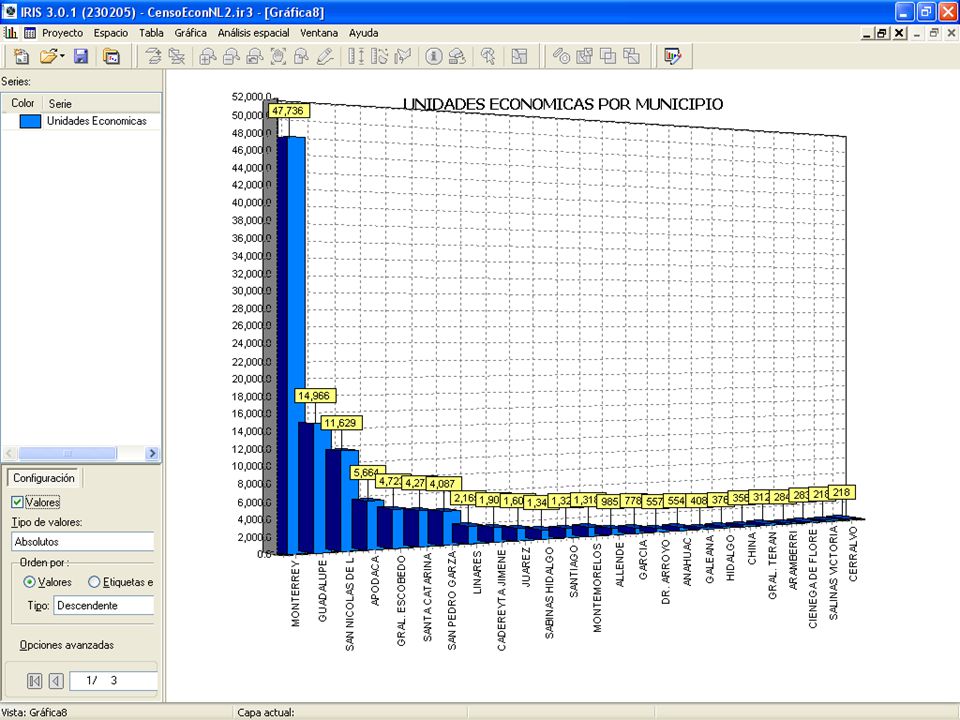
CENSOS ECONOMICOS 2004 Nuevo León

60
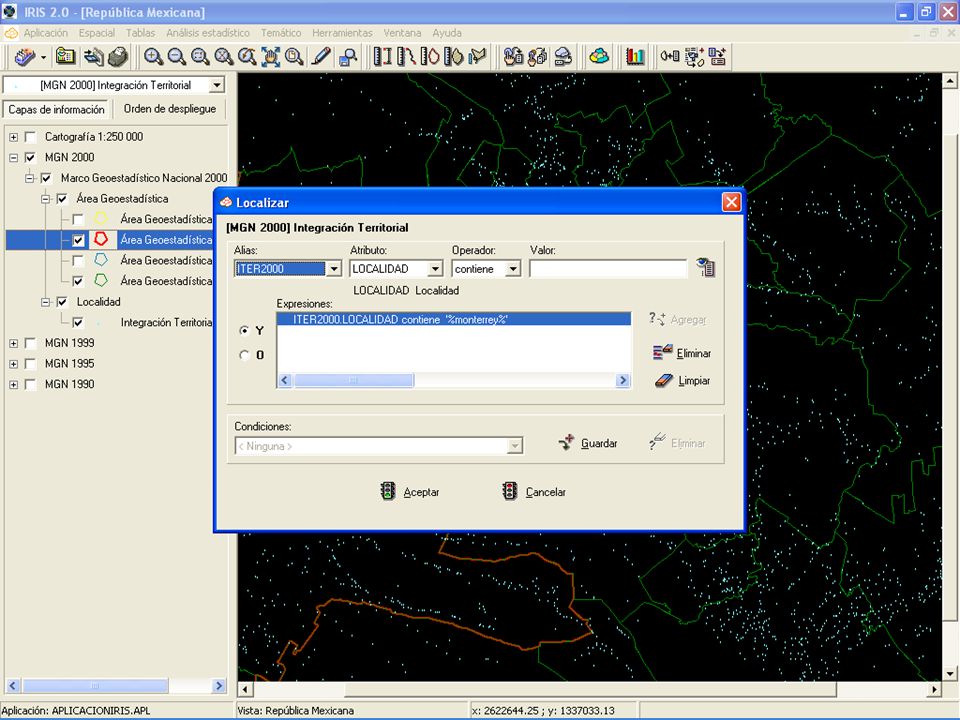
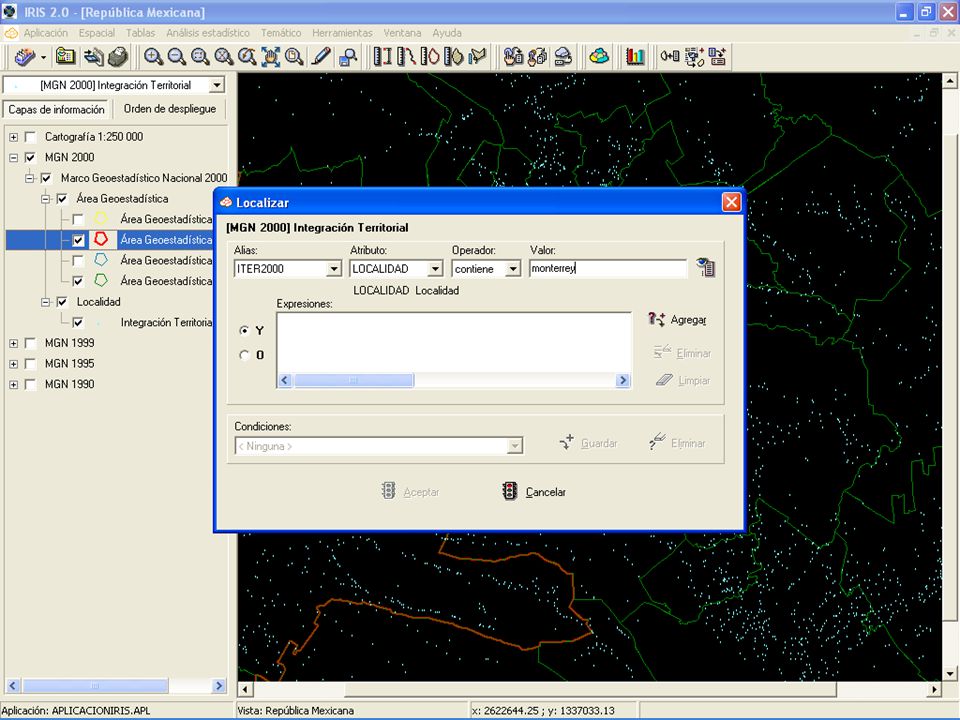
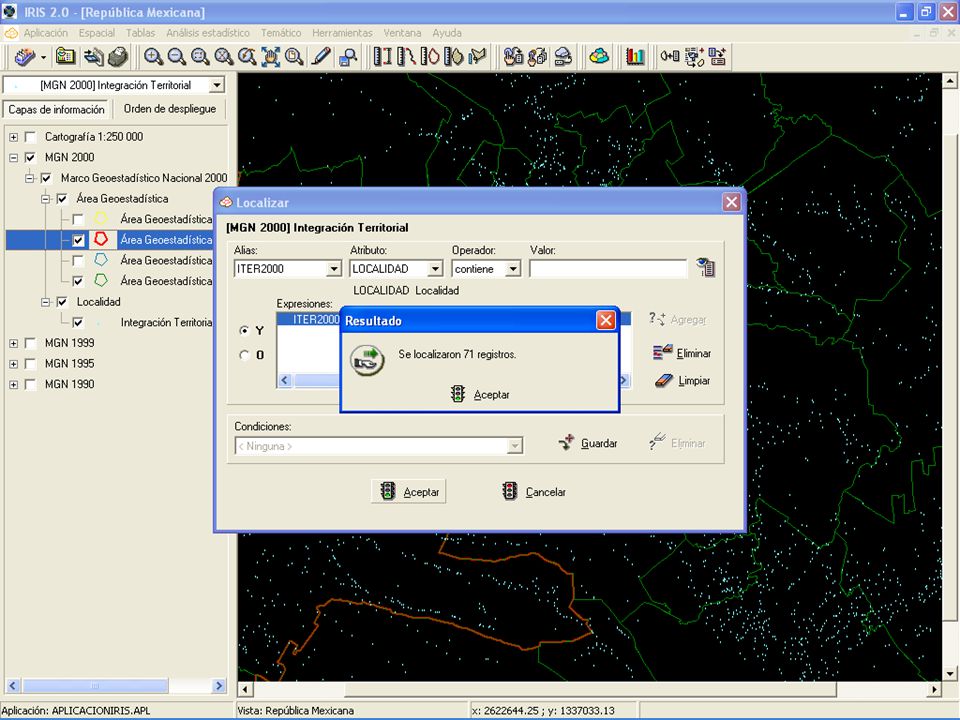
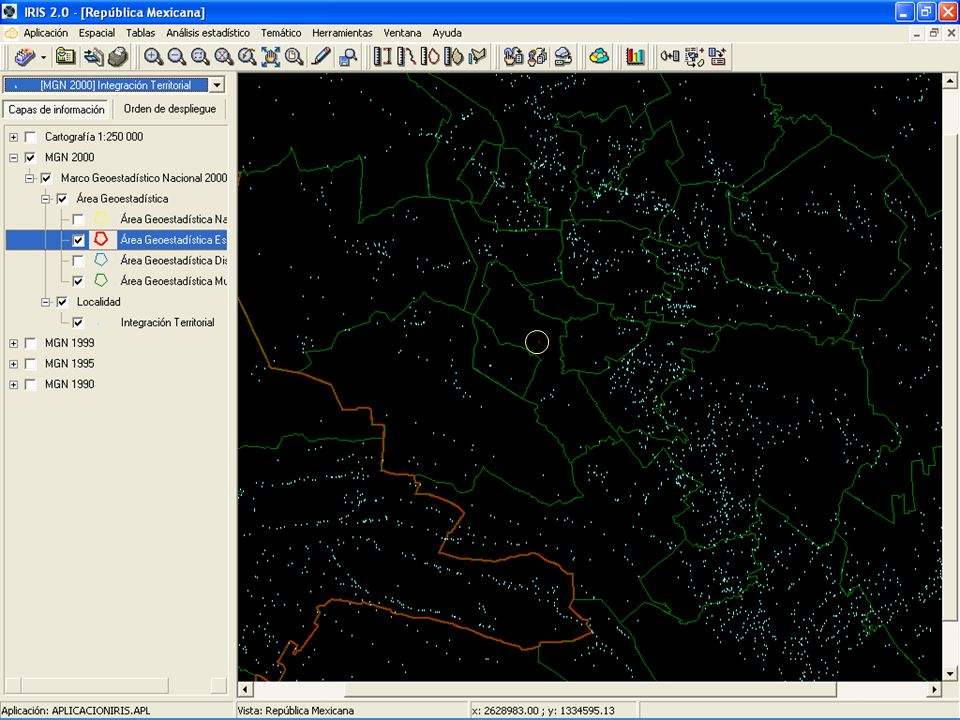
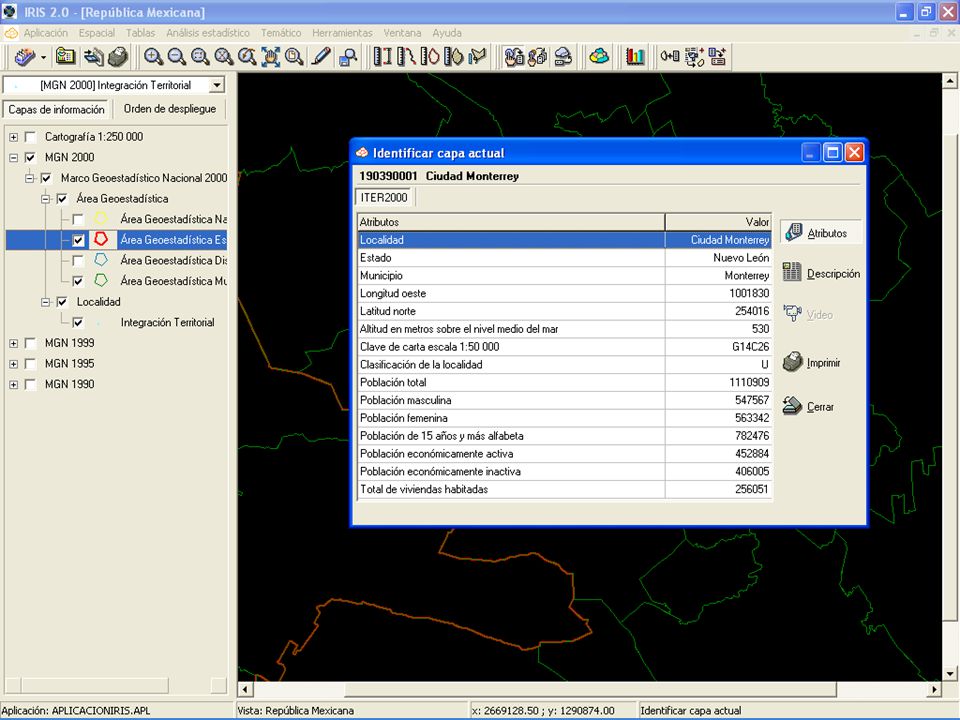
UNIDADES ECONOMICAS Monterrey

61
UNIDADES ECONOMICAS Guadalupe

63
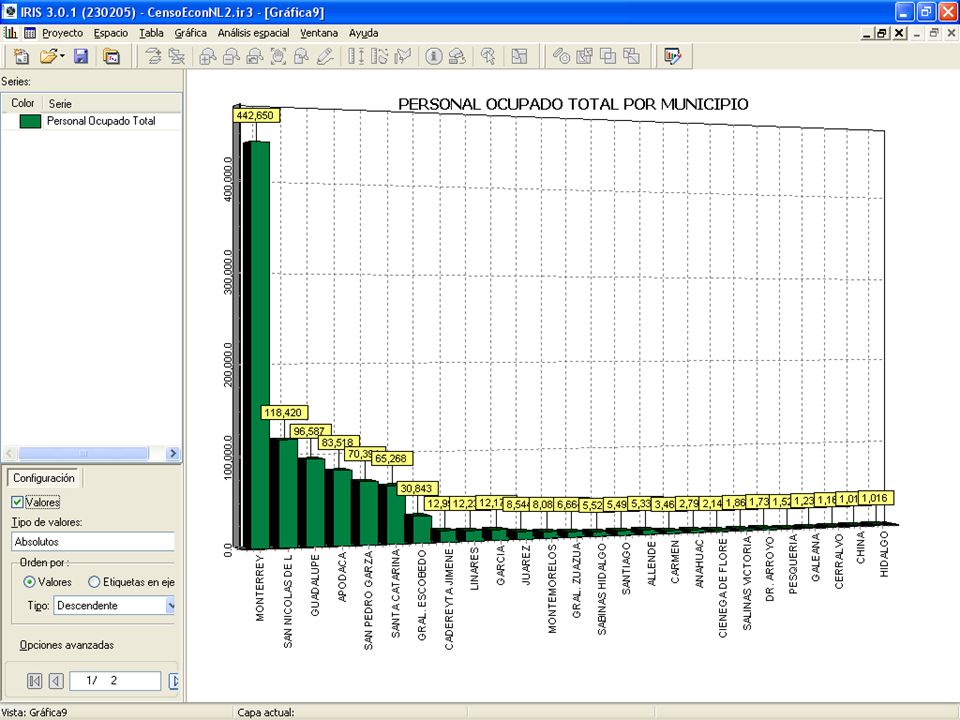
PERSONAL OCUPADO Monterrey

64
PERSONAL OCUPADO San Nicolás

66
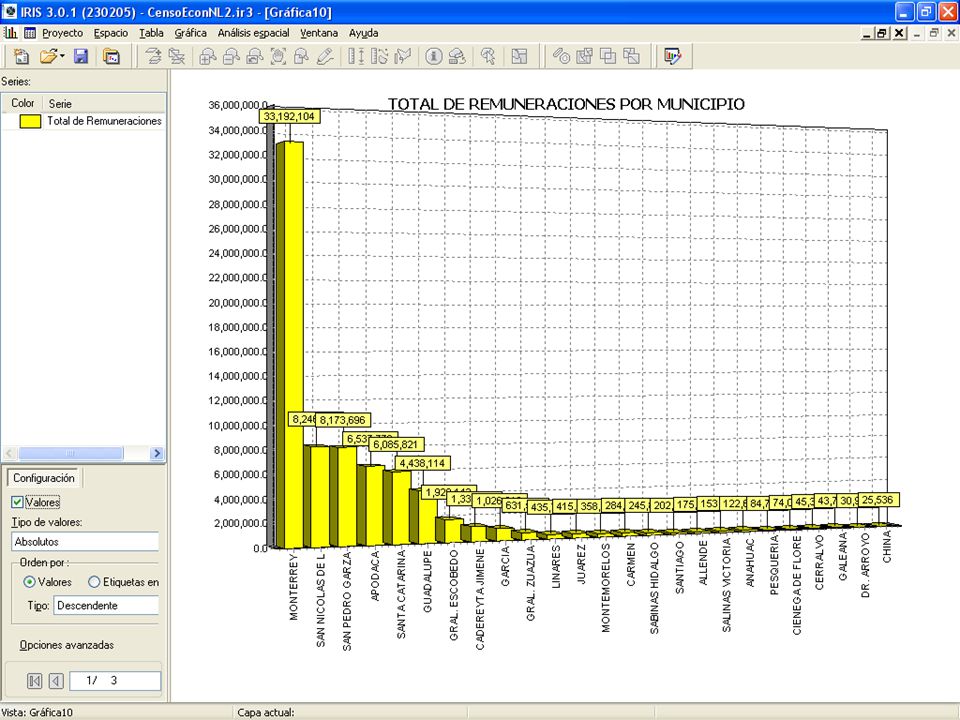
REMUNERACIONES Monterrey

67
REMUNERACIONES San Nicolás de los Garza

68
REMUNERACIONES San Pedro Garza García

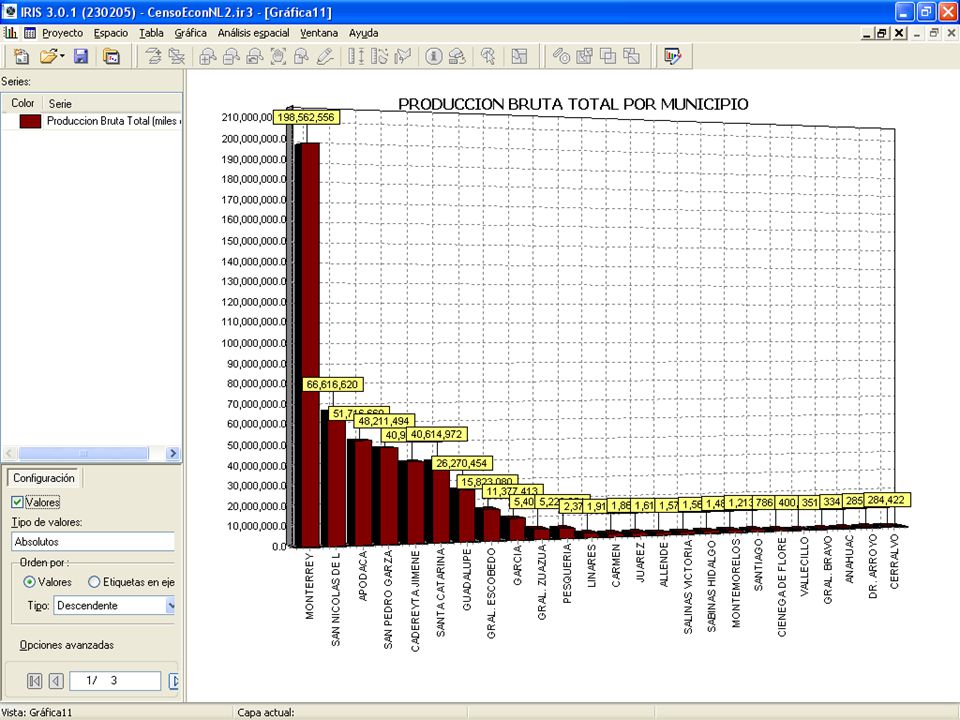
70
PRODUCCION BRUTA TOTAL Monterrey

71
PRODUCCION BRUTA TOTAL San Nicolás de los Garza

72
PRODUCCION BRUTA TOTAL San Pedro Garza García

73
PRODUCCION BRUTA TOTAL Cadereyta

74
PRODUCCION BRUTA TOTAL Santa Catarina

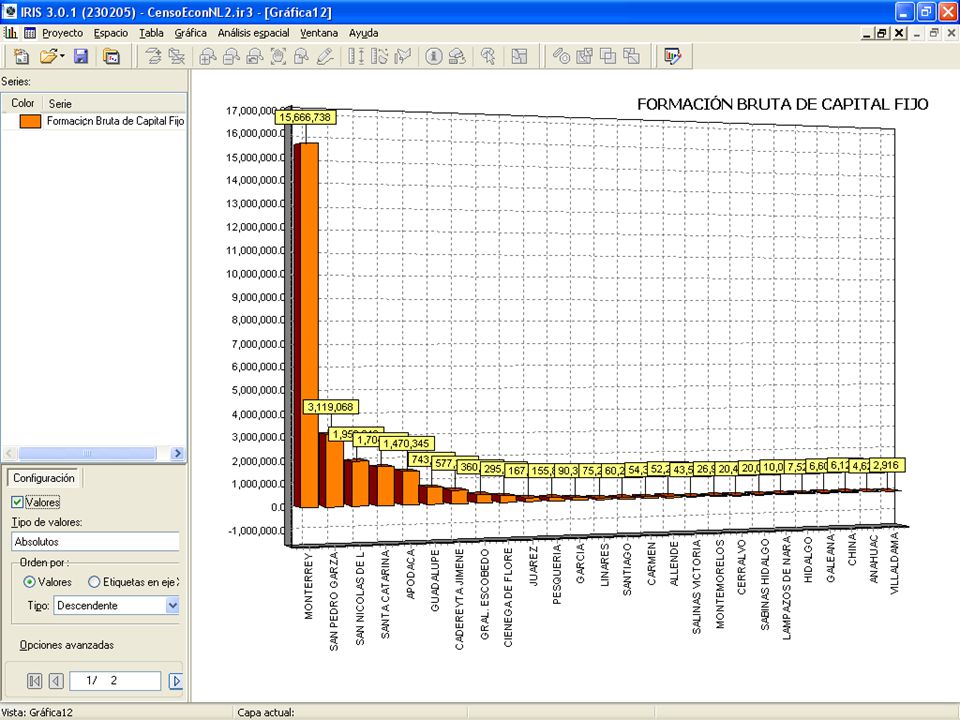
76
FORMACION BRUTA DE CAPITAL Monterrey

77
FORMACION BRUTA DE CAPITAL San Pedro Garza García

79
ACTIVOS FIJOS Monterrey

80
ACTIVOS FIJOS San Pedro Garza García

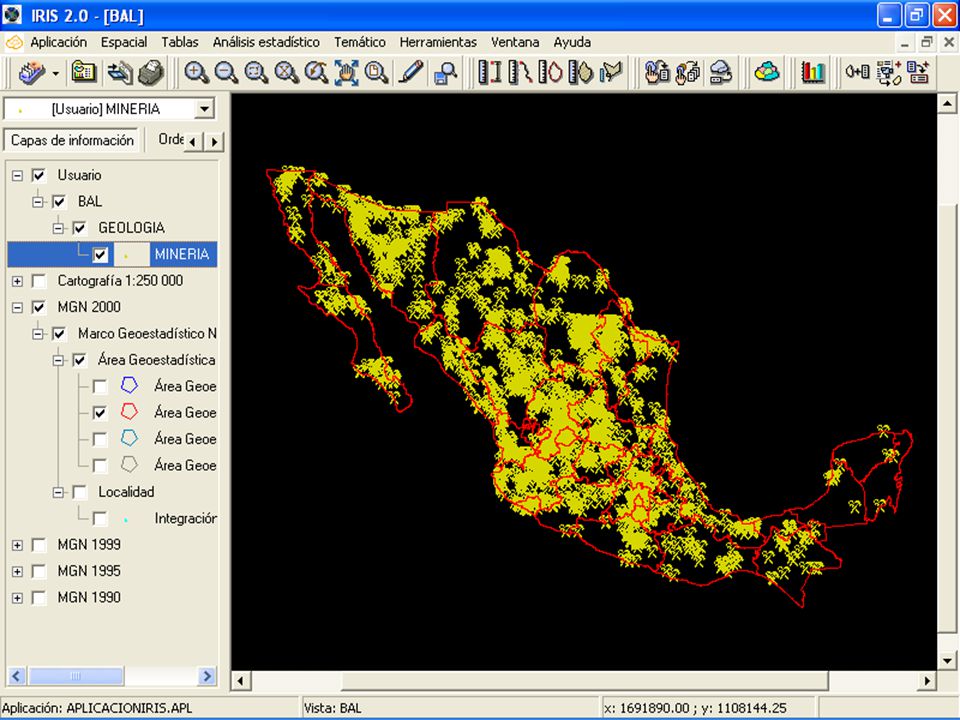
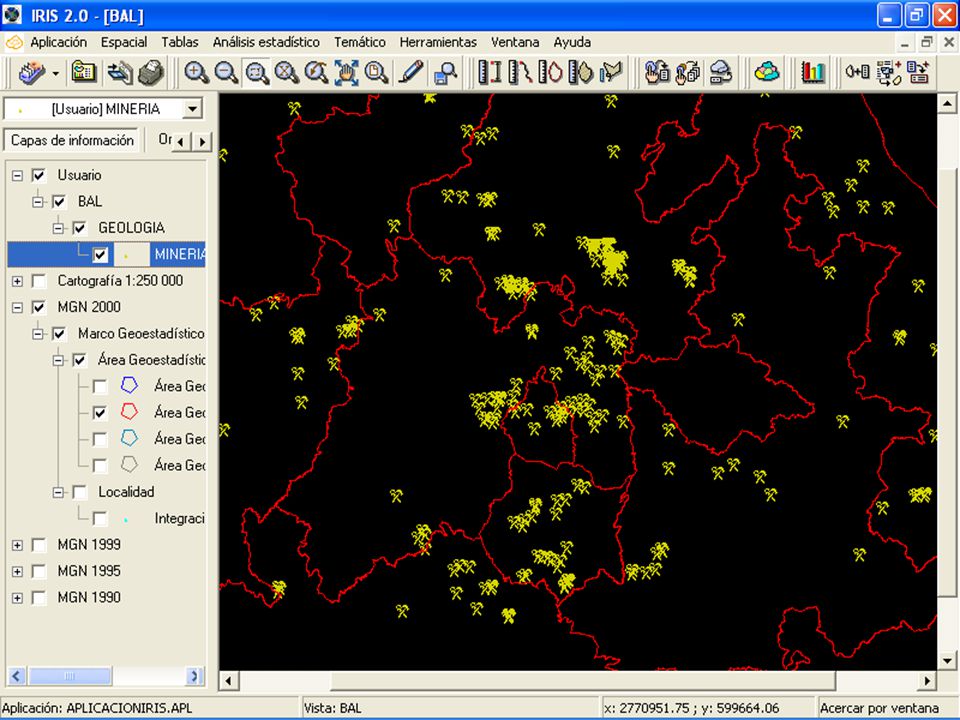
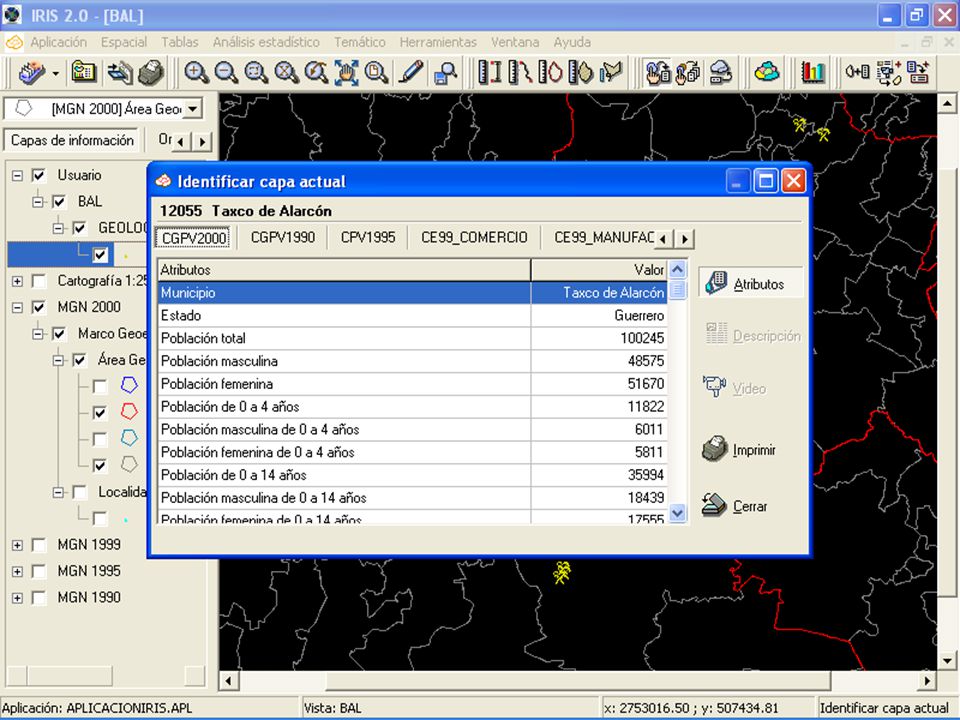
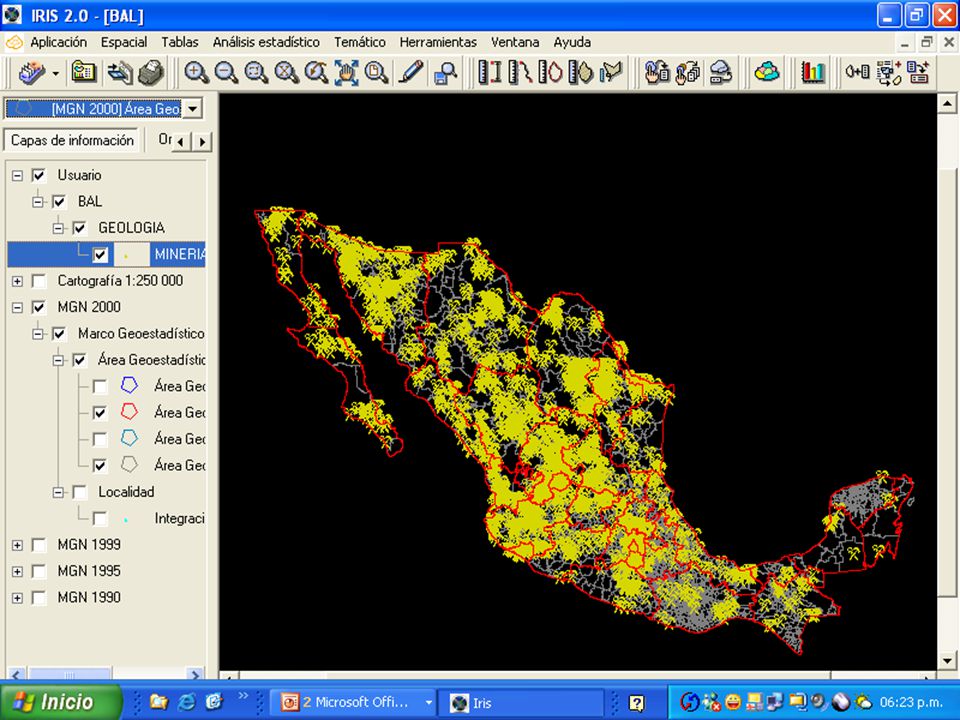
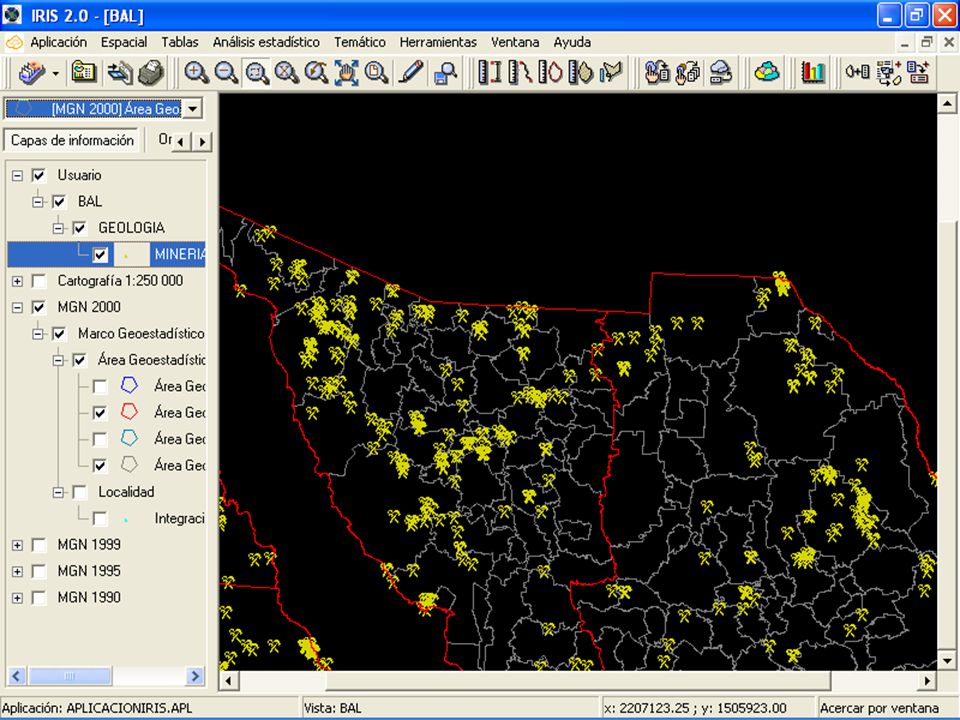
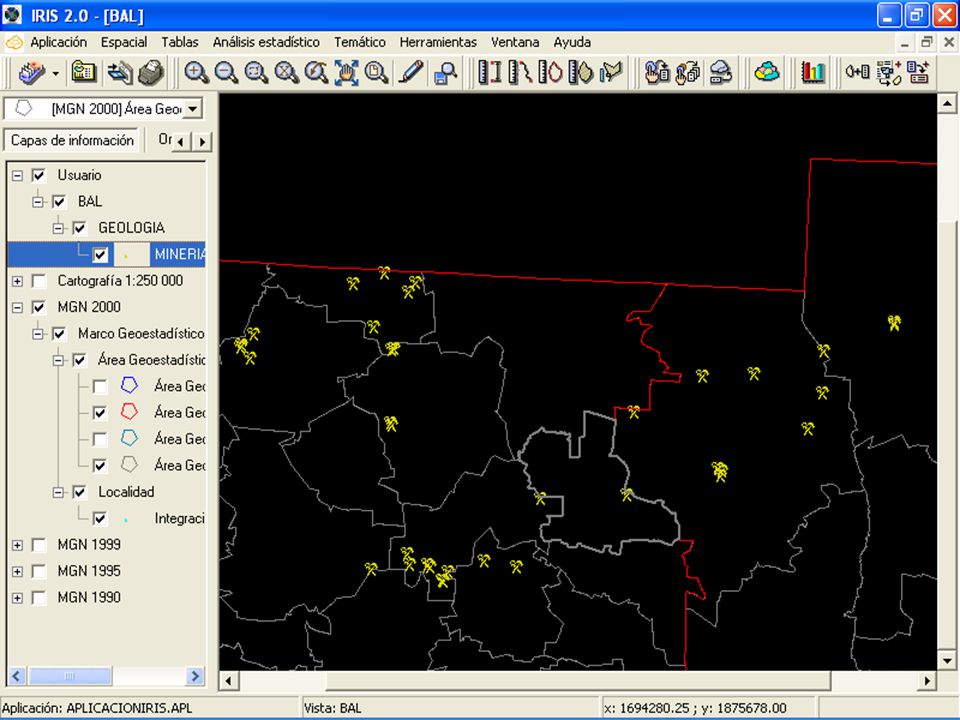
81
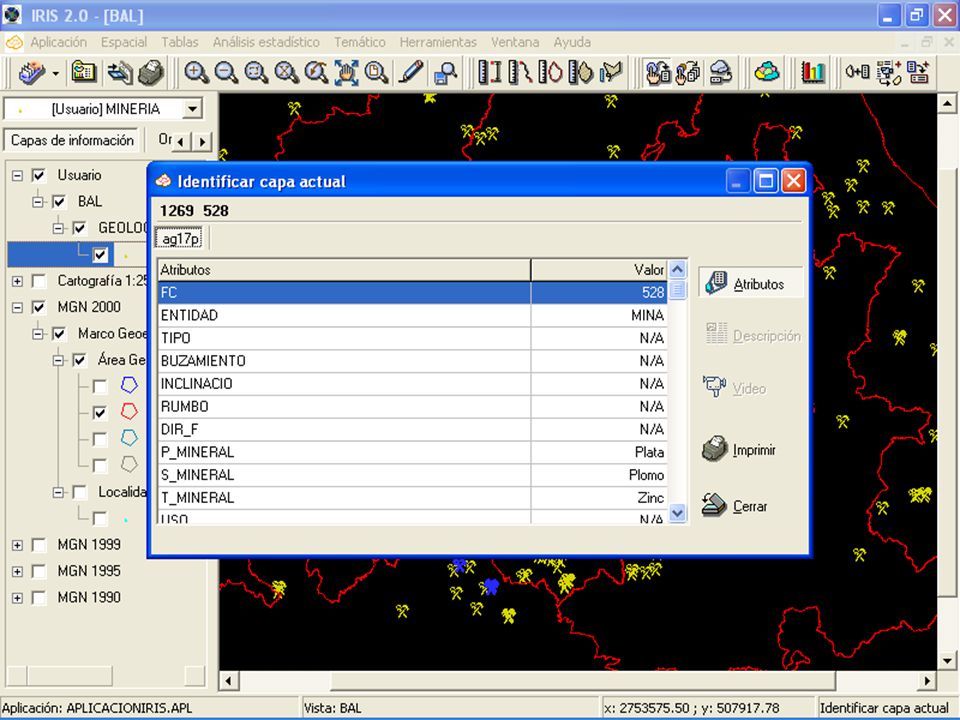
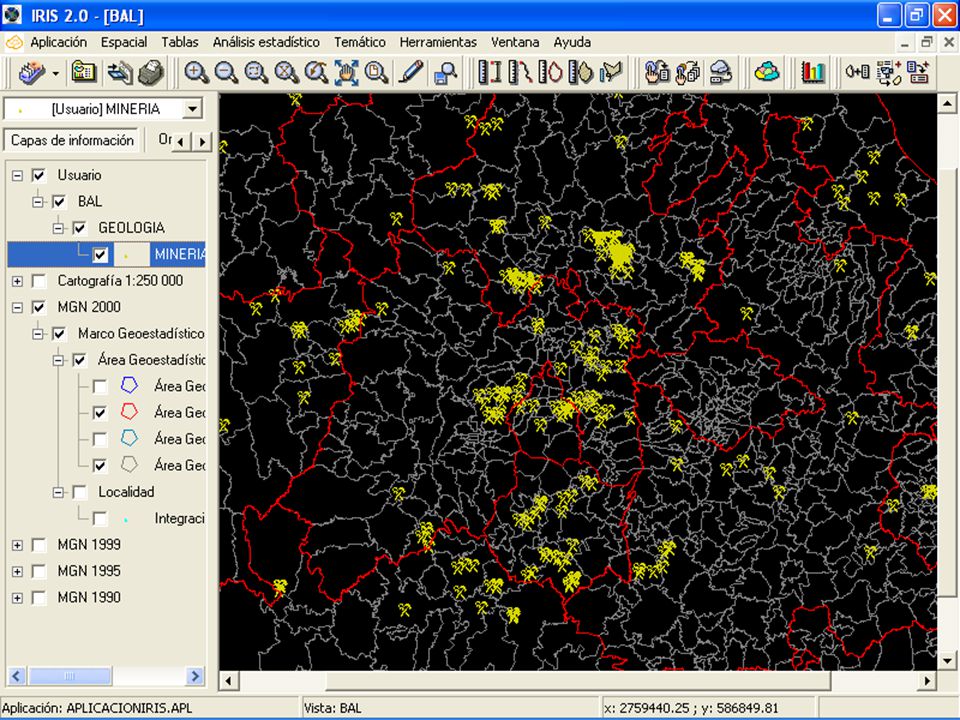
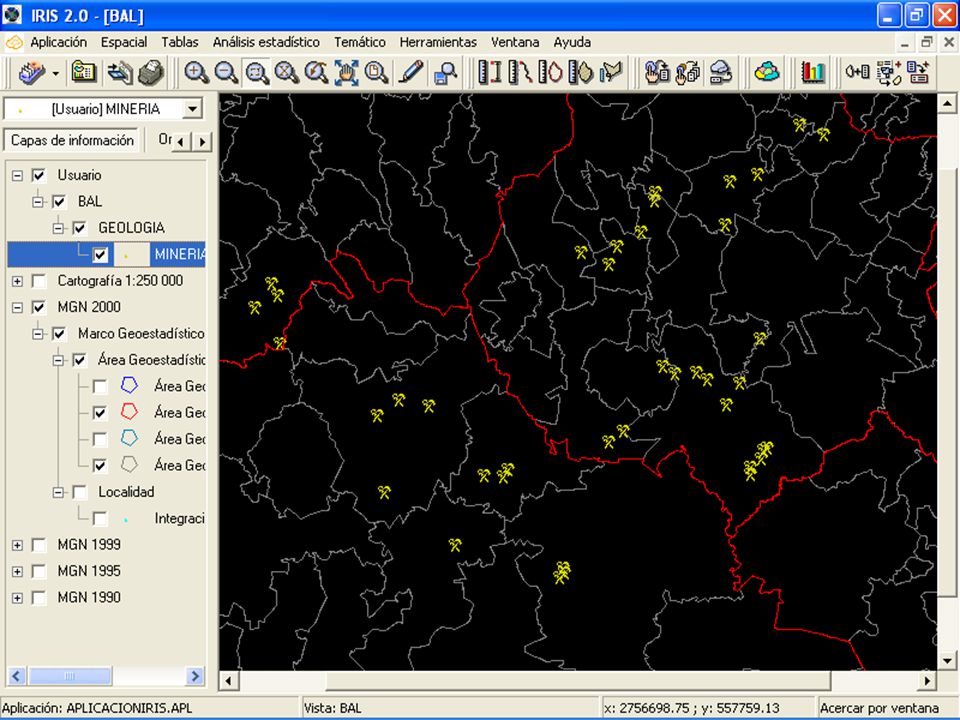
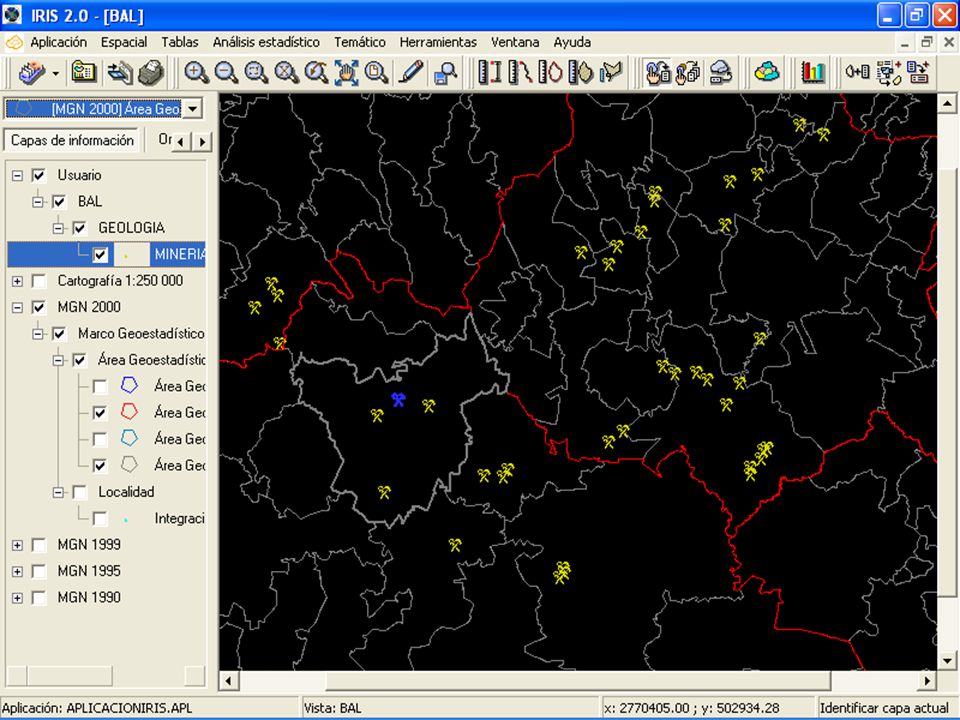
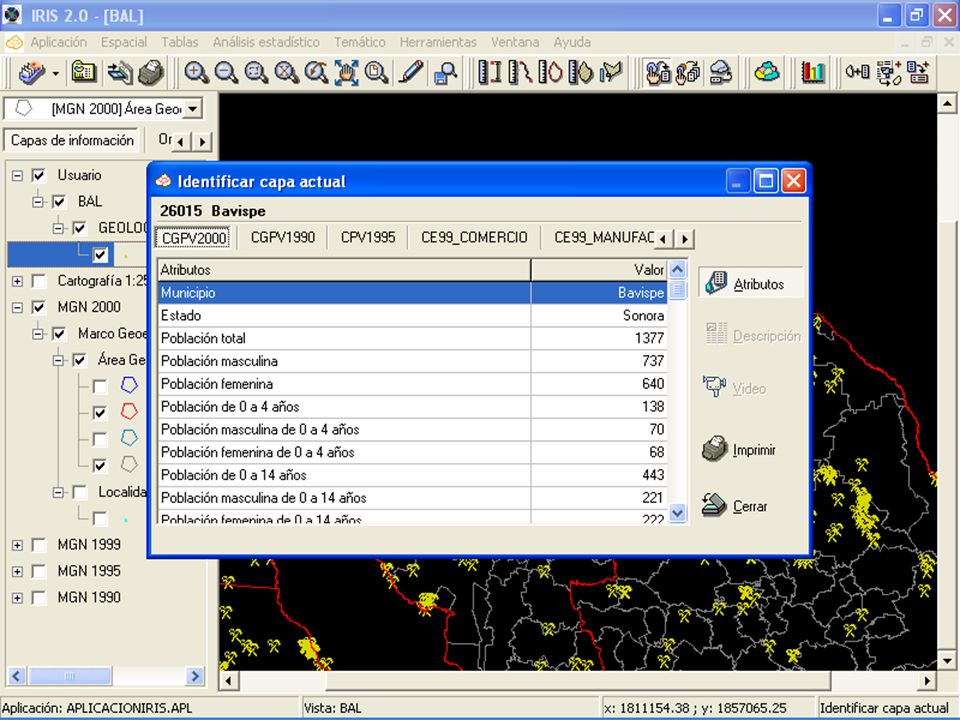
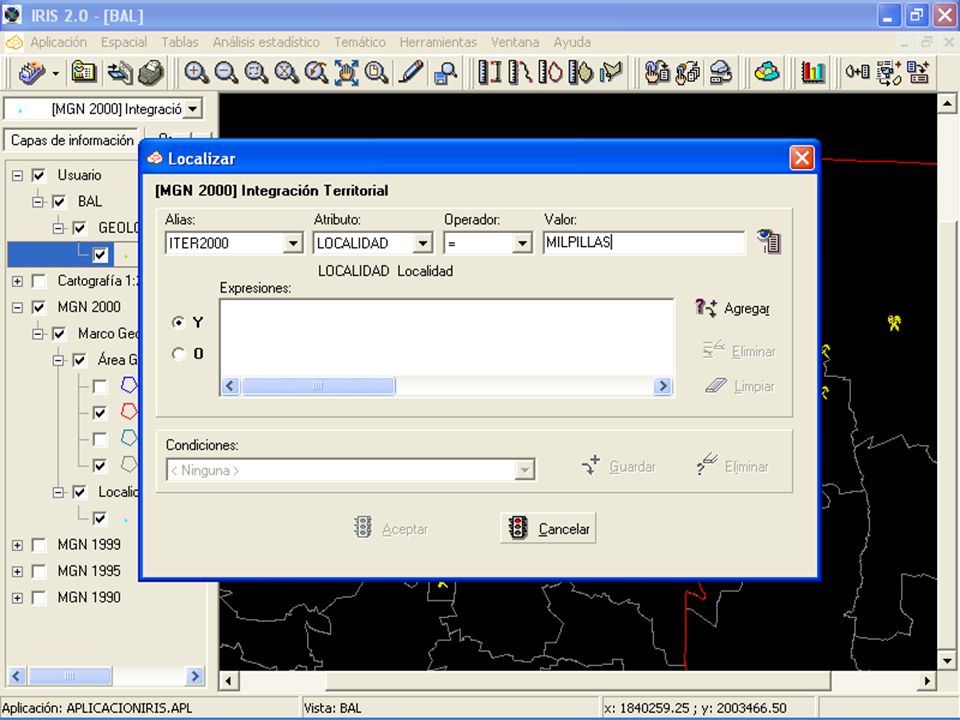
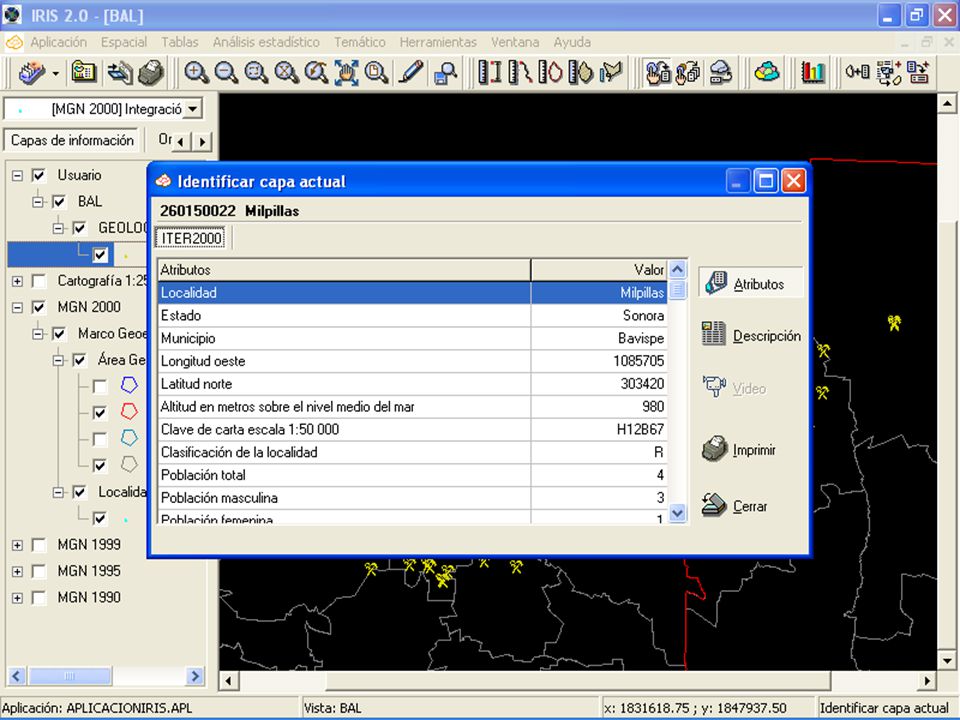
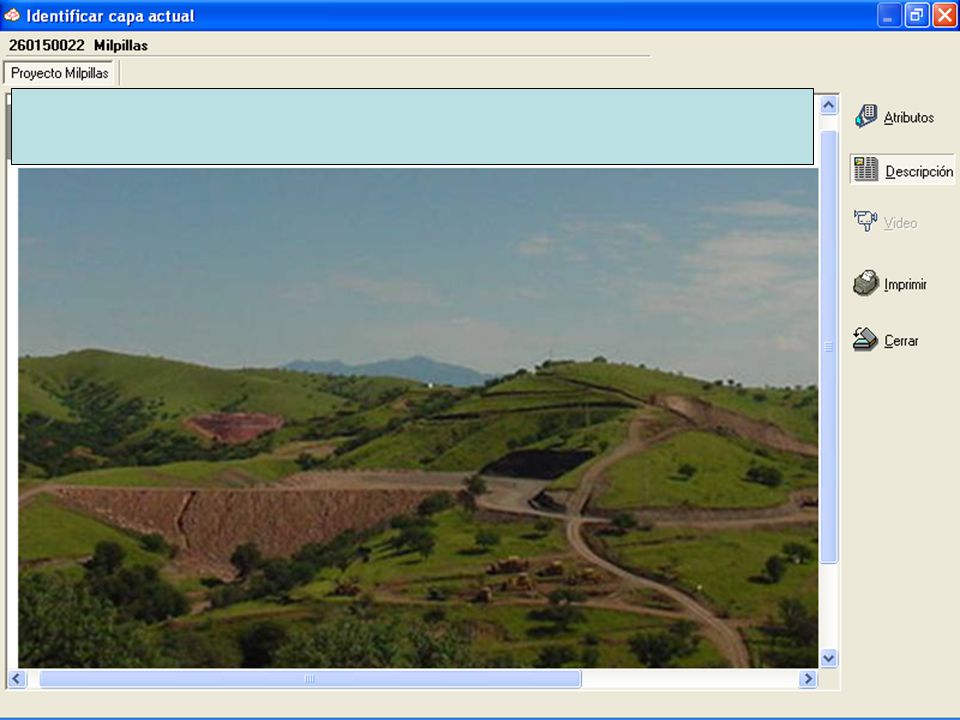
MINAS

103
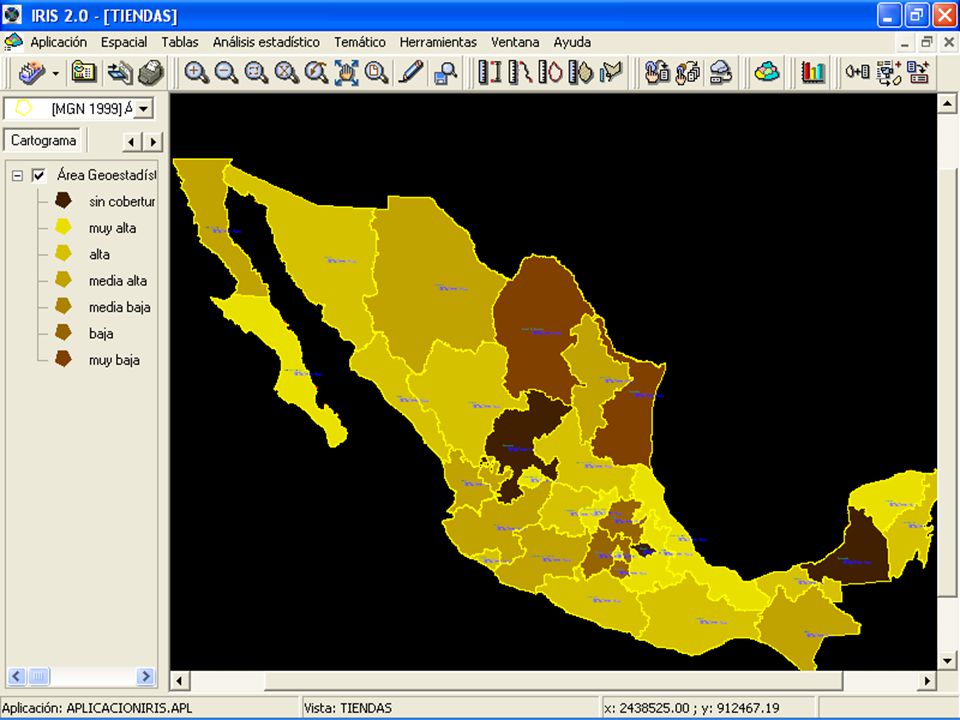
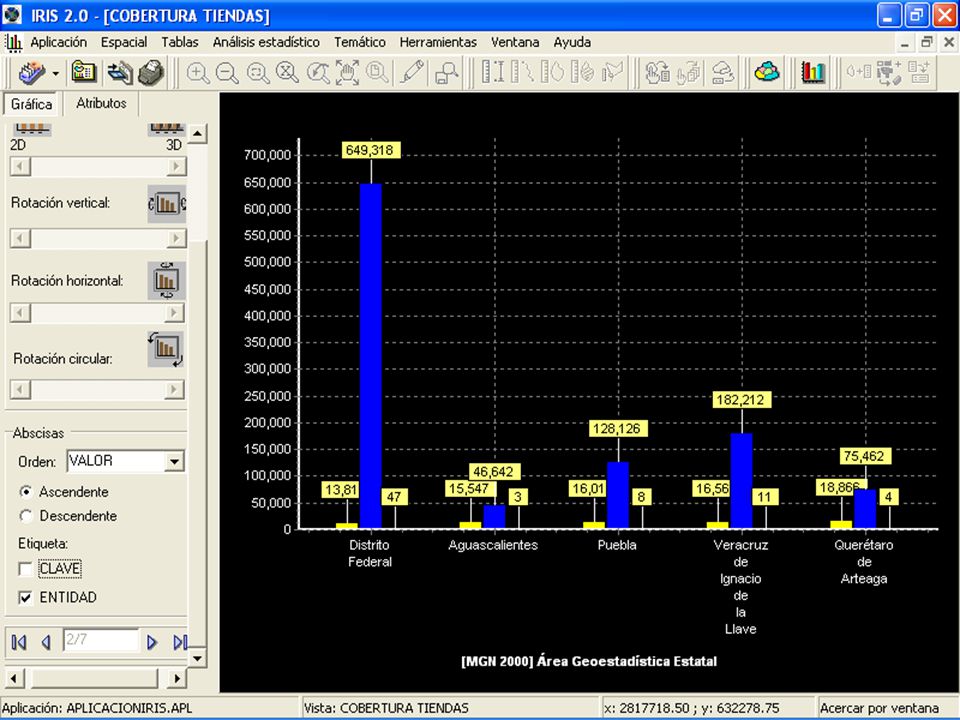
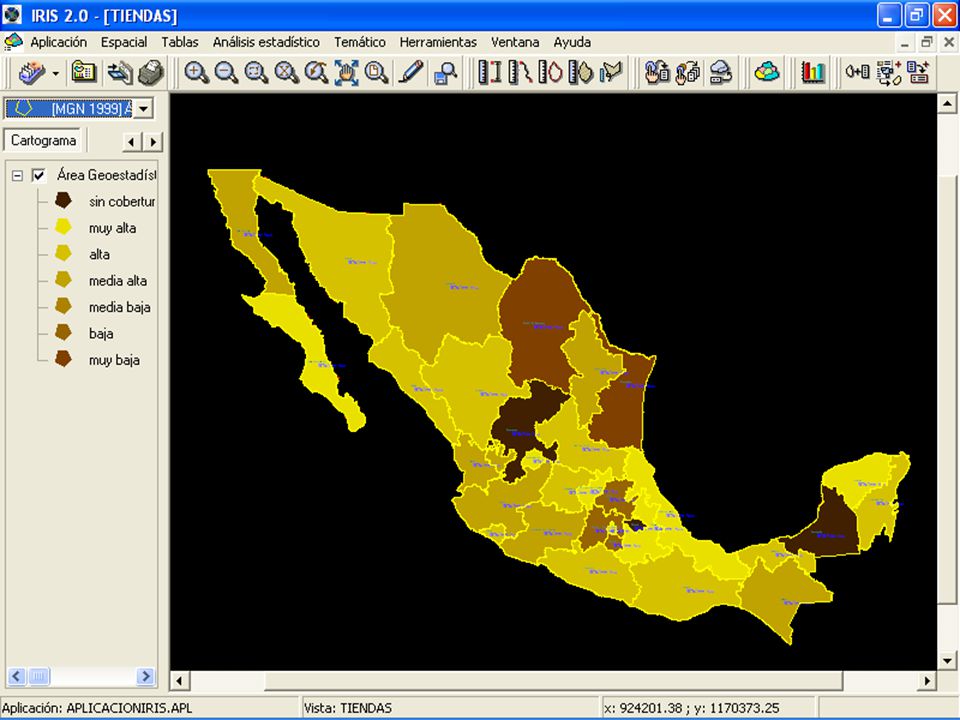
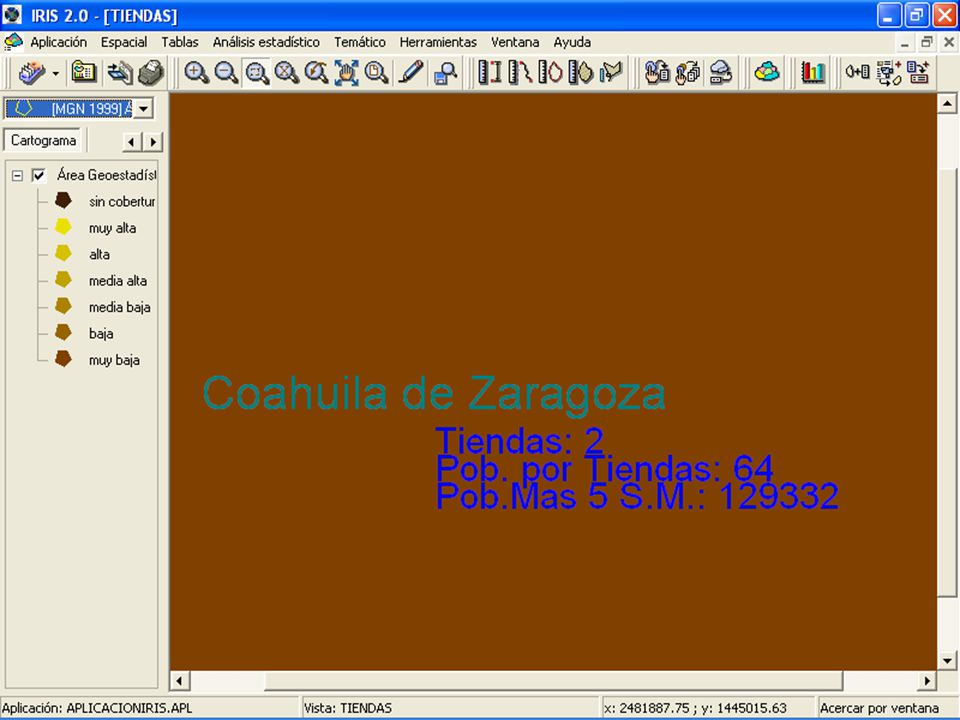
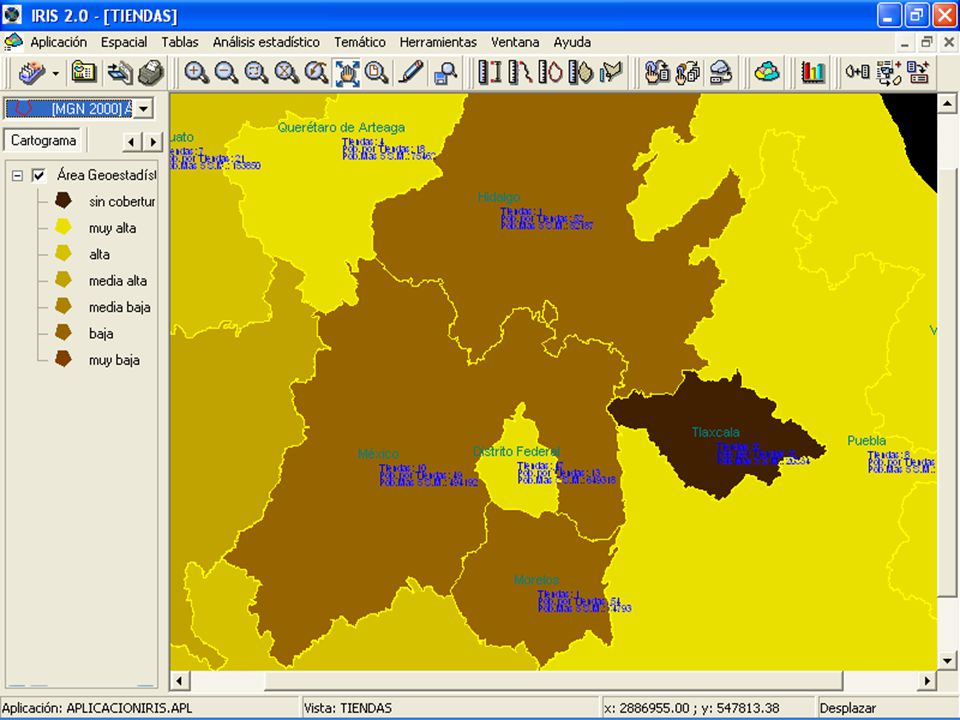
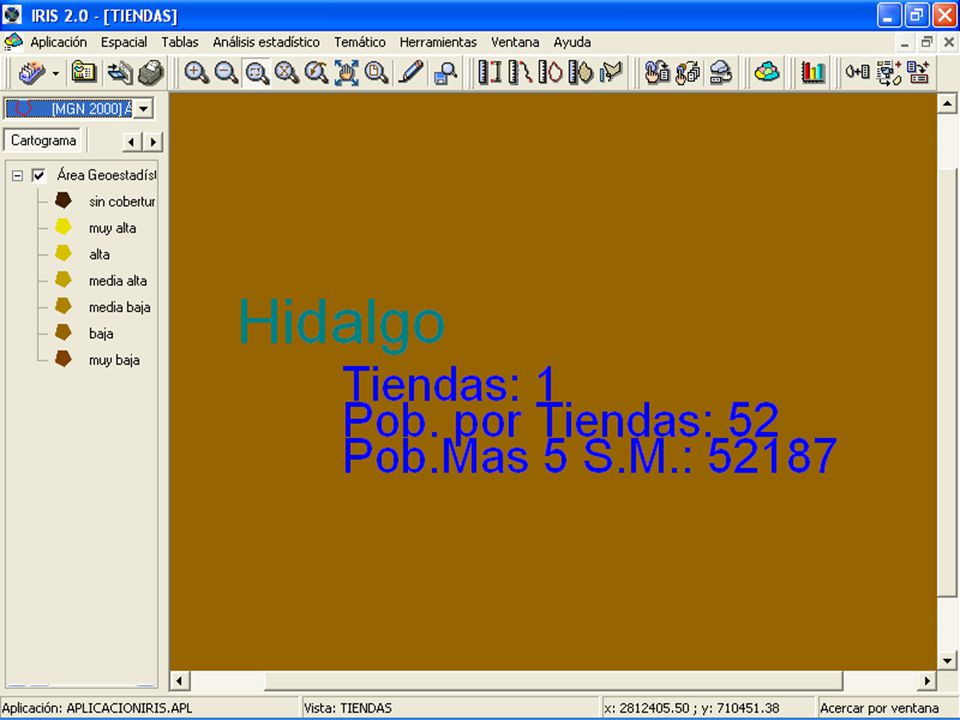
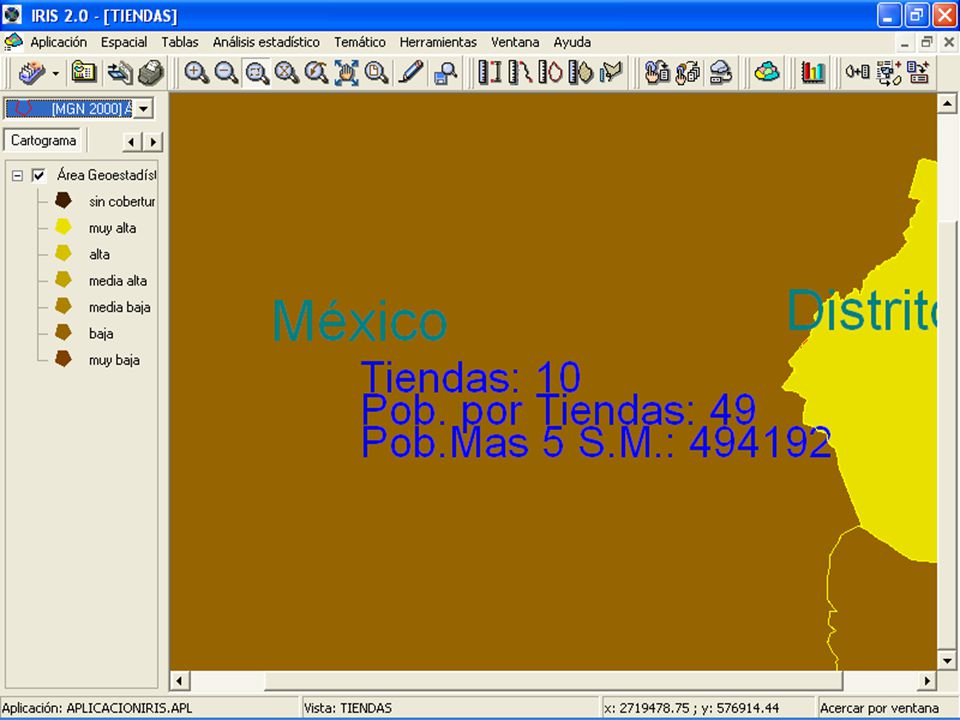
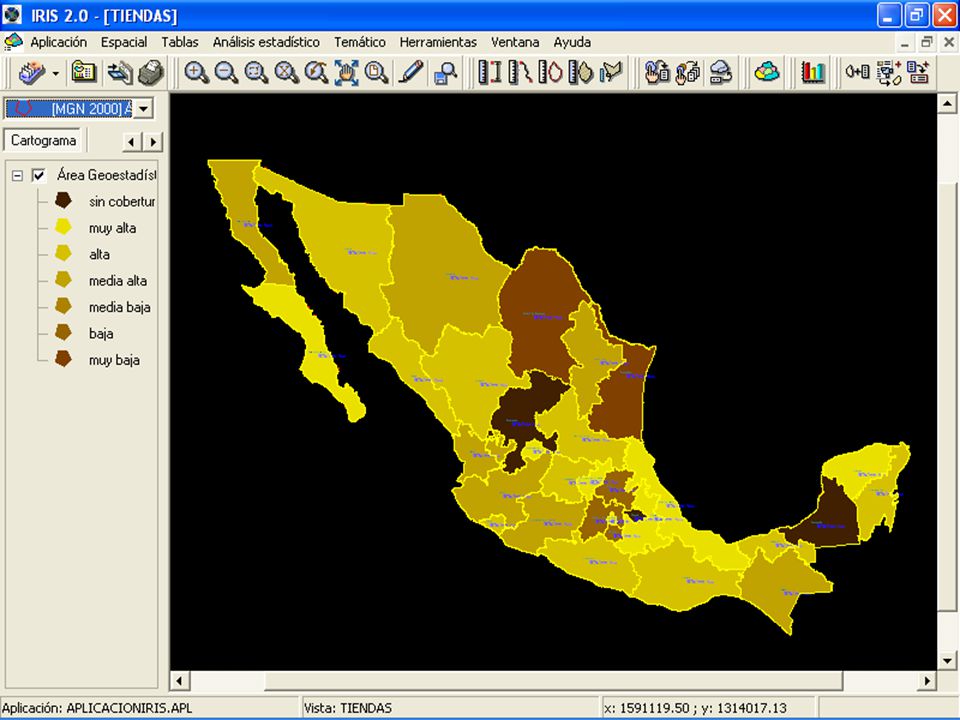
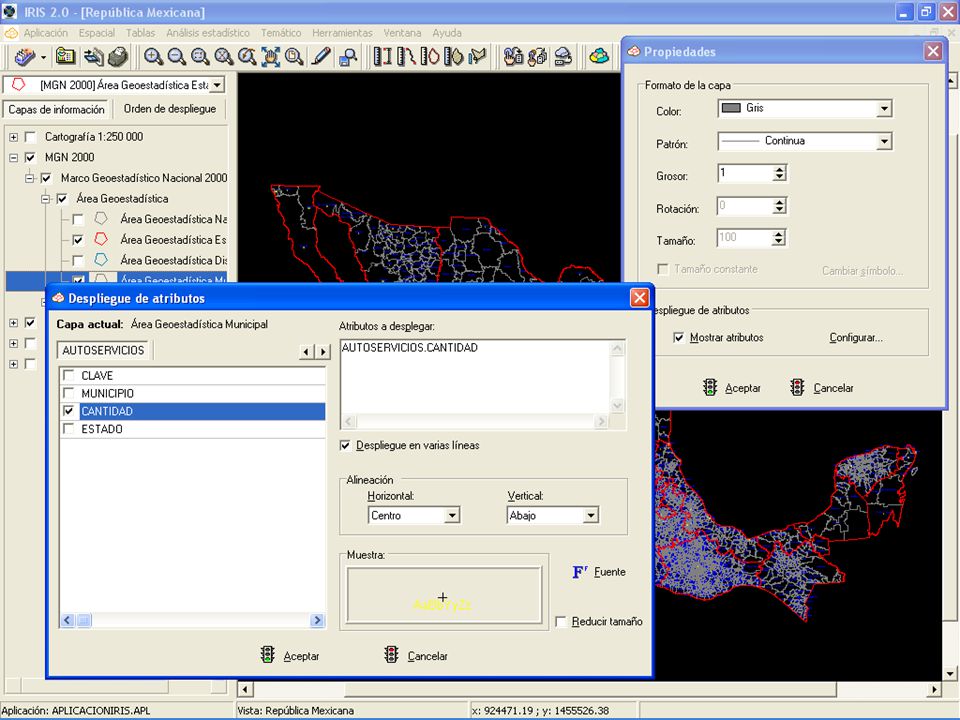
DEPARTAMENTALES Y AUTOSERVICIOS

105
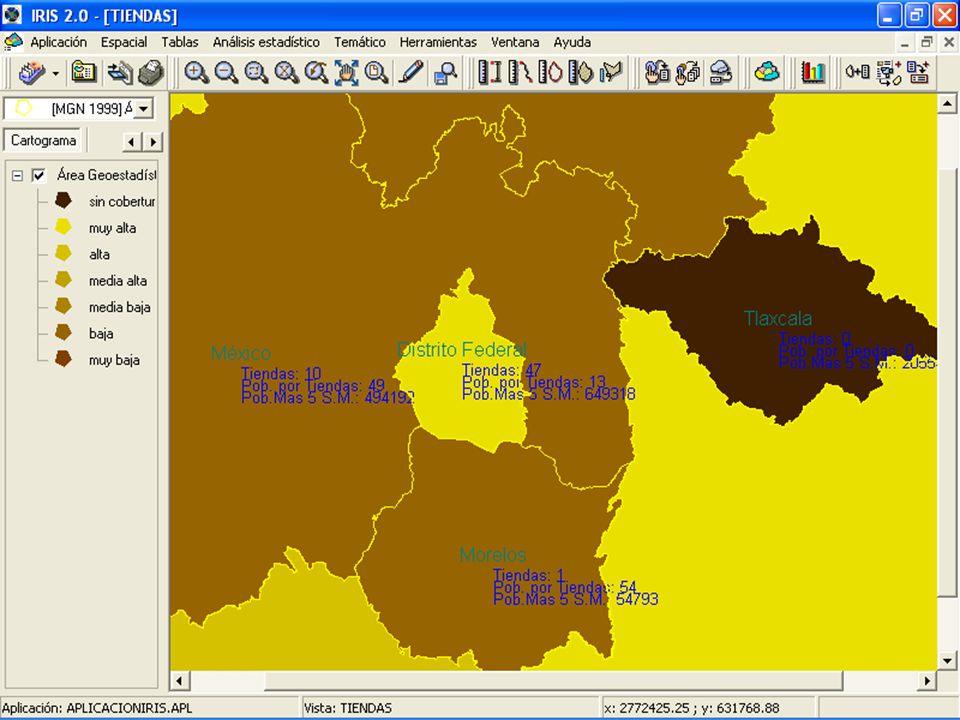
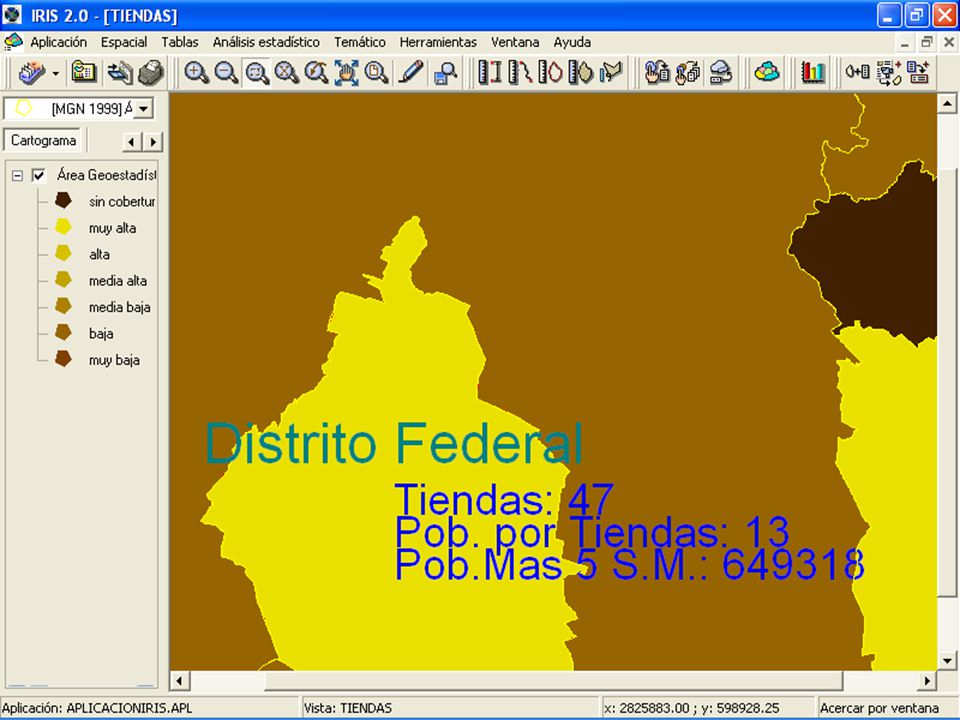
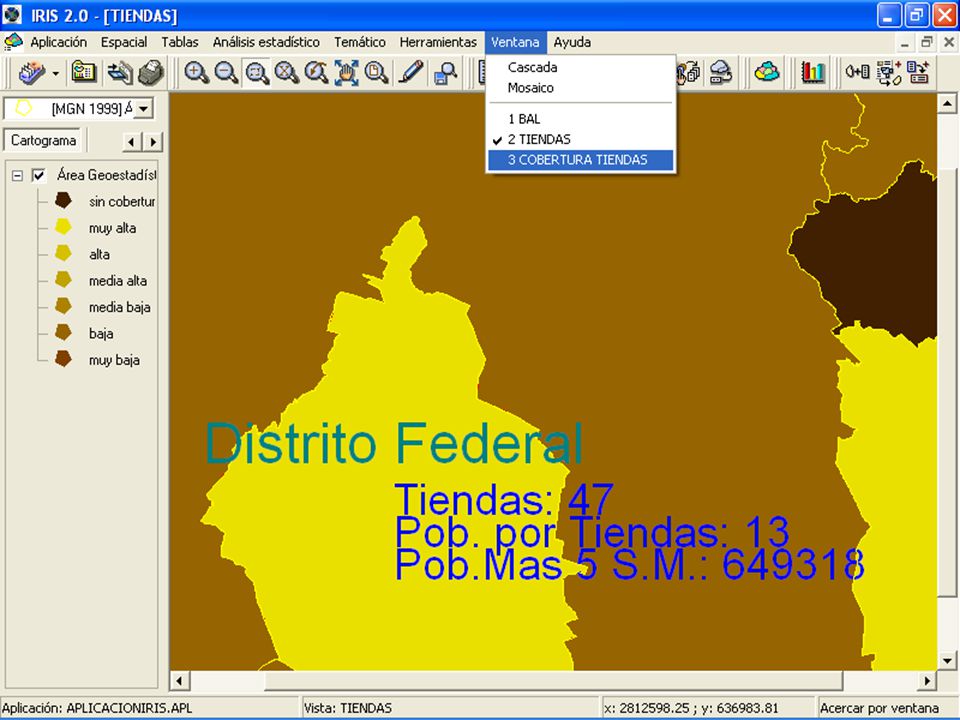
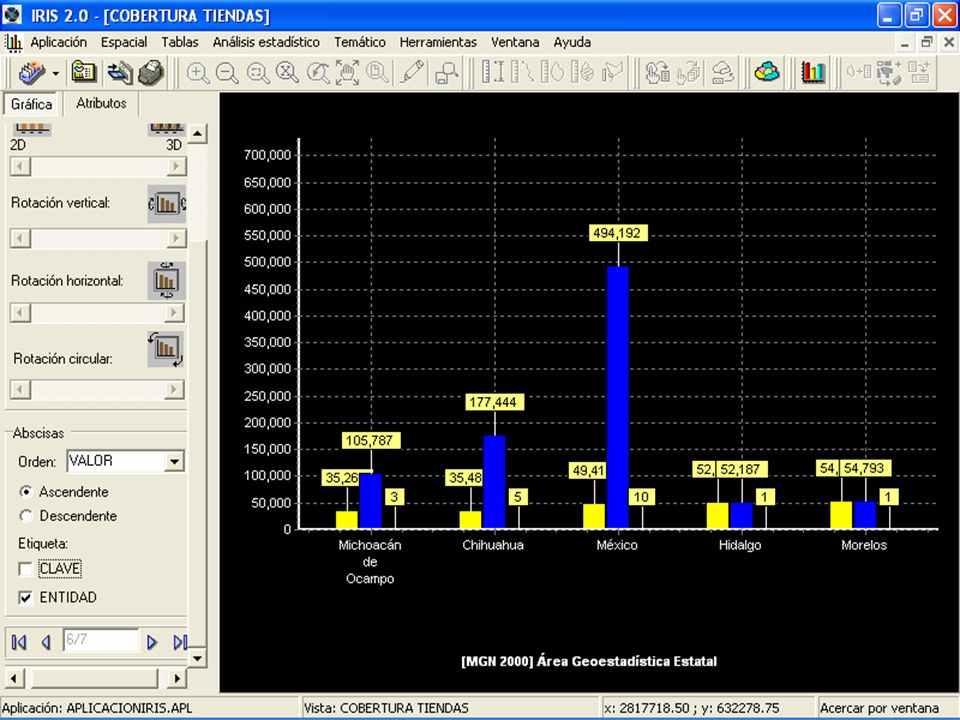
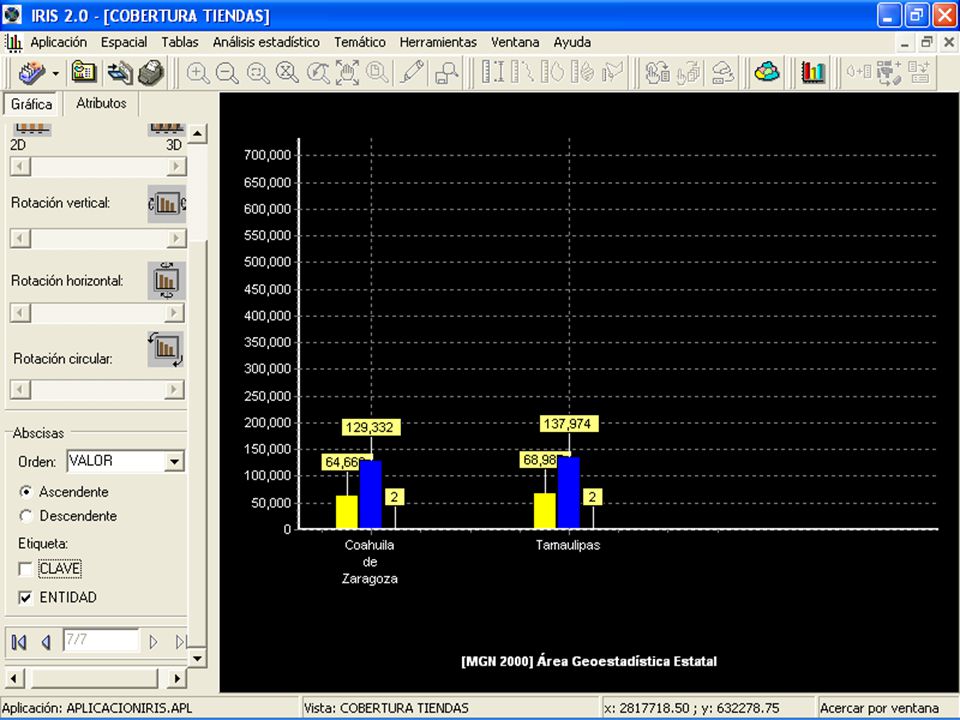
Población con ingreso mayor a 5 Salarios Mínimos Número de Tiendas Departamentales de Primer Nivel Población por Tienda = Cartograma Tiendas () / 1000 Distrito Federal 649,318 47 / 1000 = 13.81 =
 / 1000 Distrito Federal 649, / 1000 = =")
134
SEGUROS

142
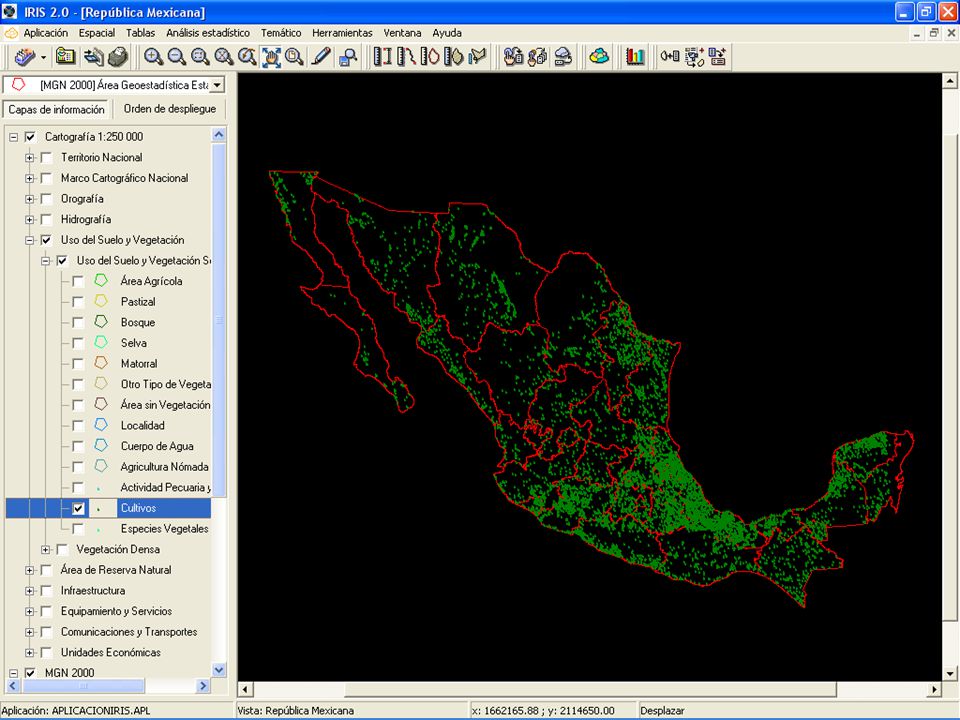
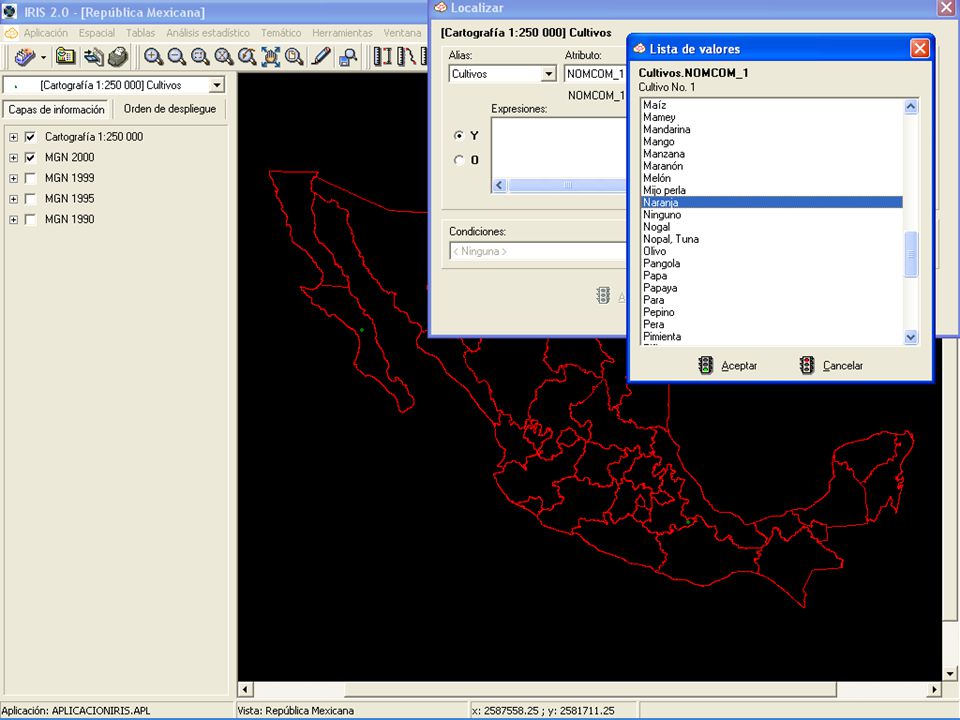
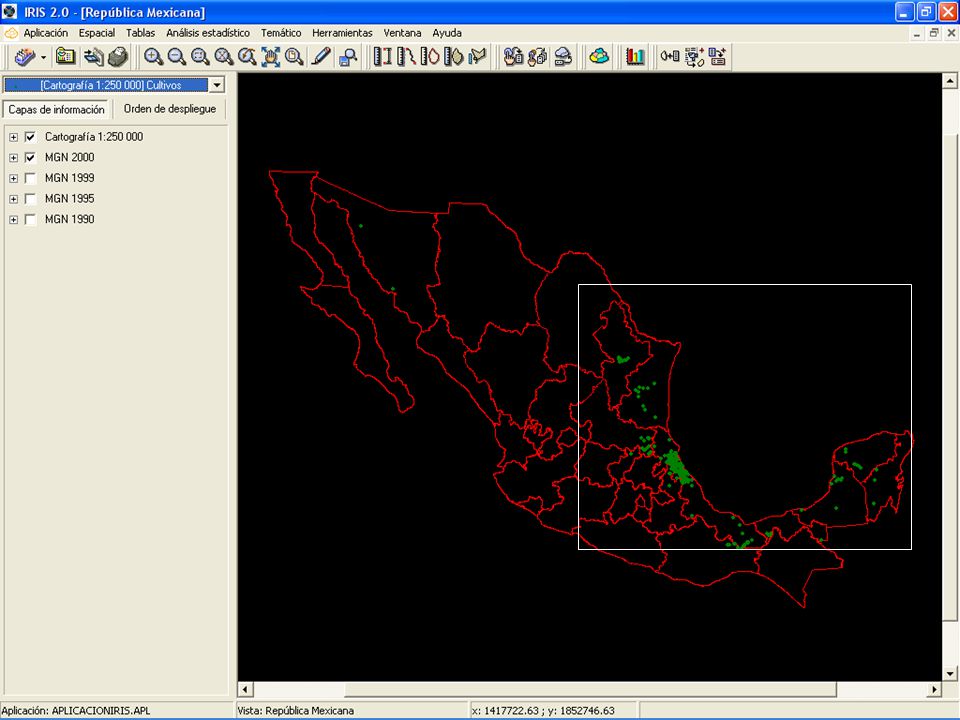
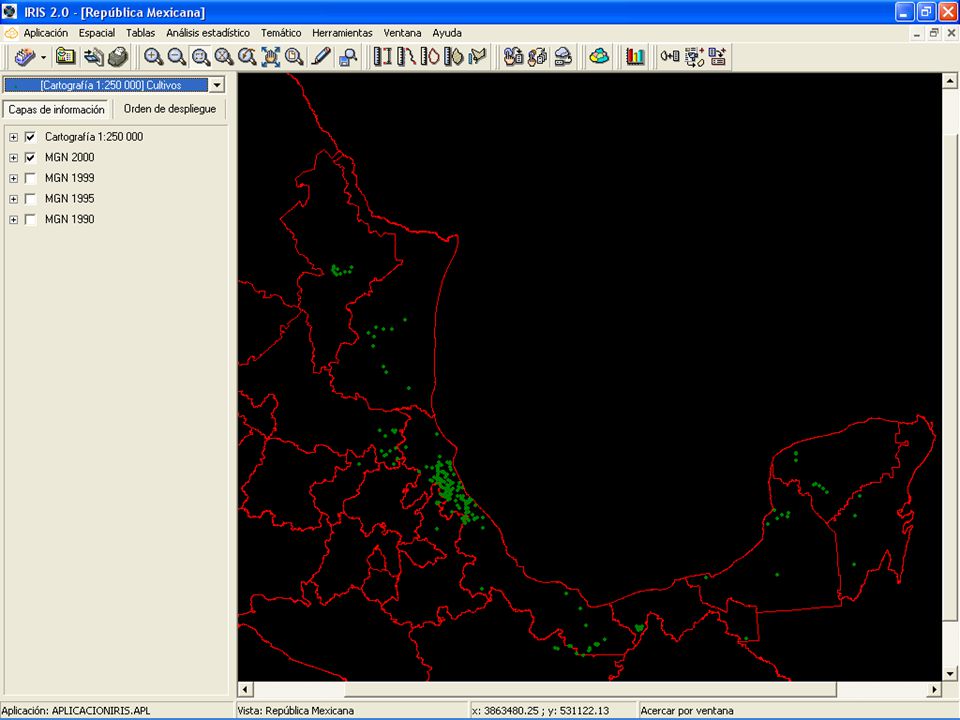
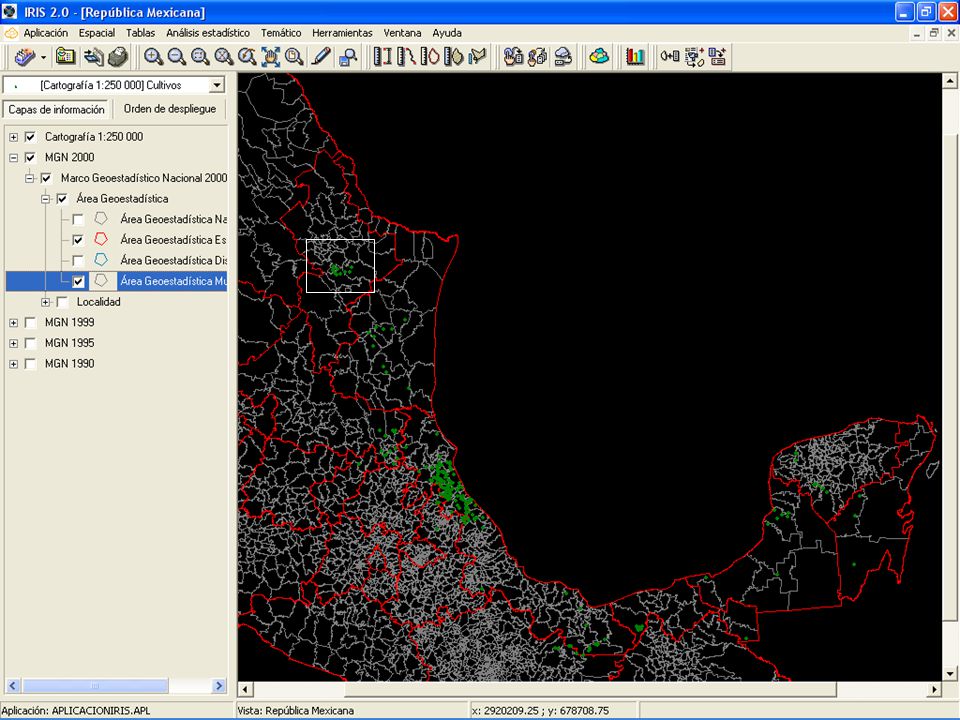
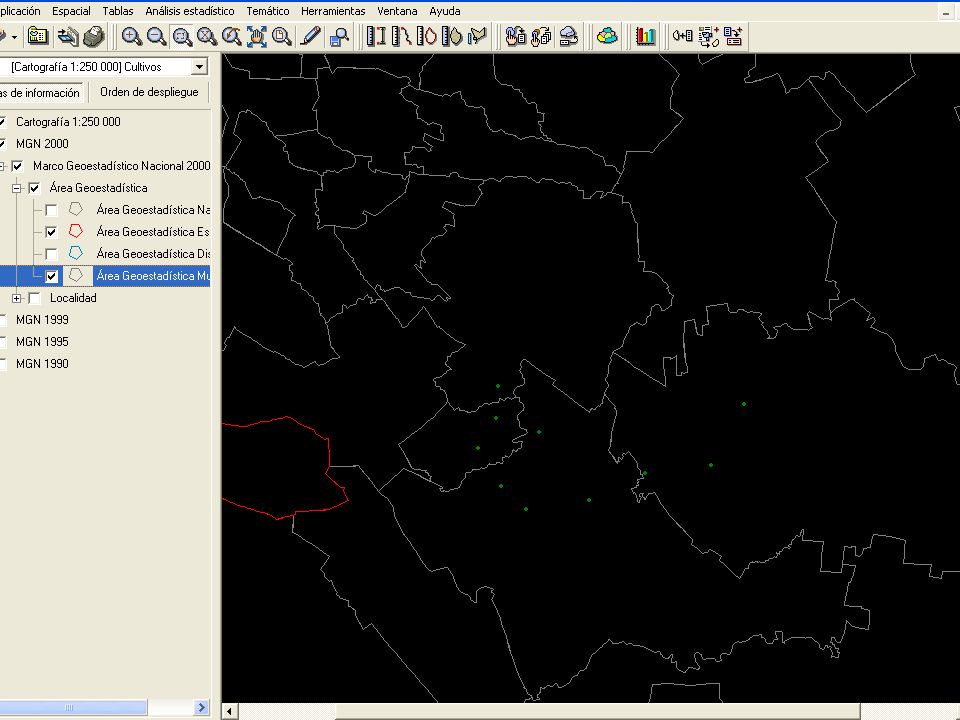
CULTIVOS

Presentaciones similares


 8.6% (2T-2014)>")


