Descargar la presentación
La descarga está en progreso. Por favor, espere

1
PCR Kinetics and qPCR by Jean-Pierre Herveg, Bernard Lethé and a lot of friends at the Brussels Branch of the Ludwig Institute for Cancer research (Licr) and the Christian de Duve* Institute for cellular Patholgy (ICP). April 2006 Université Catholique de Louvain Avenue E. Mounier, 1200 Brussels (Belgium)
.")
2
questions 1. Is the primer annealing temperaure something theoretical or something experimental ? 2. What are the qualities of a good primer ? 3. Whats a amplicon ? 4. Why does PCR show a plateau ? 5. Why isnt it possible to make ordinary PCR quantitative ? 6. How do you prepare controls for qPCR ? 7. Whats the Taqman reaction ?

3
LOCUS EDISSSURR 1949 bp DNA linear INV 01-MAR-1996 DEFINITION E.dispar gene for small subunit ribosomal RNA. ACCESSION Z49256 http://www.ncbi.nlm.nih.gov/entrez/query.fcgi 1 tatctggttg atcctgccag tattatatgc tgatgttaga gattaagcca tgcatgtgta 61 agtataaaga ccaagtagga tgaaactgcg gacggctcat tataacagta atagtttctt 121 tggttagtaa agtacaagga tagctttgtg aatgataaag ataatacttg agacgatcca 181 atttgtatta gtacaaagtg gccaatttat gtaagtaaat tgagaaatga cattctaagt 241 gagttaggat gccacgacaa 5tatctggttgatcctgccagtattatatgctgatgttagagattaagccatgcatgtgtaagtataaagaccaagtaggatgaaactgcggacggctcattataacagtaatag tttctttggttagtaaagtacaaggatagctttgtgaatgataaagataatacttgagacgatccaatttgtattagtacaaagtggccaatttatgtaagtaaattgagaaatgac attctaagtgagttaggatgccacgacaa 3 5ttgtcgtggcatcctaactcacttagaatgtcatttctcaatttacttacataaattggccactttgtactaatacaaattggatcgt Ctcaagtattatctttatcattcacaaagctatccttgtactttactaaccaaagaaactattactgttataatgagccgtccgcagttc atcctacttggtctttatacttacacatgcatggcttaatctctaacatcagcatataatactggcaggatcaaccagata 3

4
Primers (cebadores) Template ( plantilla) 3 3 3 3 Right primer (sens) Left primer (antisens)
 Template ( plantilla) Right primer (sens) Left primer (antisens)")
5
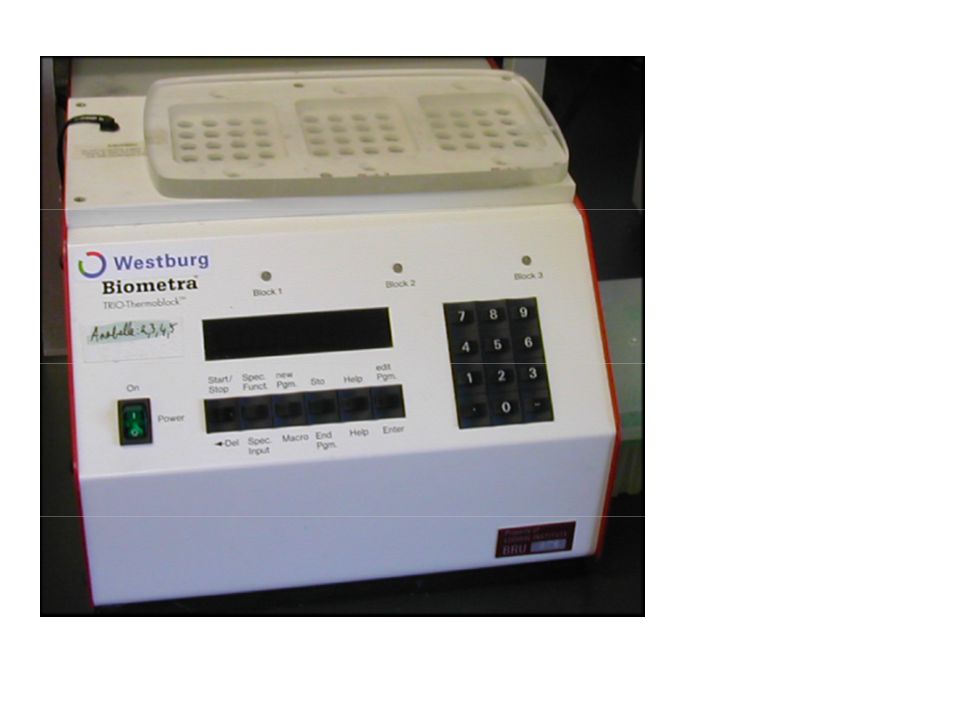
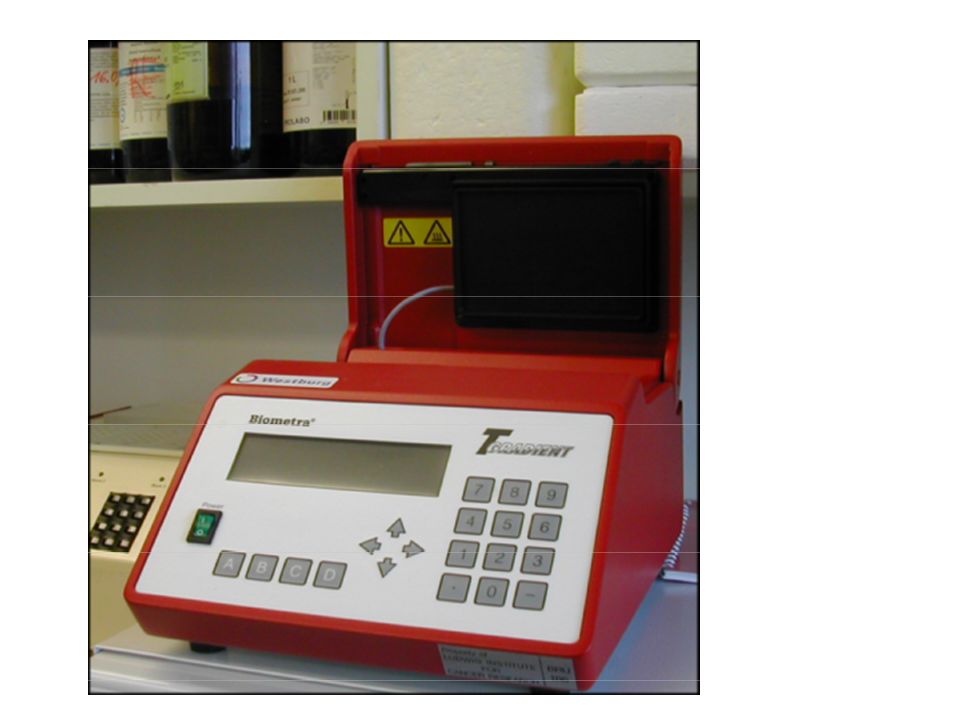
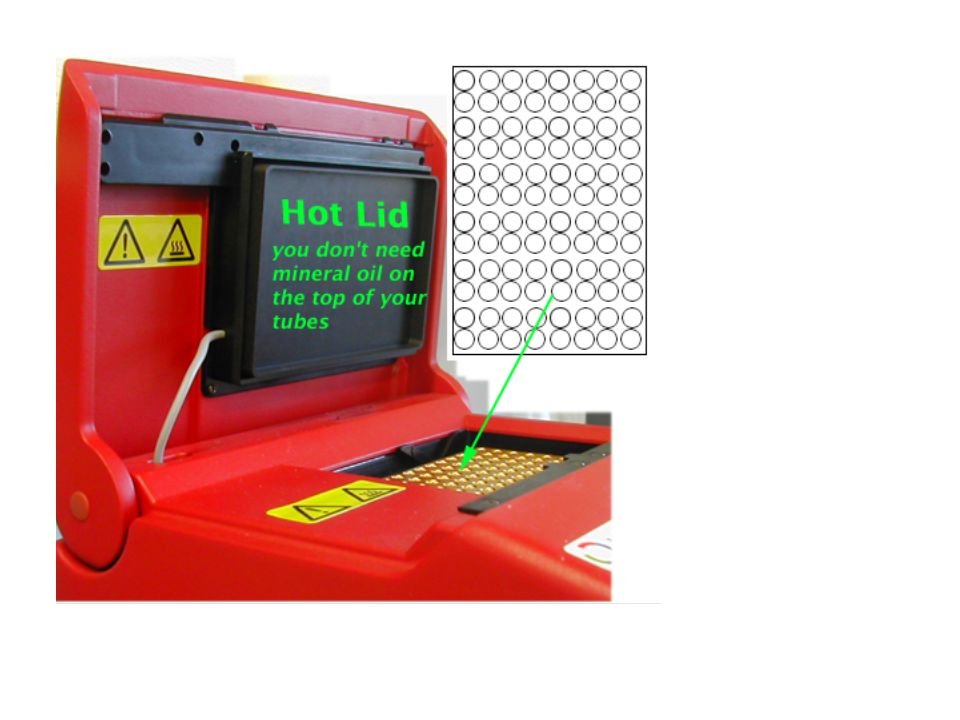
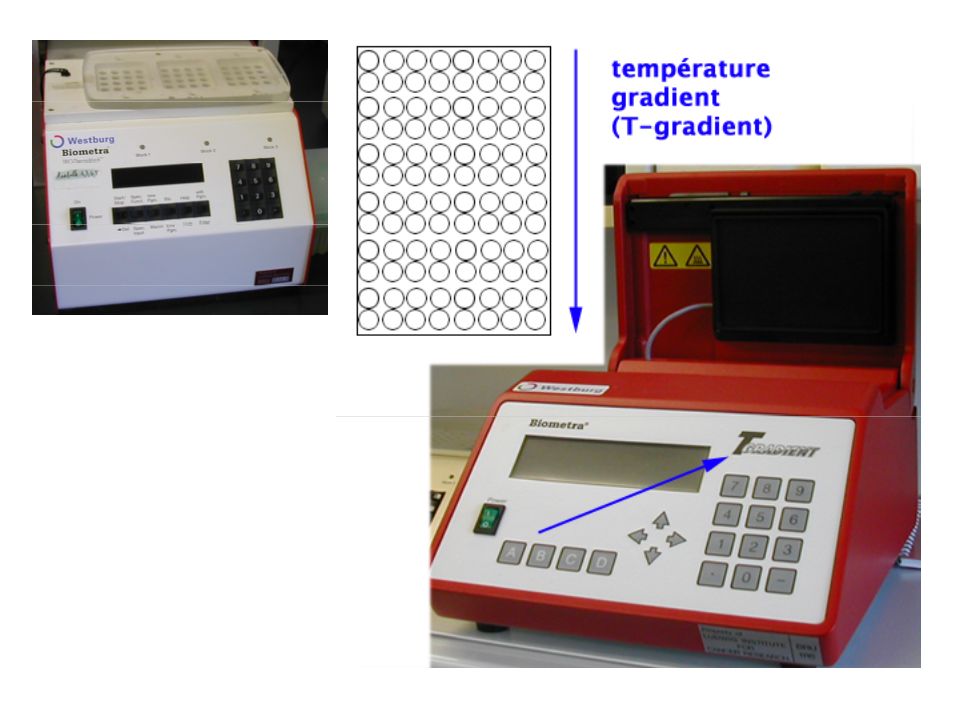
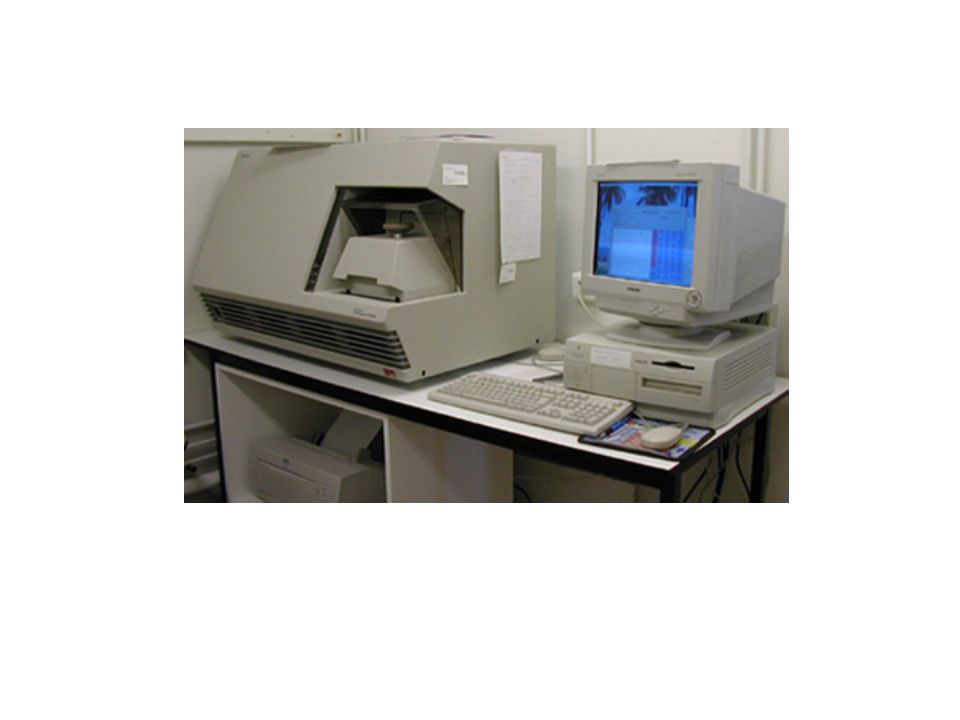
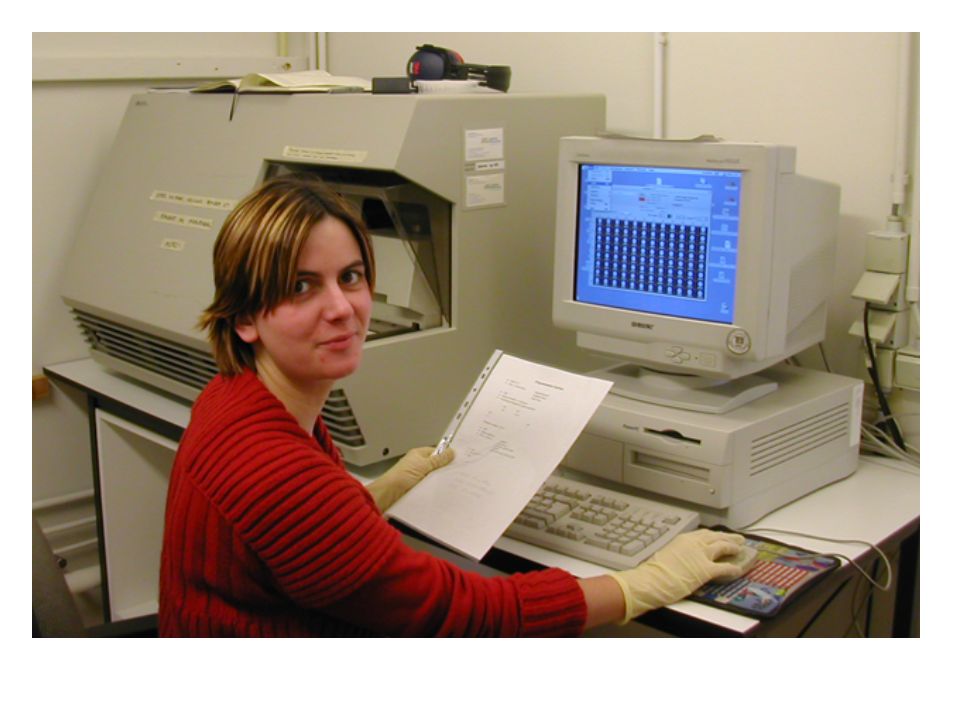
thermocyclers --------------------------- thermocycler: termociclador pmineral oil: aceite mineral.

9
a PCR reaction For one tube: Taq DNA pol1 µl buffer 10 x5 µl dNTPs 10mM1 µl Primer sens1 µl Primer antisens1 µl DNAX µl H2OY µl Total 50 µl X + Y = 41 µl A hot start is

11
( Las etapas de la reacción) La reacción en cadena de la polimerasa se desarrolla en cuatro pasos Each steps is characteriezd by a duration and a temperature 1. DNA fusion (la fusión de ADN): 2. Primer annealing (hibridación de los cebadores). 3. Primer extension (extensión de cebadores). 4. Successive cycles (los ciclos sucesivos) STEP 1: DNA fusion: duration time (usually, 0.5 min) and temperature 94°C time should be long enough to reach the desired temperature with your thermocycler. The time is different from thermocycler to thermocycler. temperature should be high enough to separate the 2 strands, but low enough to protect the enzyme. Remember that Taq DNA pol has a half life of about 1 hour at 94° C. DNA fusion produces 2 templates. 94° is a good choice. Steps1
: 2. Primer annealing (hibridación de los cebadores). 3. Primer extension (extensión de cebadores). 4. Successive cycles (los ciclos sucesivos) STEP 1: DNA fusion: duration time (usually, 0.5 min) and temperature 94°C time should be long enough to reach the desired temperature with your thermocycler. The time is different from thermocycler to thermocycler. temperature should be high enough to separate the 2 strands, but low enough to protect the enzyme. Remember that Taq DNA pol has a half life of about 1 hour at 94° C. DNA fusion produces 2 templates. 94° is a good choice. Steps1.")
12
STEP 2: primer annealing: duration time (0.5-1.0 min), temperature should be measured. time: when the DNA is rich in a and t (Plasmodium or Entamoeba, where (a+t) is as high as 78 %), the time could be longer than 1.0 minute. The right temperature is measured experimentally by comparing the results obtained at several temperatures. The right temperature is the one that gives the best result (never a theoretical temperature). The starting temperature is given by an abacus like the one below or by a formula. Example:if the abacus gives 57°, try at 60°, 63°, 66°… Step 2
 is as high as 78 %), the time could be longer than 1.0 minute. The right temperature is measured experimentally by comparing the results obtained at several temperatures. The right temperature is the one that gives the best result (never a theoretical temperature). The starting temperature is given by an abacus like the one below or by a formula. Example:if the abacus gives 57°, try at 60°, 63°, 66°… Step 2.")
15
3 3 Step 3 The last step produces the complementary strand using the Taq DNA pol. Taq DNA pol are isolated from Thermus aquaticus, a bnacterium living in geyser. Other thermoresistant polymerases are isolated from other prokaryotes and especially from Archaea. Taq DNA pol adds ± 1000 nt per minute to a primer. El último paso consiste en la genración de la cadena de ADN complementaria por acción de la ADN polimerasa Taq. Las ADN polimerasas Taq han sido aisladas de procariotas que viven en aguas termales, cuyas polimerasas son capáces de trabajar a temperaturas superiores a los 70°C. De esta manera sólo hay que añadir la enzima al inicio del proceso de la reacción. Por costumbre, decidimos que ADN pol coloca 1000 nucléotidos por minuto. No sabemos cómo el número de cyles actúa sobre la enzima.

16
Number of cycles If the reagents are in excess, the amount of DNA doube at each cycle: 1, 2, 4, 8,16, 32, 64, 128, 256, 512, 1024, 2048, 4096, 8192, 16384, 32768, 65536, 131072, 262144, 524288 (20), 1.048.576, 2097152, 4194304, 8388608, 16777216 (25), 33554432, 67108864, 134217728, 268435456, 536870912 (30), 1.073.741.824, 2147483648, 4294967296, 8589934592, 17179869184, After 30 cyles with a 100 % efficiency ( after N cycles we shall have 2 N times as much). with 1, 2, 4, 8, 16 molecule at the beginning, we end up with: 536.870.912, 1.073.741.824, 2.147.483.648, 4.294.967.296, 8.589.934.592, 17.179.869.184 molecules If we start with One molecule, after 31 cycles, we end up with 1.073.741.824 molécules 1.073.741.824 molecules in 100 microliters 10.737.418.240.000 molécules par litre ± 1. 10 13 molécules par litre. La solution est donc ±1.10 13 /0.6.10 24 soit ± 1,6.10 -10 molaire

17
analysis

18
Each primer of one pair should harbor the following qualities: 1.contains at least 17 nt. 2. have a G or a C at the 3' end 3. Have a Tm higher than 55° C 4. Be homogeneous,i.e. have the same number of A and T in each moeities. 5. they should not form homodimers (you should use a software to verify). 6. they should not be part of a repetitive sequence of the organism the following qualities Both primers of one pairs should haved the following qualities: 2. they should not form heterodimers 3. their individual Tm should be very high and very close
. 6. they should not be part of a repetitive sequence of the organism the following qualities Both primers of one pairs should haved the following qualities: 2. they should not form heterodimers 3. their individual Tm should be very high and very close.")
19
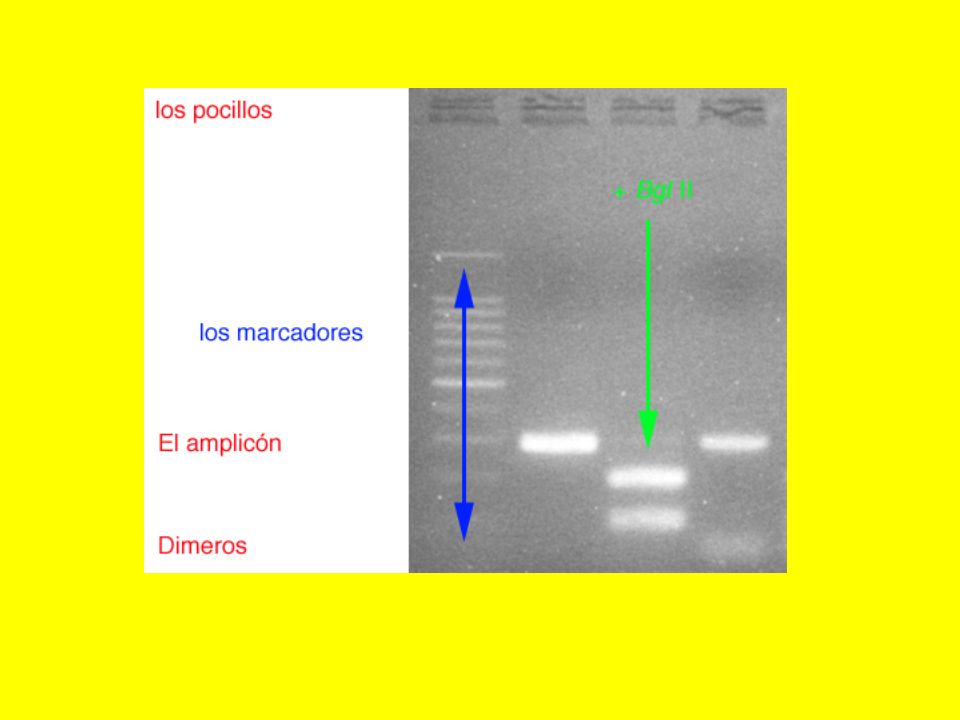
exercise the amplicon In the programm Amplify 3X, we paste the sequence we want to amplify as test target sequence. The fragment which will be amplified start at the 5 end of both primers, here, from the firts blue Nucleotides, to the last blue one. In blue are the sequences that would be recognized by our primers. In green we recognize a palindrome. el amplicón colocamos en Amplify 3X, la secuencia que deseamos ampliar (test target sequence). El fragmento ampliado entre las extremidades 5 ' de los cebadores es llamado "un amplicón". Los cebadores son indicados en azul. En verde, reconocemos una sitio de la enzima de restricción Bgl I Amplify 3X: http://jullien.n.free.fr/article.php3?id_article=10
. El fragmento ampliado entre las extremidades 5 de los cebadores es llamado un amplicón . Los cebadores son indicados en azul. En verde, reconocemos una sitio de la enzima de restricción Bgl I Amplify 3X: id_article=10.")
20
Primers: 5' ggaaagacgatcagataccgtc 3 ends with a C Both halves ggaaagacgat and cagataccgtc have the same number of A or T this primer is homogenous. 5' catccttctactgttcggtc 3 ends with a C both halves catccttcta and ctgttcggtc have a different number of A and T (6 and 4) this primer is not homogenous. los cebadores: 5' ggaaagacgatcagataccgtc 3 el primero cebador se acaba por C en 3 '. Las dos mitades contienen el mismo número de A o T: este cebador es homogéneo. 5' catccttcta ctgttcggtc 3 el segundo cebador se acaba por C en 3 '. Una de las mitades contiene 6 A o T, el otro 4: este cebador es es no homogéneo.
 this primer is not homogenous. los cebadores: 5 ggaaagacgatcagataccgtc 3 el primero cebador se acaba por C en 3 . Las dos mitades contienen el mismo número de A o T: este cebador es homogéneo. 5 catccttcta ctgttcggtc 3 el segundo cebador se acaba por C en 3 . Una de las mitades contiene 6 A o T, el otro 4: este cebador es es no homogéneo..")
21
PCR "in silico In silico means theoretical. With this pair of primer, the amplicon has A length of 289 bp. Everything is done by the computer. Esto es la PCR in silico (in silico significa teórico). Vemos que el amplicón tiene una longitud de 289 bp. El programa del computador efectúa la PCR
. Vemos que el amplicón tiene una longitud de 289 bp. El programa del computador efectúa la PCR.")
22
Dimers: Here is an example of homodimers first primer Dimeros: Tenemos aquí un ejemplo de dimero obtenido a partir del primero cebador (homodimer).
.")
24
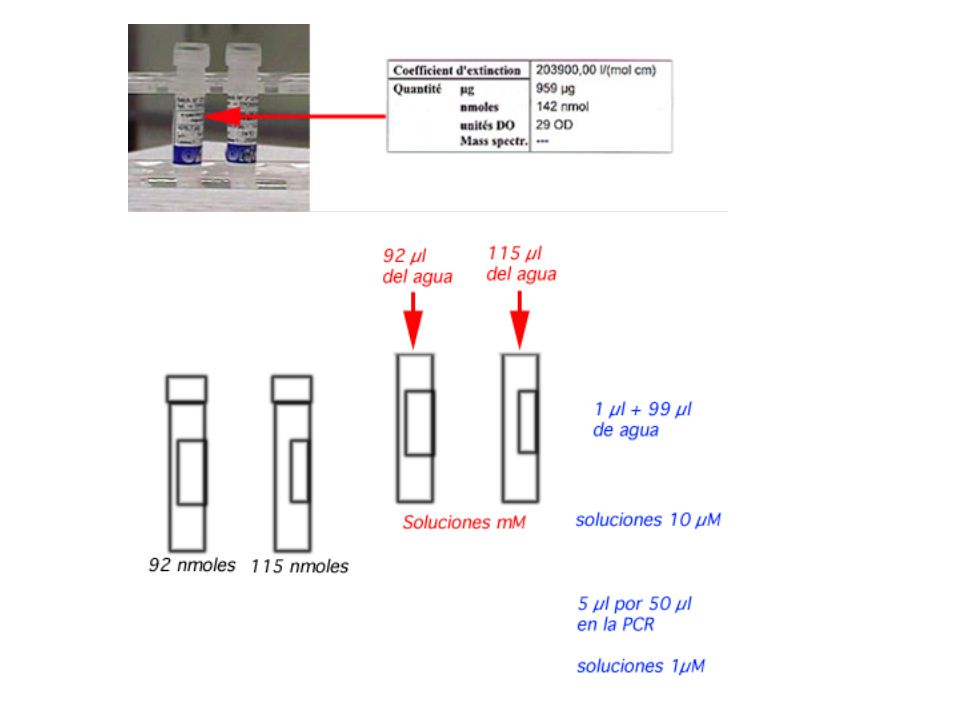
Dilution of the primers

27
Primer synthesis The last (3) nucleotide of the primer is attached to small glass balls. These balls are poured in a capillary tube. This tube is inserted in the robot. La síntesis de los cebadores Se comienza por fijar el último (3') nucleótido (numero n) de la secuencia a sintetizar usando bolas de vidrio microscópicas. Este será el primer nucleótido de la secuencia. Estas bolas se introducen en tubos capilares donde se desarrolla la reacción.
 nucleótido (numero n) de la secuencia a sintetizar usando bolas de vidrio microscópicas. Este será el primer nucleótido de la secuencia. Estas bolas se introducen en tubos capilares donde se desarrolla la reacción..")
28
El segundo nucleótido (x - 1] es añadido a la mezcla para comenzar el primer ciclo. En 3 ', este nucleótido posee un grupo O-P, del que el fosfato es protegido por dos radicales. El grupo 5'-OH del premier nucleótido [x] reacciona con el fosfato substituido del segund [x - 1]. El fosfito trivalente que se produce es oxidado en fosfato más estable que unirá los dos nucleótidos.
![El segundo nucleótido (x - 1] es añadido a la mezcla para comenzar el primer ciclo.](http://images.slideplayer.es/2/311205/slides/slide_28.jpg "En 3 , este nucleótido posee un grupo O-P, del que el fosfato es protegido por dos radicales. El grupo 5 -OH del premier nucleótido [x] reacciona con el fosfato substituido del segund [x - 1]. El fosfito trivalente que se produce es oxidado en fosfato más estable que unirá los dos nucleótidos..")
29
Al final, el grupo dimetoxiritilo (DMT) que protégé al hidroxilo 5' del segundo nucleótido (x - 1) es eliminado. Es al fin del primer ciclo que el [x - 2] nucleótido se añade.

30
cinetics

31
If we start with one molecule and a 100 % efficiency (2 n where n is the number of cycles): We should get the following amplification (in red) 1, 2, 4, 8,16, 32, 64, 128, 256, 512, 1024, 2048, 4096, 8192, 16384, 32768, 65536, 131072, 262144, 524288,1.048.576, 2097152, 4194304, 8388608, 16777216 (25), 33554432, 67108864, 134217728, 268435456, 536870912 (30), 1.073.741.824, 2.147.483.648, 4.294.967.296, Instead, we got only the following amplification (in blue) 1, 2, 4, 8,16, 32, 64, 128, 256, 512, 1024, 2048, 4096, 8192, 16384, 32768, 65536, 131072, 262144, 524288,1.048.576, 2097152, 4194304, 8388608, 16777216 (25), 33554432, 67108864, 134217728, 268435456, 536870912 (30), 1.073.741.824, 1.400.000.000, 1.450.000.000,etc. why a plateau

32
Why a plateau: The reason could be different in each case and trying to Find the real cause is not useful the causes could be: 1. An inactivation of the DNA pol. When you buy a DNA pol, its half life at 94° is often mentionned on an accompanying notice. Some people think that the best DNA pol could become tired. 2. A decrease in concentration of either the primers of the dNTPs. 3.The inhibitory effect of the reaction product..

33
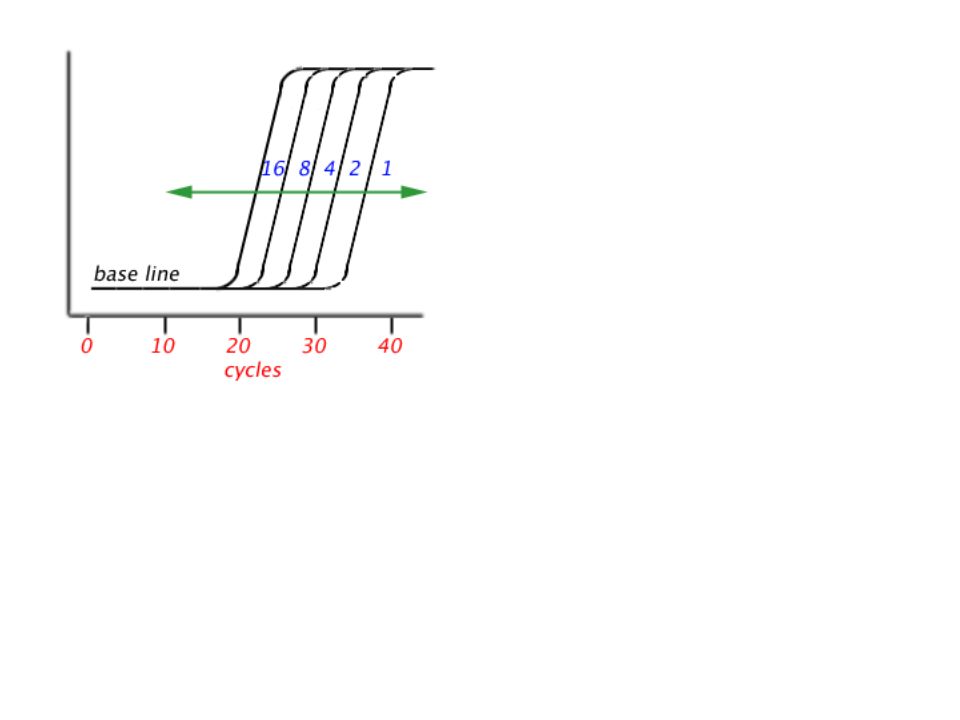
why a baseline The new molecules cannot be visualized because their concentration is Too small.

34
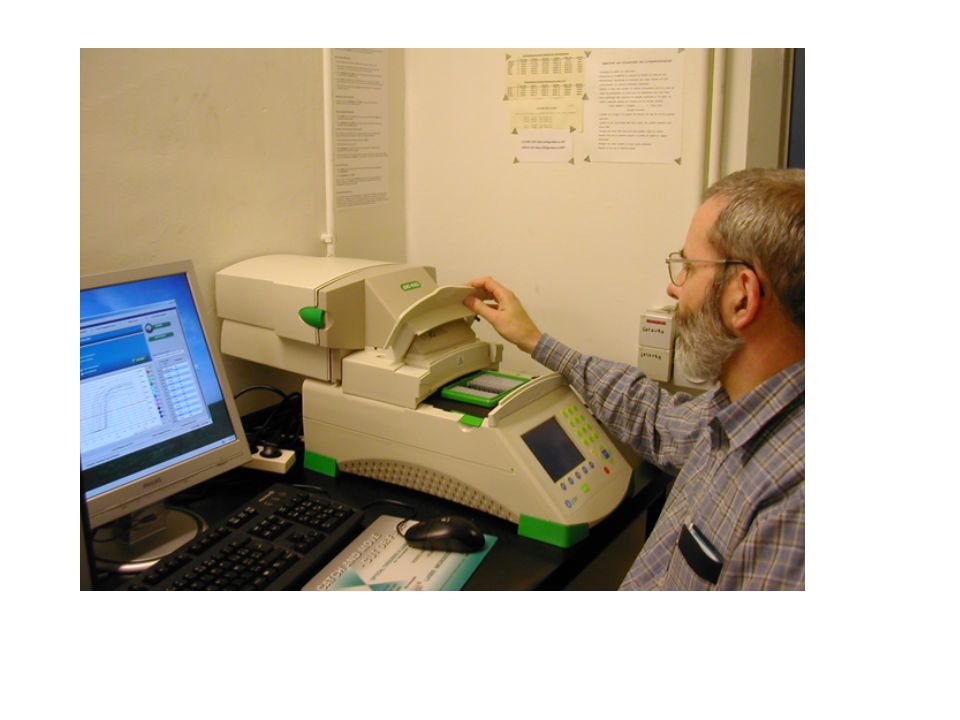
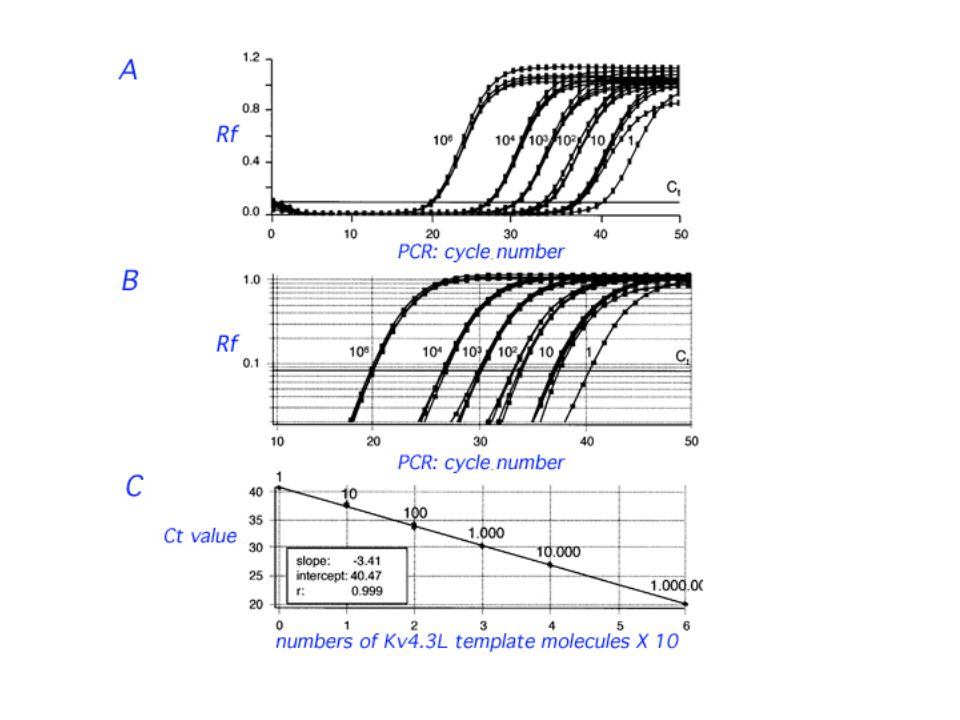
real time and q PCR End point PCR and qPCR Real-Time qPCR relies upon the detection and quantitation of a fluorescent reporter. The signal of this reporter increases in direct proportion to the amount of PCR product in a reaction. Real-Time qPCR monitors the fluorescence emitted during the reaction as an indicator of amplicon production during each PCR cycle (i.e., in real time) as opposed to the endpoint detection by conventional quantitative PCR methods. fluorescent reporter: SYBR Green I The less expensive fluorescent reporter is the SYBR Green I, which emits fluorescent light when intercalated into double-stranded DNA. Because intercalating dyes such as SYBR Green I do not make a distinction between the different dsDNA molecules in a PCR reaction, the formation of non-specific amplicons must be prevented (among them are dimers). Therefore, accurate primer design and optimization of the reaction conditions for the primers are required. After the PCR reaction, an additional time-temperature program provides a melting curve to detect the presence of high amounts of non-specific sequences. These non-specific sequences show melting peaks different to the template sequences. Performing a melt curve analysis provides a simple control for non-specific sequences detection providing reliable results with the use of intercalating dyes.
 as opposed to the endpoint detection by conventional quantitative PCR methods. fluorescent reporter: SYBR Green I The less expensive fluorescent reporter is the SYBR Green I, which emits fluorescent light when intercalated into double-stranded DNA. Because intercalating dyes such as SYBR Green I do not make a distinction between the different dsDNA molecules in a PCR reaction, the formation of non-specific amplicons must be prevented (among them are dimers). Therefore, accurate primer design and optimization of the reaction conditions for the primers are required. After the PCR reaction, an additional time-temperature program provides a melting curve to detect the presence of high amounts of non-specific sequences. These non-specific sequences show melting peaks different to the template sequences. Performing a melt curve analysis provides a simple control for non-specific sequences detection providing reliable results with the use of intercalating dyes..")
39
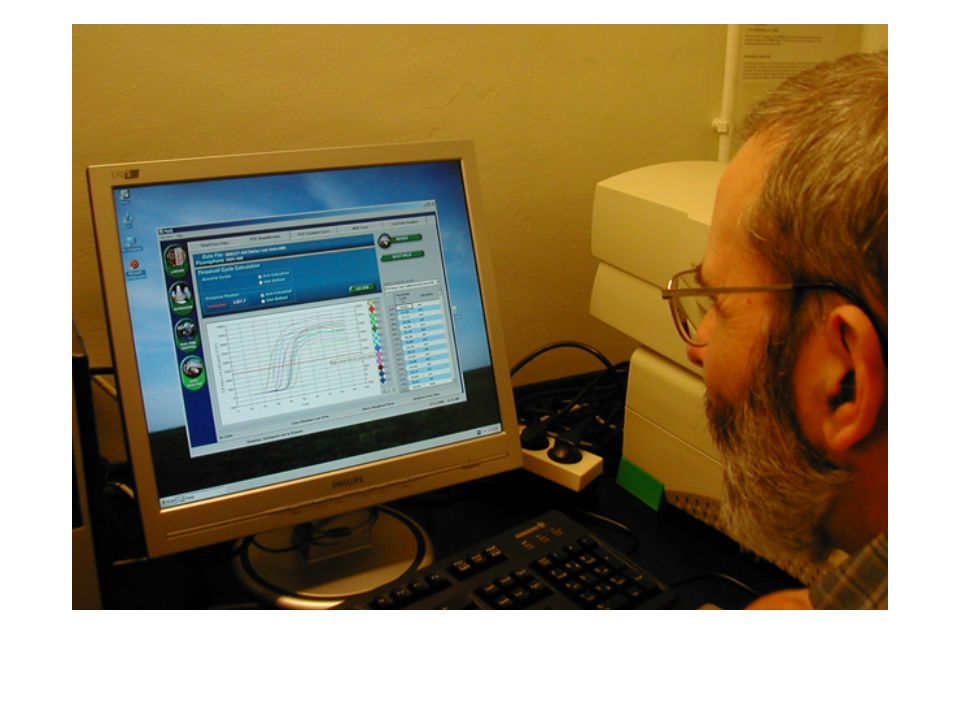
mispriming or primer dimers The real-time machines not only monitor DNA synthesis during the PCR, They also determine the melting point of the product at the end of the amplification reactions. The melting temperature of a DNA double helix depends on its base composition and of its length. All PCR products for a particular primer pair should have the same melting temperature Since SYBR green does not distinguish between one DNA and another, an important means of quality control is to check that all samples have a similar melting temperature. After real time PCR amplification, the machine can be programmed to do a melt curve, in which the temperature is raised by a fraction of a degree and the change in fluorescence is measured. At the melting point, the two strands of DNA will separate and the fluorescence rapidly decreases. The software plots the rate of change of the relative fluorescence units (RFU) with time (T) (-d(RFU)/dT) on the Y-axis versus the temperature on the X-axis, and this will peak at the melting temperature (Tm).
 with time (T) (-d(RFU)/dT) on the Y-axis versus the temperature on the X-axis, and this will peak at the melting temperature (Tm)..")
40
In this melting curve, all samples were run with the same primer pair, but the sample which contained no DNA (the red line) shows a melting curve with a lower Tm Than that of the other samples; this is probably due to a primer-dimer artifact.
 shows a melting curve with a lower Tm Than that of the other samples; this is probably due to a primer-dimer artifact.")
41
a control Theoretically: Suppose that at the plateau you get 1.000.000.000 molecules (10 9 ) One mole contains 6,02 x 10 23 molecules Then, you get 10 9 / 6,02 x 10 23 molecules, i.e. 1.6 x10 -13 moles. I bp has a molecular weight of ± 632 If your amplicon has a length of 160 bp, it has a molecular weight of 101.120 (± 100.000 g) At the pleateau you should have 1,6 x 10 -8 g Suppose that they are In 100 µl, 1,6 x 10 -5 g/ml, 1,6 x 10 -2 mg/ml, 1,6 x 10 +1 µg/ml practically purify the content of one or several of your tube at the plateau. Measure the DNA concentration at 260 nm. Make dilution of this compound and use them as control.
 At the pleateau you should have 1,6 x g Suppose that they are In 100 µl, 1,6 x g/ml, 1,6 x mg/ml, 1,6 x µg/ml practically purify the content of one or several of your tube at the plateau. Measure the DNA concentration at 260 nm. Make dilution of this compound and use them as control..")
44
For 100% efficiency, the amount of DNA doubles at each cycle, for 90% the amount of DNA will increase from 1 to 1.9 at each cycle, the factor is then 1.9. For 80% and 70% it will be 1.8 and 1.7. 100% efficiency : 1, 2, 4, 8,16, 32, 64, 128, 256, 512, 1024, 2048, 4096, 8192, 16384, 32768, 65536, 131072, 262144, 524288, 1.048.576 (20), 2097152, 4194304, 8388608, 16777216 (25), 33554432, 67108864, 134217728, 268435456, 536870912, 1.073.741.824 (30) 2.0 n 2, 4, 8, 16, 32, 64 ………. 1.073.741.824 (30) 1.9 n 1.9, 3.61, 6.86, 13.03, 24.76, 47.04 ………. 230.466.618 (30) 1.8 n 1.8, 3.24, 5,82, 10.49, 18.90, 34.01 ………. 45.517.150 (30) 1.7 n 1,7, 2.89, 4,93, 8.35, 14.19, 24.14 ………. 8.193.466 (30) different efficiencies
, , , , (25), , , , , , (30) 2.0 n 2, 4, 8, 16, 32, 64 ……… (30) 1.9 n 1.9, 3.61, 6.86, 13.03, 24.76, ……… (30) 1.8 n 1.8, 3.24, 5,82, 10.49, 18.90, ……… (30) 1.7 n 1,7, 2.89, 4,93, 8.35, 14.19, ……… (30) different efficiencies.")
45
Typically, in Real-Time qPCR, a standard curve is generated from a dilution series constructed from a "reference" sample. A serial dilution series of the reference sample is used to generate a standard curve. Real-Time qPCR is performed on both the experimental samples and reference sample. Relative values for target abundance in each experimental sample are then extrapolated from the standard curve generated from the reference sample.

46
TaqMan

Presentaciones similares

 European Transfer Credit System (ECTS) Methodology in.>")


.>")


. It features two verb changes that we will see very soon.>")


