Descargar la presentación
La descarga está en progreso. Por favor, espere

1
Centro Internacional de Agricultura Tropical
Análisis Espacial y Sistemas de Información Geográfica para establecer prioridades Regionales en la Investigación y Desarrollo Agropecuario Glenn Hyman Centro Internacional de Agricultura Tropical

2
OUTLINE Mapping, GIS and Spatial Analysis for Targeting
Political and Agroecological Units New Information for Targeting and Priority-setting Some directions for the Future

3
Mapping, GIS and Spatial Analysis for Targeting

4
Thematic Mapping of “Necesidades Basicas Insatisfechas”
at different scales in Honduras

5
Village-level mapping based on
multivariate statistical analysis in the Central Peruvian Amazon

6
Boolean Analysis Preliminary overlay of areas of high population density [shown in lavender, > 25 people/km2] and low rice yields [shown in yellow < 1.5 tons/ha ] Purple colors show areas meeting both conditions

7
Spatial Clustering Methods based on
village-level census data in Honduras

8
Fungicide Applications Model based on data
Source: Hijmans et al. 2000

9
Political and Agroecological Units
Most interventions are carried out in countries, departments, municipios, villages Biological, soil and climate processes occur in agroecological zones Priority setting exercises should analyze conditions according to both political and agroecological units Significant improvements can be made by using information at higher spatial resolution (e.g. TAC priority setting exercises)
")
10
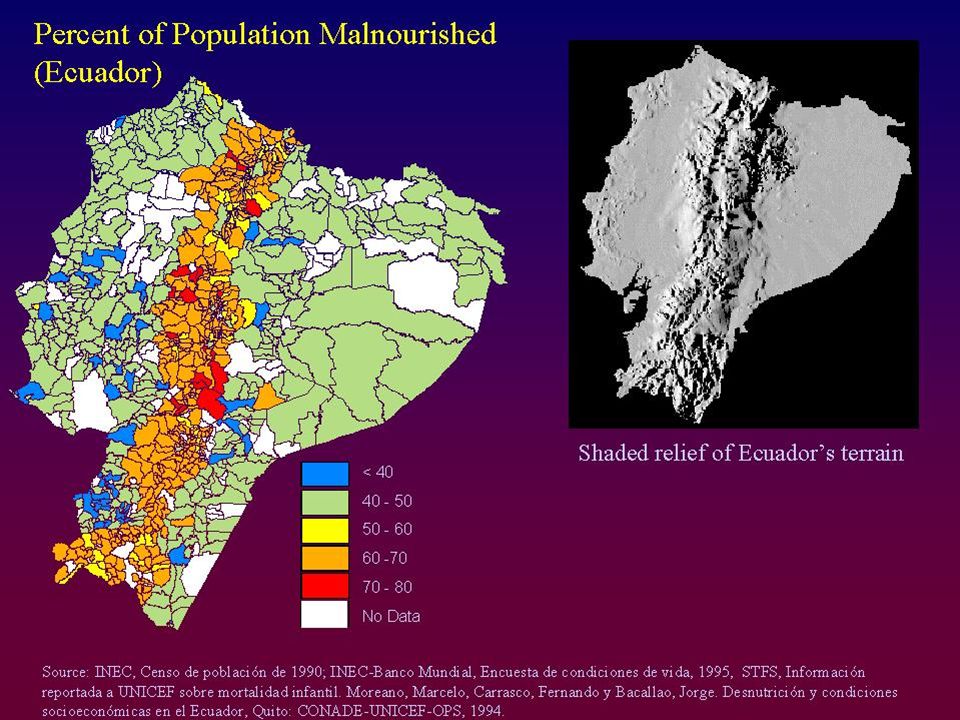
As a general principal, geographical targeting
Most interventions occur according to political units 10,400 units most are municipios Municipio (canton) level Parroquia level As a general principal, geographical targeting improves with greater spatial resolution (e.g. leakage)
 level. Parroquia level. As a general principal, geographical targeting. improves with greater spatial resolution (e.g. leakage)")
11
CIAT Agroecological Zones
from climate classificiation (cluster analysis method)
")
12
Source: Jeff White, CIMMYT
Classification based on length of growing season

13
Modifiable Areal Unit Problem Population from Census
Improving socioeconomic data for further analysis Modifiable Areal Unit Problem - estimation techniques improve spatial resolution Accessibility Model of Population

14
Sum of errors when modeled population is compared to
Modeled population counts compared to actual census data for Peru Modeled estimates reduced overall error by one half in Peru Sum of errors when modeled population is compared to actual census data PERU

15
Population and Vegetation Types in Honduras
- with better resolution maps, we can more easily estimate population in vegetation zones CCAD Vegetation Map

16
Potential Agricultural Productivity
Population summed by zones Note: Areas en black are cities. Zones in Purple are higher rural population densities. Zones in green are low rural population densities. Raster Population Surface (digital map)
")
17
Agricultural potential in calories/ha/yr From a spatial overlay, we can estimate the number of rural people living in different classes of agricultural potential.

18
Overlay of Land Degradation and Population Maps
Sources: GLASSOD, CIAT Population Data

20
New Information for Targeting and Priority-setting

21
Global Land Cover from 1 km AVHRR Source: USGS

22
Source: WRI, IFPRI

23
New Climate Data and Application Tools,
Including IWMI’s World Water Atlas and CIAT’s MarkSim Example:Weather Stations used in calibration set for Markov climatic models

24
Global Population Data Set
At 1 km spatial resolution Source: LandScan

25
Global Nighttime Lights Database From U. S
Global Nighttime Lights Database From U.S. National Geophysical Data Center

26
Collection Dates from Last Census Round
Year of Census La RESOLUCION TEMPORAL DE LA INFORMACION SEGUN PAIS ESTA MOSTRADO EN ESTE MAPA.

27
Most countries plan to conduct their next census within the next few years.

28
NATIONAL SPATIAL DATA INFRASTRUCTURES
GIS is moving to the Internet Survey for 21 countries Leadership + Participation Core Data Components Pricing Legal restrictions Challenges

29
Gateways to Geographic Information NSDI Clearinghouse Growth 1999
Source: United States Geological Survey 200 180 160 140 120 100 80 60 40 20 Jun-95 Jun-96 Feb-97 Dec-97 Sep-98 Mar-99 Jun-99 Sep-99 Nov-99 Intn'l Domestic Gateway Total

30
Source: United States Geological Survey

31
PROCIG http://www.procig.org 26 instituciones participantes
Instituto Nacional de Estadística y Censos Ministerio de Agricultura y Ganadería Ministerio de Ambiente y Energía Instituto Geográfico Nacional CATIE Dirección de Estadística y Censos Ministerio de Desarrollo Agropecuario Autoridad Nacional de Ambiente Instituto Nacional de Estadística Ministerio de Agricultura, Ganadería y Alimentación Comisión Nacional de Medio Ambiente CIAT Dirección General de Estadística y Censos Ministerio de Medio Ambiente y Recursos Naturales Viceministerio de Vivienda y Desarrollo Urbano Ministerio Agropecuario y Forestal Ministerio de Ambiente y Recursos Naturales INETER Secretaría de Agricultura y Ganadería Secretaría de Recursos Naturales y Ambiente

32
Some directions for the Future
Computational Geography Better data, and power to analyze it Combining Census and Survey Methods LSMS DHS Better Integration between the Social, Economic, Biological and Geographical

33
A relatively small investment in improved geographical targeting could yield large gains in poverty reduction

Presentaciones similares

 European Transfer Credit System (ECTS) Methodology in.>")


.>")


 Disasters History (hidrometereological and associated ones) Hazards Maps (flood plains, lanslides,>")


 and numbers are used to tell time. Copyright © 2008 Vista Higher Learning. All rights reserved.>")