Descargar la presentación
La descarga está en progreso. Por favor, espere

1
Mexico Clean Energy Strategy Luis Muñozcano Alvarez Director General Adjunto de Energías renovables LAC-CORE October 4th 2016

2
Where are we…2015. In 2015 clean power generation was 62,775 GWh,
Installed capacity was 19,265 MW (28.3%) 2 Fuente: SENER, Prospectiva de Energías Renovables
 2. Fuente: SENER, Prospectiva de Energías Renovables")
3
Renewable generation 2015

4
Potential

5
Evolution, main technologies

6
Advances 2015 & Goals 2018 (PEAER)
Challenge: Goal Advances 2015 & Goals 2018 (PEAER) 2015 2018 Capacity. RE 25.2 % 32.8% Generation RE 21.3 % 25.0 % Value Chain Integration (Bloomberg) (2.6 en 2012) 3.0 of 5 3.2 of 5 Permits (days) 620 465
 Capacity. RE % 32.8% Generation RE % 25.0 % Value Chain Integration (Bloomberg) (2.6 en 2012) 3.0 of of 5. Permits (days)")
7
Energy Reform Timeline

8
ETL: Business Oriented Energy Reform: Ley de Transición Energética
Sustainable use of energy Incremental use of clean energy Objectives Reduce emissions (GHG) Align with other laws (LIE, LGCC)
 Align with other laws (LIE, LGCC)")
9
New Instruments 1.- AZEL 2.- RE One Stop Window ENRELmx
Solar Hydro Wind Geothermal Biomass Average: 620 days TECNOLOGÍA DIAS MINIMO MÁXIMO MIN NUMERO DE TRAMITES MAX NUMERO DE TRAMITES HYDRO 270 545 11 18 WIND 9 20 SOLAR GEOTHERMAL 250 525 14 21 BIOMASS (FORESTRY) BIOMASS (WASTE) 211 486 7
 BIOMASS (WASTE)")
10
Moving to a low carbón economy
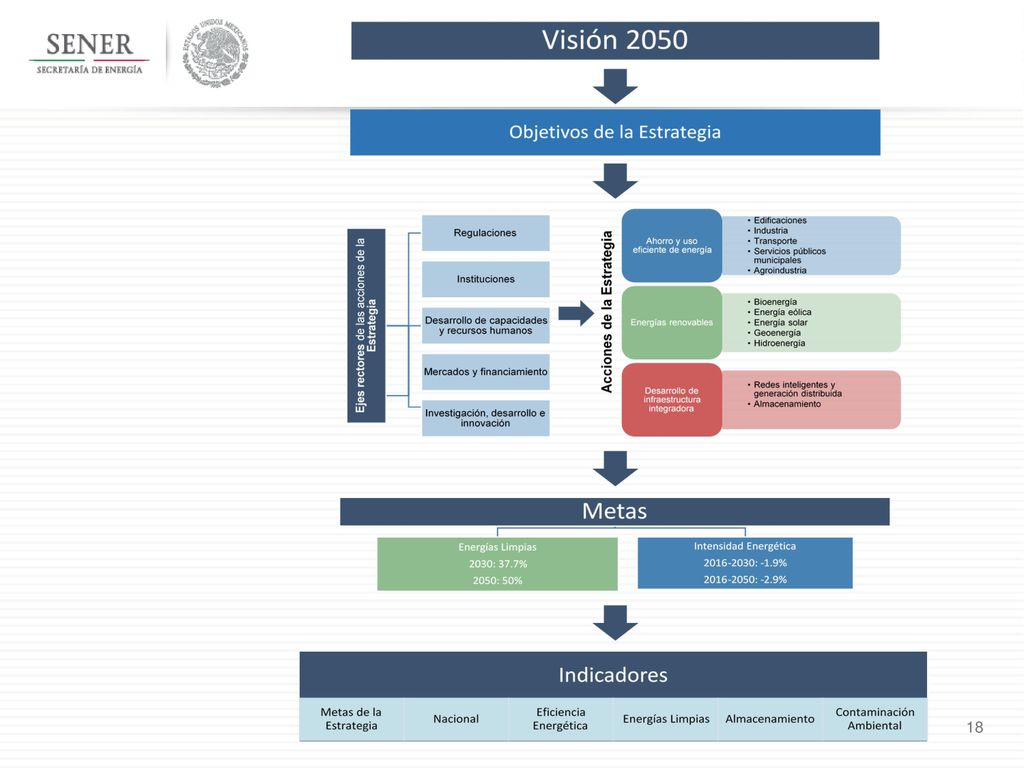
Transition Strategy Moving to a low carbón economy INTRODUCCIÓN MARCO JURÍDICO VISIÓN, OBJETIVOS Y METAS PANORAMA INTERNACIONAL DE LAS ENERGÍAS LIMPIAS Y EFICIENCIA ENERGÉTICA CONTEXTO NACIONAL DIAGNÓSTICO PROSPECTIVA Y METAS DE MEDIANO Y LARGO PLAZO POLÍTICAS Y LÍNEAS DE ACCIÓN HACIA LA TRANSICIÓN ENERGÉTICA MECANISMOS DE FINANCIAMIENTO INDICADORES DE SEGUIMIENTO DE LA TRANSICIÓN ENERGÉTICA CONCLUSIONES Y RECOMENDACIONES

11
Moving to a low carbón economy Clean energy generation 2015-2050
Transition Strategy Moving to a low carbón economy Prospective and goals Clean energy generation ETS Clean Energy Goals Conventional 37.7% 50.0% 2030 2050 Clean

12
Generation Technologies

13
EE Transition Annual average reduction intensity
Transition Strategy Moving to a low carbón economy Energy Consumption (PJ) EE Transition Annual average reduction intensity Base Scenario 42% 1.9% 3.7% transition Scenario 2.9% 42% reduction by Energy efficiency actions
 EE Transition Annual average reduction intensity. Base. Scenario. 42% 1.9% 3.7% transition. Scenario % 42% reduction by Energy efficiency actions")
14
Final Energy Consumption

15
Transport Sector

16
Energy demand (electricity) 2010-2050 (Petajoules)
Base Scenario Transition Scenario

17
Indicators

19
Gracias!! lmunozcano@energia.gob.mx

Presentaciones similares


 735 Brief Description:Breve Descripción del Proyecto: Project Name and Location : SunPeak Solar.>")


 763 Brief Description:Breve Descripción del Proyecto: Project Name and Location: ASTROSOL First.>")

