Descargar la presentación
La descarga está en progreso. Por favor, espere

1
Módulo 2 : Entendiendo el Mercado
Programa de Formación en Marketing Cono Sur Módulo 2 : Entendiendo el Mercado

2
Understand the Market Designed to Answer Principal Question:
Market Focus Designed to Answer Principal Question: How should we focus our marketing efforts in the Value-Adding Chains of our chosen industry/market segments in order to build competitive advantage for our business?

3
Agenda Día 1 Introduction/Objectives
Review of Key Understand the Market Concepts Team Review of Current VAC Map & Dynamics List key Business Strategy inputs Update VAC Diagram to reflect new inputs Verify Value Driver and power distribution ID current allocation of Marketing Effort Brainstorm: Ways to enhance DP influence on decisions Capture all ideas Prioritize top 5 Trends Analysis: Capture and Prioritize Trends affecting relevant VACs

4
Agenda Día 2 Competitive Analysis Review new info from each “expert”
Chart likely competitor moves to thwart Project success Prioritize by “Likelihood” & “Significance” Brainstorm DuPont responses to high-priority competitive moves Customer Analysis Create “Sources of Competitive Advantage” & “Unmet/Poorly met Needs” matrix (3-4 levels of VAC) Brainstorm potential DuPont Value-Add responses Mktg Effort Future State: ID ideal allocation of Mktg effort along VAC Decision: What is Targeted Level for Mktg Planning emphasis? Project Path Forward Exercise: Defining Next Steps Pre-Work for Segmentation Workshop Reflections
 Brainstorm potential DuPont Value-Add responses. Mktg Effort Future State: ID ideal allocation of Mktg effort along VAC. Decision: What is Targeted Level for Mktg Planning emphasis Project Path Forward Exercise: Defining Next Steps. Pre-Work for Segmentation Workshop. Reflections.")
5
Understand the Market Roadmap
Objectives for thisTraining Data Gathering Techniques for Latin America Review of Key VAC Concepts Refining Value Chain Process Maps Brainstorming Influence Strategies External Trend Analysis Competitor Analysis Customer Analysis VOC & Market Insights Path Forward Exercise Pre-Work for Marketing Competency Training Session #3: Segmentation, Targeting & Positioning

6
Objectives of Understanding the Market
In the context of the Business Direction: Fully understand the “players”, operation and dynamics of the relevant Value-Adding Chain(s) Assemble and analyze VOC, competitor and external trend data for insights into where and how to create competitive advantage by adding value Qualitatively and quantitatively identify business/market opportunities Decide where to focus Marketing & Sales efforts along the Value-Adding Chain
 Assemble and analyze VOC, competitor and external trend data for insights into where and how to create competitive advantage by adding value. Qualitatively and quantitatively identify business/market opportunities. Decide where to focus Marketing & Sales efforts along the Value-Adding Chain.")
7
Additional Objectives for this Session
Determine the work that must be done to complete Understand the Market for each Project and establish Path Forward for accomplishing that work Understand the Pre-work assignment for Session #3, Segmentation, Targeting and Positioning

8
Key questions to be answered:
Understand the Market Key questions to be answered: What are the dynamics in those Value Chains that may create opportunities we can address? Player roles, flow of materials and decisions, trends What do we know about customers that can guide our efforts to create greater value and influence them in favor of our offerings? What should we expect from our competitors? How can we benefit from anticipating their actions? How should we focus our marketing efforts in the Value-Adding Chains of our chosen industries in order to capture greater value for DuPont?

9
SIPOC - Understand the Market
Bus. Ldrs., Customers, Competitors, Channel Partners; Industry/Market. Associations, Literature & Experts VOC Data & Insights Business Strategy/Goals Prioritized CTQ’s(translated from VOC) Channel Partner Insights Industry/Market Data & Insights Customer Satisfaction Data Market Research Data Competitor Literature and Data Economic & Societal Insights Value Chain Analysis Customer Needs, Values & Critical Success Factors Competitors’ Strategic Thrusts, Capabilities & Limitations Key Trends which Must be Planned for Identification of Info. Gaps & a plan to address Rigorous foundation for Market and Sales Strategy Development Agreement as to where we will focus resources along VAC Marketing & Sales Teams, Business Leaders, other internal organizations Customers, Channel Partners Customer Analysis External Trend Analysis Competitor Analysis “Planning Focus” Decision
 Channel Partner Insights. Industry/Market Data & Insights. Customer Satisfaction Data. Market Research Data. Competitor Literature and Data. Economic & Societal Insights. Value Chain Analysis. Customer Needs, Values & Critical Success Factors. Competitors’ Strategic Thrusts, Capabilities & Limitations. Key Trends which Must be Planned for. Identification of Info. Gaps & a plan to address. Rigorous foundation for Market and Sales Strategy Development. Agreement as to where we will focus resources along VAC. Marketing & Sales Teams, Business Leaders, other internal organizations Customers, Channel Partners. Customer Analysis. External Trend Analysis. Competitor Analysis. Planning Focus Decision.")
10
Key Marketing Strategy Questions
Where will we compete? How will we compete? What will it take to win? These Questions must be addressed in the context of Business Strategy

11
Business Strategy Input
Business Definition / Purpose Overall Strategies(e.g. Brand Portfolio Strategy) Strategic Intent Key Issues Impacting the Business Resources Available Limitations or Constraints Industry Structure Analysis Current and Future Industry Attractiveness Chosen Product/Market Combinations Measurable Goals and Objectives Financial Performance and Expectations
 Strategic Intent. Key Issues Impacting the Business. Resources Available. Limitations or Constraints. Industry Structure Analysis. Current and Future Industry Attractiveness. Chosen Product/Market Combinations. Measurable Goals and Objectives. Financial Performance and Expectations.")
12
Some Indicators of the Need to Refresh Marketing Strategy
A key patent will soon expire, opening the field to competitors Market growth and/or market share are declining Mergers among your customers increase their power Significant change in competitor’s strategy or results Segmentation is “fuzzy”, not universally understood There’s no alignment on a clear-cut marketing strategy Price increases aren’t “sticking” or cause defection Environmental regulations threaten to make core products obsolete The market is saturated; few green field opportunities remain Price becomes king, and the market isn’t recognizing differentiation Business conditions demand improved competitive performance

13
Value Adding Chain Definition: A progress of steps from fundamental raw materials through goods purchased by end-use consumers

14
Value Adding Chain (VAC) Analysis
A critical step in Strategic Marketing: Guides planning, segmentation, allocation of resources, activity Potential competitive advantage from understanding the VAC better than competition!

15
Understand the Market Roadmap
Objectives for this Training Review of Key VAC Concepts Refining Value Chain Process Maps Brainstorming Influence Strategies External Trend Analysis Competitor Analysis Customer Analysis VOC & Market Insights; Data Gathering Techniques for South America Path Forward Exercise Pre-Work for Session #3: Segmentation, Targeting & Positioning

16
Value Adding Chain Analysis Summary
Understanding the VAC is a foundation for effective marketing Planning: Describes the various levels of the Value Chain in terms of roles, power, critical success factors, values and needs Recognizes value-adding activities throughout Forces attention beyond the transactional customer—all the way to the End User/Consumer, the ultimate determiner of value Assesses how well the Value Chain is working (effectiveness and efficiency) and opportunities for improvement Prompts real consideration of how your business should allocate/focus marketing resources along the VAC to become more influential in selection of products/services used
 and opportunities for improvement. Prompts real consideration of how your business should allocate/focus marketing resources along the VAC to become more influential in selection of products/services used.")
17
Push and Pull Strategies
Pull Strategy: Create demand downstream, thus pulling the offering through the channel with preference/specification Transactional Customer Value Driver Push Strategy: Focus effort on moving product into the VAC through marketing/sales efforts with transactional customers; little attention to what happens after that.sale to Transactional Customer.

18
Push / Pull Strategies Push If Pull If Broad Narrow Low High
Breadth of offering types Differentiation of offering types Complexity of offering Dispersion of customer demand Complexity of customer purchase decision Availability of channels Availability of communication vehicles Positioning appeal Availability of substitutes Push If Pull If Broad Narrow Low High Complex Simple High Low Many Few Few Many Commodity Premium

19
Understand the Market Roadmap
Objectives for this Training Review of Key VAC Concepts Refining Value Chain Process Maps Brainstorming Influence Strategies External Trend Analysis Competitor Analysis Customer Analysis VOC & Market Insights; Data Gathering Techniques for South America Path Forward Exercise Pre-Work for Session #3: Segmentation, Targeting & Positioning

20
Marketplace Trends Marketing Strategy is most effectively developed when external trends are well understood, or anticipated, and used to advantage Significant trends must be planned for and met with a timely, appropriate response Anticipating and responding to trends more effectively than competitors can provide significant competitive advantage

22
Si Usted no piensa en el futuro es porque no quiere tener uno.
Proverbio chino

23
Para talar un árbol hacen falta y 2 horas para afilar el hacha.
10 minutos para cortarlo y 2 horas para afilar el hacha.

24
ESCENARIOS LOS ESCENARIOS SON HERRAMIENTAS PARA ORDENAR
LAS PERCEPCIONES DE LA DIRECCION SOBRE LOS CONTEXTOS FUTUROS ALTERNATIVOS DENTRO DE LOS CUALES LA EMPRESA PODRIA TENER QUE OPERAR Y TOMAR DECISIONES. DENTRO DE CADA ESCENARIO SE MANIFIESTAN Y RELACIONAN LAS TENDENCIAS DEL CONTEXTO DE UNA MANERA DETERMINADA.

25
MATRIZ DE IMPACTOS (I)
")
26
MATRIZ DE IMPACTOS (II)
ACTUACION PLANES INMEDIATA CONTINGENTES IMPACTO MONITOREAR A A B PLANES A B LISTOS MONITOREAR GRADO DE PROBABILIDAD DE OCURRENCIA

27
DETERMINANTES DE LAS VENTAJAS COMPETITIVAS NACIONALES
EL DIAMANTE DETERMINANTES DE LAS VENTAJAS COMPETITIVAS NACIONALES

28
DOTACIÓN DE FACTORES RECURSOS HUMANOS RECURSOS FISICOS
RECURSOS DE CONOCIMIENTO RECURSOS DE CAPITAL INFRAESTRUCTURA

29
JERARQUÍAS ENTRE FACTORES

30
COMPOSICIÓN DE LA DEMANDA INTERNA ESTRUCTURA SEGMENTARIA DE LA DEMANDA
COMPRADORES ENTENDIDOS Y EXIGENTES

31
INFLUENCIAS SOBRE LAS CONDICIONES DE LA DEMANDA INTERNA

32
TAMAÑO Y PAUTAS DE CRECIMIENTO DE LA DEMANDA
TAMAÑO DE LA DEMANDA INTERIOR TEMPRANA DEMANDA INTERIOR TEMPRANA SATURACION

33
SECTORES CONEXOS Y AUXILIARES
EL TERCER DETERMINANTE GENERICO DE LA VENTAJA NACIONAL EN UN SECTOR ES LA PRESENCIA EN LA NACION DE SECTORES PROVEEDORES O SECTORES CONEXOS QUE SEAN INTERNACIONALMENTE COMPETITIVOS

34
INFLUENCIAS SOBRE EL DESARROLLO DE SECTORES CONEXOS Y DE APOYO

35
ESTRATEGIA, ESTRUCTURA
Y RIVALIDAD NATURALEZA DEL SISTEMA COMPETITIVO FORMAS DIRECTIVAS VINCULADAS A UNA ESTRATEGIA COMPETITIVA METAS Y MOTIVACIONES EN LINEA CON LAS FUENTES DE VENTAJAS COMPETITIVAS

36
INFLUENCIAS SOBRE LA RIVALIDAD DOMÉSTICA

37
VENTAJA COMPETITIVA NACIONAL
DETERMINANTES DE LA VENTAJA COMPETITIVA NACIONAL CONCEPTOS GENERALES LAS FUENTES DE LA VENTAJA COMPETITIVA DIFIEREN MUCHO ENTRE LOS SECTORES Y ENTRE LOS SEGMENTOS DE UN SECTOR SE CONSIGUEN Y MANTIENEN LAS VENTAJAS COMPETITIVAS MEDIANTE LA MEJORA, INNOVACION Y PERFECCIONAMIENTO ES NECESARIO CONTAR VENTAJAS EN TODO EL DIAMANTE LA UNIDAD BASICA PARA EL ESTUDIO ES EL SECTOR

38
EL SISTEMA COMPLETO

39
Marketplace Trends Model
Industry External

40
Some Types of Trends Regulatory Cultural Business Management Social
Aesthetic Environmental Customer behavior Preferences & Aversions Purchasing Practices Cultural Social Economic Technological Political Legal

41
LOS 7 ENTORNOS CRÍTICOS

42
Agenda Day 2 Competitive Analysis Review new info from each “expert”
Chart likely competitor moves to thwart Project success Prioritize by “Likelihood” & “Significance” Brainstorm DuPont responses to high-priority competitive moves Customer Analysis Create “Sources of Competitive Advantage” & “Unmet/Poorly met Needs” matrix (3-4 levels of VAC) Brainstorm potential DuPont Value-Add responses Mktg Effort Future State: ID ideal allocation of Mktg effort along VAC Decision: What is Targeted Level for Mktg Planning emphasis? Project Path Forward Exercise: Defining Next Steps Pre-Work for Segmentation Workshop Reflections
 Brainstorm potential DuPont Value-Add responses. Mktg Effort Future State: ID ideal allocation of Mktg effort along VAC. Decision: What is Targeted Level for Mktg Planning emphasis Project Path Forward Exercise: Defining Next Steps. Pre-Work for Segmentation Workshop. Reflections.")
43
Understand the Market Roadmap
Objectives for this Training Review of Key VAC Concepts Data Gathering Techniques for South America Refining Value Chain Process Maps Brainstorming Influence Strategies External Trend Analysis Competitor Analysis Customer Analysis VOC & Market Insights; Data Gathering Techniques for South America Path Forward Exercise Pre-Work for Session #3: Segmentation, Targeting & Positioning

44
Análisis competitivo Tres preguntas básicas:
Quiénes serán mis competidores? Qué están haciendo? Qué harán en el futuro?

45
Análisis competitivo Tres preguntas básicas:
Quiénes serán mis principales competidores? Actuales (obvio) vs Futuro (no obvio) Toolbox: Diamante de Porter y mapas de grupos estratégicos
 vs Futuro (no obvio) Toolbox: Diamante de Porter y mapas de grupos estratégicos.")
46
EL MODELO DE LAS CINCO FUERZAS
(MICHAEL PORTER)
")
47
AMENAZA DE INGRESO Y SALIDA
CARACTERÍSTICAS DE CADA FUERZA COMPETITIVA AMENAZA DE INGRESO Y SALIDA BARRERAS PARA EL INGRESO ECONOMIAS DE ESCALA DIFERENCIACION DE PRODUCTO REQUISITOS DE CAPITAL COSTOS CAMBIANTES ACCESO A LOS CANALES DE DISTRIBUCION POLITICA GUBERNAMENTAL ESTRUCTURA DE PRECIOS BARRERAS PARA LA SALIDA ACTIVOS ESPECIALIZADOS COSTOS FIJOS EN SALIDA INTERRELACIONES ESTRATEGICAS

48
PODER DE NEGOCIACIÓN DE LOS COMPRADORES PODER: CONCENTRADO
INSUMO BASICO COMODITIES PODER DEL COMPRADOR CON SUS CLIENTES AMENAZA INTEGRACIÓN HACIA ATRÁS.

49
PODER DE NEGOCIACIÓN DE LOS PROVEEDORES PODER: CONCENTRADO
IMPORTANCIA RELATIVA DE LA EMPRESA FRENTE AL PROVEEDOR IMPORTANCIA DE INSUMO DEFINICION DE PRODUCTOS AMENAZA DE INTEGRACIÓN HACIA ADELANTE

50
BARRERAS Y RENTABILIDAD

51
Posiciones competitivas de los rivales
Vacío entre la estructura competitiva de la industria como un todo y la posición de cada compañía en la industria por separado: Mapa de los grupos estratégicos Útil cuando hay muchos competidores y no se pueden examinar uno por uno en profundidad Ayuda a comprender mejor la rivalidad competitiva

52
Mapa de los grupos estratégicos
Grupo Estratégico consiste en aquellas compañías rivales que tienen enfoques y posiciones competitivas similares en el mercado Varias similitudes (dentro del mismo grupo): Líneas de productos comparables Integradas verticalmente para el mismo lado Servicios Clientes Atributos de productos Canales de distribución Tecnología Vender en el mismo intervalo precio-calidad
: Líneas de productos comparables. Integradas verticalmente para el mismo. lado. Servicios. Clientes. Atributos de productos. Canales de distribución. Tecnología. Vender en el mismo intervalo precio-calidad.")
53
Mapa de los grupos estratégicos
Construcción: Identificar características competitivas que diferencian a grupos de compañías de otros grupos de compañías: Variables típicas intervalo precios/calidad (alto, medio, bajos), cobertura geográfica (local,nacional, global), integración vertical (inexistente, parcial, total), línea de productos (amplia, estrecha), uso de canales de distribución (uno, algunos, todos), grado de servicio ofrecido (inexistente, limitado, servicio total).
, cobertura geográfica (local,nacional, global), integración vertical (inexistente, parcial, total), línea de productos (amplia, estrecha), uso de canales de distribución (uno, algunos, todos), grado de servicio ofrecido (inexistente, limitado, servicio total).")
54
Mapa de los grupos estratégicos
2) Situar a las compañías en un mapa de 2 variables usando pares de estas características de diferenciación 3) Asignar a las compañías que caen en la misma estrategia dentro del mismo grupo estratégico 4) Dibujar círculos alrededor de cada grupo estratégico, procurando que estos sean proporcionales al tamaño de la participación respectiva de cada grupo en los ingresos totales por ventas en la industria
 Situar a las compañías en un mapa de 2. variables usando pares de estas características. de diferenciación. 3) Asignar a las compañías que caen en la misma. estrategia dentro del mismo grupo estratégico. 4) Dibujar círculos alrededor de cada grupo estratégico, procurando que estos sean proporcionales al tamaño. de la participación respectiva de cada grupo en los. ingresos totales por ventas en la industria.")
55
Cobertura geográfica del mercado
Algunas importadas Alto Cerveceras pequeñas Mayoría importadas Anheuser- Busch Miller Coors Imagen percibida Precio/calidad Medio Stroth´s Heileman Pabst Bajo Resto Local Regional Nacional Cobertura geográfica del mercado

56
MATRIZ de Manthur para Marketing Industrial
Sistema Producto Servicio Comodity Mercadería Soporte Diferenciada Indiferenciada Diferenciado Indiferenciado Fuente: “Competitive Strategies in Industrial Markets”, S.S.Manthur, Journal of General Management, 1985

57
Mapa de los grupos estratégicos
Cuidado!: las variables en los ejes NO deben estar muy correlacionadas Las variables en los ejes deben presentar grandes diferencias en cuanto a su uso por las diferentes empresas. Si se pueden usar más de 2 buenas variables para los ejes es recomendable experimentar con diferentes mapas

58
Análisis de los grupos estratégicos
Con frecuencia las fuerzas motrices y las fuerzas competitivas favorecen a algunos grupos estratégicos y dañan a otros. ¿Posibles movimientos? El potencial de rentabilidad de los distintos grupos estratégicos puede variar debido a los puntos fuertes y débiles en la posición en el mercado de cada grupo (5 fuerzas). Cuanto más cerca estén los grupos estratégicos en el mapa, mayor tiende a ser la rivalidad competitiva entre las compañías miembros (aunque la mayor rivalidad es dentro de un mismo grupo)
. Cuanto más cerca estén los grupos estratégicos en el mapa, mayor tiende a ser la rivalidad competitiva entre las. compañías miembros (aunque la mayor rivalidad es dentro de. un mismo grupo)")
59
Análisis competitivo Tres preguntas básicas:
Quiénes serán mis competidores? Qué están haciendo? Objetivos estratégicos. Posición competitiva actual. Estrategia competitiva. Toolbox: matrices de estrategia.

60
MATRIZ DE OPORTUNIDADES Y AMENAZAS

61
(PRODUCTOS - MERCADOS)
MATRIZ DE DESARROLLO (IGOR ANSOFF) (PRODUCTOS - MERCADOS)
 (PRODUCTOS - MERCADOS)")
62
MATRIZ F.O.D.A. Y MATRIZ DE ANSOFF

63
MATRIZ DEL BOSTON CONSULTING GROUP

64
SECUENCIA EN LA MATRIZ DEL B.C.G.

65
CICLO DE VIDA DEL PRODUCTO Y POSICION COMPETITIVA

66
MATRIZ DE MC KINSEY

67
MATRIZ DE ATRACCIÓN DE MERCADO / POSICIÓN COMPETITIVA
(MC KINSEY)
")
68
MATRIZ DE ATRACCIÓN DE MERCADO / POSICIÓN COMPETITIVA

69
VENTAJAS COMPETITIVAS:
FACTORES ENDOGENOS

70
ATRACCION DEL MERCADO: FACTORES EXOGENOS

71
MATRIZ DE POLÍTICA DIRECCIONAL MPD

72
Análisis competitivo Tres preguntas básicas:
Quiénes serán mis competidores? Qué están haciendo? Qué harán en el futuro? Toolbox: checklists

73
Análisis competitivo: predicción de movimientos futuros.
Lo más difícil. Está cómodo con su posición? Tiene presiones para mejorar rendimientos financieros? Declaraciones públicas? Liderazgo histórico? Información sobre acciones más recientes? Cómo lo impactan las fuerzas externas? Cambios en la tasa de crecimiento de la industria. Cambios en quién compra y en criterios de compra. Cambios tecnológicos. Cambios en costos y eficiencia. Entrada o salida de un competidor importante. Cambios macroeconómicos. Intuición.

74
Competitive Activity in the VAC
First Question: What have your VAC explorations told you about the nature and strength of activity by key competitors at each level of the VAC? Valuable for understanding competitive strategy Valuable for knowing what you’re “up against” in marketing at each level of the VAC

75
Highlight Boxes where Activity is Strong/Effective
Competitive Activity in the VAC (How are decision makers at each level engaged by each competitor?) Level of VAC Transactional Customer M A R K E T Activity at this Level of VAC Key Competitor DuPont Highlight Boxes where Activity is Strong/Effective
 Level of. VAC. Transactional. Customer. M. A. R. K. E. T. Activity at this Level of VAC. Key Competitor. DuPont. Highlight Boxes where Activity is Strong/Effective.")
76
Competitor Analysis Assess each competitor’s: Strategic thrust
Capabilities/limitations Likely outcomes (if they succeed with their strategic thrust) Impact on us Customers/markets on which they focus Recent initiatives to better serve customers
 Impact on us. Customers/markets on which they focus. Recent initiatives to better serve customers.")
77
Strategic Thrust (Which is DP’s strategic thrust?)
Based on observations of competitive activities, what seems to be each company’s strategic thrust in this market? Thought starters: Aggressively invest, grow Maintain Defend at all costs Respond aggressively to competition Harvest or exit Develop Penetrate Gain share on price Exit

78
Competitor Analysis Elements
Capabilities/Limitations Business resolve/commitment Market/Customer focus Offering match Amount of synergy Degree of mobility Access to resources Interface competency eBusiness capability Threats/Opportunities Threats to your business Opportunities for your business Marketplace Behavior Competitor intentions related to: Choices of markets/customers Customer interface approach Resource commitment Interaction with target markets Likely Outcomes Strategic thrust vs. strengths/weaknesses Impact of external forces

79
Competitor Analysis Worksheet
Level of VAC:__________________________ Capabilities & Limitations Likely Outcomes Impact on Us Vol. Competitor Rev Share Prods/Srvcs Strategic Thrusts 1 2 3 4 5 6 7 8 DuPont

80
Competitor Analysis Map
Broad Scope of Customer’s Participation Narrow Commodity Differentiated Type of Offering

81
Additional Competitor Analysis Questions
How satisfied is each competitor with its position? What are their likely moves? What are the implications for the industry and your business? What are they doing to better meet customer needs? Competitive Threats New Entrants? What are the incentives to enter this market? What are the Barriers to Entry? Substitute Products? What can you do to deter new entrants? What competitive moves would have most serious impact on our business? Which competitor is most likely to adopt that strategy?

82
Workshop #5: Competitive Analysis
Objective: Determine how competitive activity or intentions might affect decisions about opportunities to influence VAC and extract value Output: Completed Competitive Analysis Worksheets showing type of competitive activity present at each level of VAC Steps: Fill in key VAC levels at top of Competitive Activity in VAC template provided On left, list companies that provide alternative solutions to DP inputs or services in subject VAC Characterize competitive activities at each level of the VAC Complete the Competitor Analysis Map (you may modify axis titles if others are of greater value) Complete Competitor Analysis Worksheet for 2-3 key levels of VAC, focusing on last 4 columns Consider the “thought expansion” questions RECONVENE AT: Time: 2 Hours
 Complete Competitor Analysis Worksheet for 2-3 key levels of VAC, focusing on last 4 columns. Consider the thought expansion questions. RECONVENE AT: Time: 2 Hours.")
83
Workshop #5: Competitive Analysis
Note: The next four slides provide another look at the worksheets and questions you’ll use in this exercise. They are available full-size in the Participant Workshop Instructions and Templates file you’ve been given, as well as reprinted with your handout.

84
Highlight Boxes where Activity is Strong/Effective
Competitive Marketing Activity in the VAC (How are decision makers at each level engaged by each competitor?) Level of VAC Transactional Customer M A R K E T DuPont Activity at this Level of VAC Key Competitor Highlight Boxes where Activity is Strong/Effective
 Level of. VAC. Transactional. Customer. M. A. R. K. E. T. DuPont. Activity at this Level of VAC. Key Competitor. Highlight Boxes where Activity is Strong/Effective.")
85
Competitor Analysis Worksheet
Level of VAC:__________________________ Capabilities & Limitations Likely Outcomes Impact on Us Vol. Competitor Rev Share Prods/Srvcs Strategic Thrusts 1 2 3 4 5 6 7 8 DuPont

86
Competitor Analysis Map
Broad Scope of Customer’s Participation Narrow Commodity Differentiated Type of Offering

87
Additional Competitor Analysis Questions
How satisfied is each competitor with its position? What are their likely moves? What are the implications for the industry and your business? What are they doing to better meet customer needs? Competitive Threats New Entrants? What are the incentives to enter this market? What are the Barriers to Entry? Substitute Products? What can you do to deter new entrants? What competitive moves would have most serious impact on our business? Which competitor is most likely to adopt that strategy?

88
Understand the Market Roadmap
Objectives for this Training Review of Key VAC Concepts Data Gathering Techniques for South America Refining Value Chain Process Maps Brainstorming Influence Strategies External Trend Analysis Competitor Analysis Customer Analysis VOC & Market Insights; Data Gathering Techniques for South America Path Forward Exercise Pre-Work for Session #3: Segmentation, Targeting & Positioning

89
Anyone along the VAC who comes in
Customer Definition Anyone along the VAC who comes in contact with (and can derive value from) your offering. Who does you business currently define as the customer?
 your offering. Who does you business currently define as the customer")
90
Customer Analysis A thorough understanding of customers, especially their needs and values, is critical to designing a Marketing Mix that will produce competitive advantage Identify and shape the proper offering Present it effectively Price it to extract maximum value Deliver it conveniently

91
Dimensions of Macro Customer Analysis
Critical success factors (CSFs) – Things a business must have/do well in order for their business to prosper Concerns of top management Critical to smooth business operation and meeting their customers’ expectations Think: “What keeps them awake at night?” Example: A reliable source for inputs critical to my operation Needs & values – Things a customer cares deeply enough about to impact buying behavior Often ingrained in corporate culture Think current as well as evolving trends Examples: Safety, Environmental Stewardship, Innovation Sources of Competitive Advantage – How this VAC player attempts to win vs.their competition Example: Innovation, first to market with newest materials
 – Things a business must have/do well in order for their business to prosper. Concerns of top management. Critical to smooth business operation and meeting their customers’ expectations. Think: What keeps them awake at night Example: A reliable source for inputs critical to my operation. Needs & values – Things a customer cares deeply enough about to impact buying behavior. Often ingrained in corporate culture. Think current as well as evolving trends. Examples: Safety, Environmental Stewardship, Innovation. Sources of Competitive Advantage – How this VAC player attempts to win vs.their competition. Example: Innovation, first to market with newest materials.")
92
"HAY SOLO DOS RAZONES POR LAS CUALES UN CLIENTE
ELEGIRA MI PRODUCTO EN LUGAR DEL PRODUCTO DE MI COMPETIDOR: PORQUE ES MAS BARATO O PORQUE ES MEJOR". MICHAEL PORTER COMPETITIVE STRATEGIES MCMILLAN PUBLISHERS CO.

93
LAS TRES ESTRATEGIAS GENÉRICAS

94
CARACTERÍSTICAS DE LAS ESTRATEGIAS COMPETITIVAS GENÉRICAS

95
CARACTERÍSTICAS DE LAS ESTRATEGIAS COMPETITIVAS GENÉRICAS
(Continuación)
")
96
CARACTERÍSTICAS DE LAS ESTRATEGIAS COMPETITIVAS GENÉRICAS
(Continuación)
")
97
ESTRATEGIAS GENÉRICAS

98
ESTRATEGIAS GENÉRICAS
(Continuación)
")
99
ESTRATEGIAS GENÉRICAS
(Continuación)
")
100
ESTRATEGIAS GENÉRICAS

101
DIRECCIONES ESTRATÉGICAS

102
Customer Analysis Worksheet (Capturing What’s Important to Players at key levels of VAC)
Level of VAC M A R K E T Critical Success Factors Values Sources of Competitive Advantage % of DP Focus: Ways to Influence: CSFs = MUST achieve for their business to prosper; VALUES = Things they care deeply about; SOURCES OF COMP. ADVANTAGE = How they WIN vs. competitors

103
Workshop #6: Customer Analysis
Objective: Understand customer needs and buying behavior at 2-4 levels of the VAC Output: Draft Customer Analysis Worksheets for 2-4 levels of VAC Steps: Select 2-4 levels of the VAC that you feel might offer opportunity to influence input decisions Write those VAC functions across the top of the Customer Analysis worksheet. Working on one level of the VAC at a time, use the template to summarize what you know about CSFs, Needs, and Sources of Competitive Advantage from your VAC explorations to date. At each level, take a few moments to note possible ways DuPont could gain leverage on input decision making. Time: 45 Mins

104
Workshop #7: Marketing Effort “Future State” Allocation
Objective: Allocate future marketing efforts along the VAC in accordance with VAC dynamics and opportunities to favorably influence use of DP products and services. Output: A list of VAC functions/players/influencers with corresponding percentages for future marketing emphasis and preliminary thinking about appropriate types of marketing effort. Steps: Insert VAC players/functions in the table provided. Remember not to overlook influencers Allocate 100% of marketing effort (all types) to the various points on the VAC where opportunity to influence exists Begin characterizing the types of marketing effort most suitable for each place where marketing effort has been allocated. Time: 45 Mins
 to the various points on the VAC where opportunity to influence exists. Begin characterizing the types of marketing effort most suitable for each place where marketing effort has been allocated. Time: 45 Mins.")
105
Workshop #7: Marketing Emphasis “Future State”
Types of Mktg Activity % of DP Mktg Effort Current Future Level of VAC

106
Understand the Market Conclusion: Selected Level of VAC for Marketing Emphasis
Project Title: ____________________ Team Leader: __________________ Team Members: _________________________________________________________________________________________________________________________________________________________ Industry / Market ______________________________ LEVEL OF VAC chosen for Mktg Emphasis________________ Three key reasons why this level has been chosen: __________________________________________________ The Bottom Line

107
Understand the Market Roadmap
Objectives for this Training Review of Key VAC Concepts Data Gathering Techniques for Mexico Refining Value Chain Process Maps Brainstorming Influence Strategies External Trend Analysis Competitor Analysis Customer Analysis VOC & Market Insights Path Forward Exercise Pre-Work for Workshop #3: Segmentation, Targeting & Positioning

108
Role of Marketing Research
Provide actionable external insights for decision-making based on real & current data: Identify and define market opportunities Better understand customer needs, perceptions Evaluate impact of Marketing actions on customers along VAC (VOC) Monitor competitive intentions and responses Monitor trends and dynamics of the operating environment Design and conduct controlled market experiments
 Monitor competitive intentions and responses. Monitor trends and dynamics of the operating environment. Design and conduct controlled market experiments.")
109
What can Marketing Research help do?
Understand market needs Understand VAC dynamics; determine sources of power and purchase inluencers; Optimize products based on user needs Test product/offering concepts Test packaging Test promotional concepts Price new offerings Test distribution scenarios Understand or evaluate new markets Determine competitive position, market share, image of competitors, etc. Understand factors affecting purchase Identify changes in market dynamics, such as new players or products Understand reasons for changes in performance of offerings Understand Brand value Assess pricing strategies Generate ideas for new offerings Determine/track marketplace image and awareness Fill in gaps in marketing knowledge Update outdated market knowledge

110
Key Marketing Research Considerations
Identifying the Real Decision Makers – check your assumptions about who makes/influences decisions Selecting Proper Methods – “Cheap” and “Reliable” often don’t coexist. Shop carefully to get research that is both useful/reliable and cost-effective Data Project-ability -- determining and using the right sample size to ensure reliability Effective Decision-Making -- asking the questions that will yield good business decision-making info; know up-front what decisions you intend to make based on the data Proper Methodology Training – Six Sigma teaches us to demand data, but doesn’t make us experts in getting it. Informal VOC is useful, but can be misleading. Consult an experienced researcher!

111
Formalize Your Approach to Gathering Market Information
Market Intelligence Marketing Research Competitive Intelligence Sales Feedback Customer Retention & Complaint Monitoring Internal Databases

112
Know the Difference Market Analysis: Using published information to better understand the marketplace (internal and external sources) Marketing Research: Conducting specific studies to determine the how and why of your approach to the marketplace The skill bases of these two critical activities are different

113
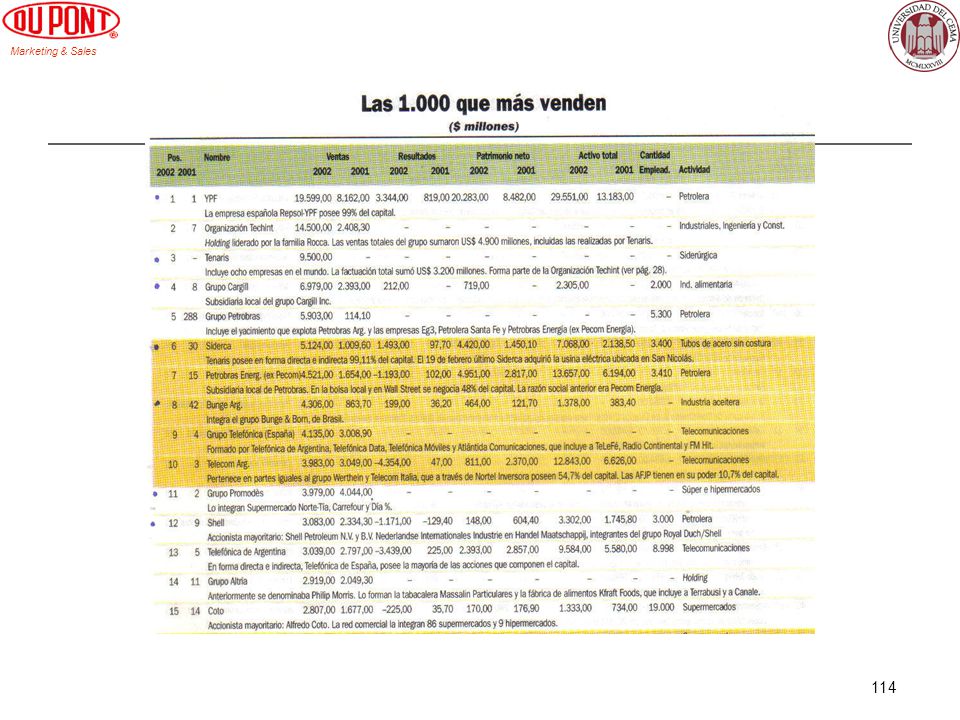
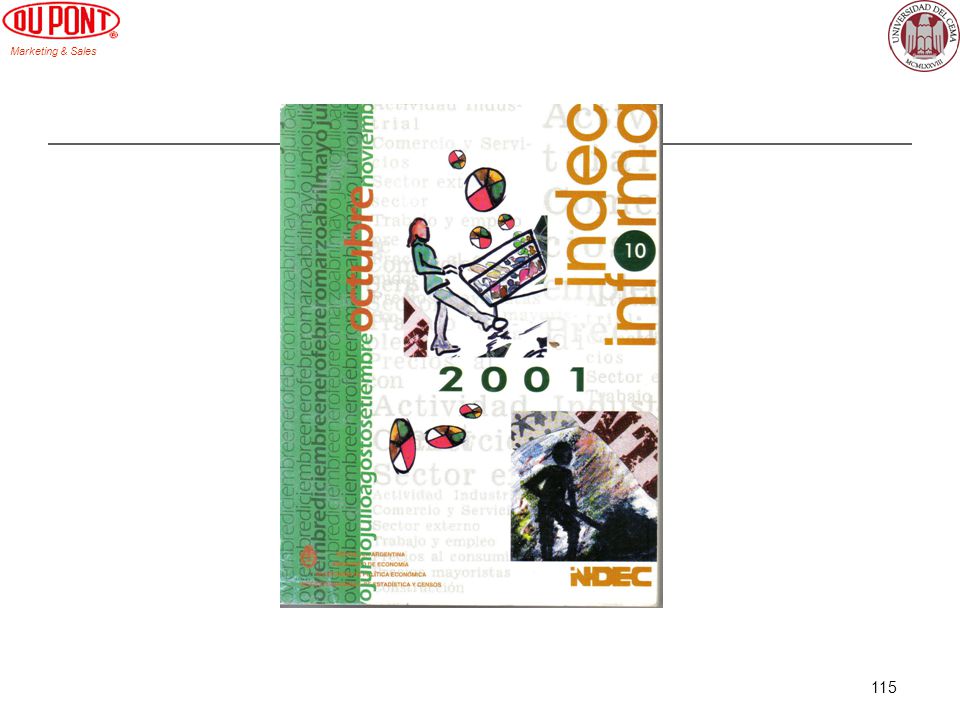
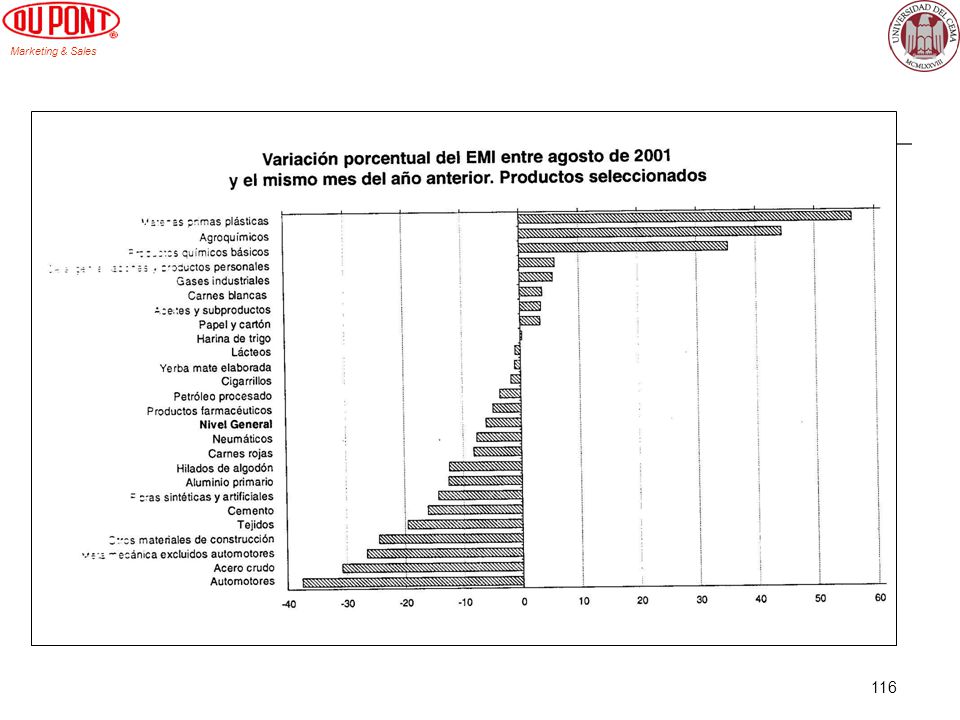
Gathering Marketplace Data in South America
Algunas fuentes útiles: (cadenas de valor y observatorio pymi) (pago) Indec Informa. Ranking 1000 empresas más grandes (Revista Mercado). Cámaras sectoriales. Claves de información competitiva.(pago)
 (pago) Indec Informa. Ranking 1000 empresas más grandes (Revista Mercado). Cámaras sectoriales. Claves de información competitiva.(pago)")
118
DuPont Sources of Marketing Research Advice
In SA MR Global Core Team Corporate & Leader: Pam Brown Color & Coatings: Coleen Pritchett Electronic Comm. Tech: Jane Seeback Safety & Protection: Harwood (Woody) Johnson Nutrition/Crop Proection: Tom Dougherty Performance Mtls: Peter Koller
 Johnson. Nutrition/Crop Proection: Tom Dougherty. Performance Mtls: Peter Koller.")
119
Investigación de Mercados: Tipos

120
Investigación de Mercados: Diseño Invertido.
1. Determinar decisiones claves a realizar. 2. Determinar información necesaria para la toma de decisiones. 3. Preparar informe prototipo y chequear con usuarios. 4. Determinar análisis necesarios para el informe. 5. Determinar preguntas para obtener los datos requeridos en el análisis. 6. Determinar si las preguntas no han sido respondidas previamente. 7. Diseñar la muestra. 8. Implementar la investigación. 9. Analizar los resultados. 10. Escribir el informe.

121
Clasificación de Datos de Investigación de Mercados
Datos Secundarios Datos Primarios Datos Cualitativos Datos Cuantitativos Descriptivos Causales Datos de encuesta Datos de Observación Datos Expe-rimentales

122
Investigación Cualitativa vs Cuantitativa
Obtener un entendimiento cualitativo de las razones y motivaciones implícitas Pequeño número de casos no representativos No estructurada No estadístico Establecer un entendimieto inicial Investigación cuantitativa Cuantificar los datos y generalizar los resultados de la muestra a la población de interés Gran número de casos representativos Estructurada Estadístisco Recomendar un curso final de acción Objetivo Muestra Acopio de datos Análisis de datos Resultado

123
Investigación cualitativa Focus groups y entrevistas en profundidad

124
Características de Focus Groups
Tamaño del Grupo Composición del Grupo Homogéneo, encuestados preseleccionados Entorno físico Relajado, atmósfera informal Duración horas Registro Uso de cintas de audio y video Moderador Habilidad de Observación, interpersonal, y de comunicación del moderador

125
Habilidades fundamentades de los Moderadores
1. Amabilidad con firmeza: El moderador debe combinar una separación diciplinada con empatía con el fin de generar la interacción necesaria. 2. Tolerancia: El moderador debe ser tolerante pero estar alerta a las señales de que la cordialidad del grupo o el propósito se está desintegrando. 3. Compromiso: El moderador debe alentar y estimular el compromiso personal intenso. 4. Entendimiento incompleto: El moderador debe alentar a los encuestados a ser más específicos acerca de comentarios generalizados al mostrar un entendimiento incompleto.

126
Habilidades fundamentades de los Moderadores
5. Aliento: El moderador debe alentar a participar a los miembros que no responden. 6. Flexibilidad: El moderador debe ser capaz de improvisar y alterar el perfil planeado en medio de las distracciones del proceso de grupo. 7. Sensibilidad: El moderador debe ser lo suficientemente sensible para guiar la discusión de grupo a un nivel intelectual así como emocional.

127
Focus Groups Reacciones espontáneas y no estructuradas.
Ventajas Reacciones espontáneas y no estructuradas. Preferencia por comunicación verbal más que por escrita Costos Reducidos Rápida Dinámica grupal estimula ideas

128
Focus Groups Requiere moderador muy bien entrenado
Desventajas Requiere moderador muy bien entrenado Problema de interpretación Pocos grupos no permiten reflejar la diversidad del mercado. Sugiere pero no permite concluir.

129
Temas y preguntas para un focus Group sobre utensillos de cocina
1. Definition of significant classes of the attitude object "What kinds of cookware are there?" 2. Brand awareness "What brands of cookware are you familiar with?" 3. Evaluation of attitude objects "Which brand is best, worst, and why?" 4. Situational contexts/relevant others "How, when and where do you use cookware?" 5. Weights of situational contexts/relevant others "When giving cookware as a gift, what is important?" 6. Evaluation of each attitude object in each situational context/relevant others "Which brands do you prefer as a gift, and why?" Fuente: Lautman, “Focus groups: theory and methods”, Journal of Consumer Research, Jan 1981

130
Temas y preguntas para un focus Group sobre utensillos de cocina
7. Attributes of the attitude object for each situational context a. Physical attributes "Wlien you think about cooking with aluminium pans, what features of the cookware come to mind?" b. Interpersonal "Does anyone in your family care what type of cookware you use?" c. Affective "Do you have any special feelings towards particular pots and pans?" 8. Associations amon^ attributes "If a pot is heavy, will it be more or less likely to have even heat distribution?" 9. Dimensions, levels and range of attributes "When you say you want a heavy pot, what do you mean by 'heavy'?" 10. Threshold of satisfaction . How long does a pot have to last for you to consider it durable?" 11 Beliefs and opinions of brands on attributes, dimensions and threshold of satisfaction "Are Hirro alumium pans durable enough for you to consider buying them?" 12. Latitude of acceptance of beliefs and opinions "Would you believe It if I said that the Teflon'''" coating on a pan will last longer than the pan itself?"

131
Temas y preguntas para un focus Group sobre utensillos de cocina
13. Evaluation of attributes (salience) "For which of these things which you say you want in your next set of cookware would you he willing to pay more?" 14. Determination of values "How would you characterize someone who is a good cook?" 15. Hierarchy of values . "Would you rather be a good eook or have a successful business outside of the hone?" 16. Saliency of relationships between attributes and values . "You say you want a pot with even heat distrihution. What does that affect, your health, your reputation as a cook, or what?" 17. Attribute salience and latitude of acceptance as related to values "How nuch do you think easy cleaning cookware can really affect your lifestyle?" 18. Category importance as related to value system . "How much tine in an average day do you spend with cookware?"
 For which of these things which you say you want in your next set of cookware would you he willing to pay more 14. Determination of values. How would you characterize someone who is a good cook 15. Hierarchy of values. . Would you rather be a good eook or have a successful business outside of the hone 16. Saliency of relationships between attributes and values. . You say you want a pot with even heat distrihution. What does that affect, your health, your reputation as a cook, or what 17. Attribute salience and latitude of acceptance as related to values. How nuch do you think easy cleaning cookware can really affect your lifestyle 18. Category importance as related to value system. . How much tine in an average day do you spend with cookware")
132
Temas y preguntas para un focus Group sobre nuevos productos

133
El estudio clásico de Fern
Estudió el efecto de cuatro factores en un experimento que trató de medir el impacto de dichos factores en la creatividad del grupo Tamaño del grupo 1 vs. 4 vs. 8 Tipo de interacción Nominal vs. Interactivo Control Moderador vs. Entrevistador vs Solos Nivel de conocimiento en el grupo Desconocidos vs conocidos Conclusiones Las entrevistas personales son superiores en Número de ideas. Calidad de ideas.

134
El estudio clásico de Fern

135
Entrevistas en profundidad
Cuándo se usan? TEMAS SENSIBLES Personales - higiene o sexuales Emocionales Influencia social ENTREVISTADOS SON COMPETIDORES

136
Funcionalismo vs. Simbolismo
Laddering Atributos Beneficios Valores

137
Técnica de entrevistas exhaustivas: Escalonamiento (laddering)
En laddering, la linea de preguntas va de las características del producto a las características del ususario. Esta técnica le permite al investigador entrar (y entender?) la red de significados del consumidor. Aviones amplios (caracteristicas del pdto) Puedo trabajar mejor. Puedo completar más cosas Me siento bien conmigo mismo (caracteristicas del usuario) Mensaje comunicacional: Usted se siente bien cuando vuela con nuestra aerolínea, “Usted es el Jefe.”
 la red de significados del consumidor. Aviones amplios (caracteristicas del pdto) Puedo trabajar mejor. Puedo completar más cosas. Me siento bien conmigo mismo (caracteristicas del usuario) Mensaje comunicacional: Usted se siente bien cuando vuela con nuestra aerolínea, Usted es el Jefe.")
138
Técnica de entrevistas exhaustivas : Análisis Simbólico
El Análisis simbólico trata de analizar el significado simbólico de los objetos mediante la comparación con sus opuestos. Los opuestos lógicos de un producto que son investigados son: no uso del producto, atributos de un imaginario no-producto y tipos de productos que se oponen al actual. “Qué pasaría si usted no pudiera usar más aviones?” “Sin aviones, yo tendría que usar cartas y teléfono.” Aerolíneas venden a los gerentes comunicación cara a cara. Mensaje: La aerolínea hará por el gerente lo mismo que Fedex hace por un paquete

139
Tips para entrevistas en profundidad
Si no se utiliza un investigador independiente y se visitan clientes, que la entrevista sea sólo de investigación (no mezclar). Es importante realizar la “venta” de la entrevista al entrevistado: Motivos racionales: compartir información agregada, mejora de servicio/producto. Aclarar que la información será tratada en forma confidencial y agregada. Motivos emocionales: reciprocidad (obsequio), curiosidad. Aclarar que la opinión del entrevistado es muy valiosa. Preferentemente realizar entrevistas personales (cara a cara). En lo posible, dos entrevistadores (para los clientes, una clara indicación que no es una visita de rutina . Dividir roles de moderador y analista). Seleccionar una muestra diversa de entrevistados. (normalmente 3/4 segmentos y 3-6 entrevistas por segmento). Idealmente, realizar una entrevista a la vez por segmento para evitar formación de sesgo. Desarrollar una guía de pautas por escrito antes de la entrevista.(utilizar outline de focus groups como checklist) Ejecución de la entrevista. Rol del moderador: establecer y mantener empatía con el entrevistado, seguir la guia de pautas (ver detalles en slide siguiente). Rol del analista: tomar notas, escuchar entre líneas, identificar áreas para profundizar con más preguntas. Realizar el debriefing de la entrevista en la forma más inmediata posible.
. Es importante realizar la venta de la entrevista al entrevistado: Motivos racionales: compartir información agregada, mejora de servicio/producto. Aclarar que la información será tratada en forma confidencial y agregada. Motivos emocionales: reciprocidad (obsequio), curiosidad. Aclarar que la opinión del entrevistado es muy valiosa. Preferentemente realizar entrevistas personales (cara a cara). En lo posible, dos entrevistadores (para los clientes, una clara indicación que no es una visita de rutina . Dividir roles de moderador y analista). Seleccionar una muestra diversa de entrevistados. (normalmente 3/4 segmentos y 3-6 entrevistas por segmento). Idealmente, realizar una entrevista a la vez por segmento para evitar formación de sesgo. Desarrollar una guía de pautas por escrito antes de la entrevista.(utilizar outline de focus groups como checklist) Ejecución de la entrevista. Rol del moderador: establecer y mantener empatía con el entrevistado, seguir la guia de pautas (ver detalles en slide siguiente). Rol del analista: tomar notas, escuchar entre líneas, identificar áreas para profundizar con más preguntas. Realizar el debriefing de la entrevista en la forma más inmediata posible.")
141
Aspectos Clave de las Técnicas Exploratorias
Técnica Exploratoria Focus Groups Entrevistas en profundidad Observación Entender Aspectos Funcionales de la compra Entender Aspectos Simbólicos de la compra Descripción Precisa De lo que la gente Hace - No de lo que Piensa que hace

142
Investigación Cuantitativa Construcción del Cuestionario

143
Investigación Descriptiva
OBJETIVO Hacer Inferencias sobre la Población PROPOSITOS Estimar el tamaño del mercado Identificar Segmentos de Mercado Diagnóstico Situación Actual (situational analysis) TIPOS Longitudinal - Paneles Cross Sectional - Encuestas
 TIPOS. Longitudinal - Paneles. Cross Sectional - Encuestas.")
144
Tipos de Paneles

145
Marco para la Construcción de Cuestionario
Epecificar qué Información será buscada Identificar al encuestado Correct o Determinar Método de administración Estructura Cuestionario Fraseo preguntas Orden preguntas PRETEST y Revisar Cuestionario

146
Marco para la Construcción de Cuestionario
Epecificar qué Información será buscada Identificar al encuestado Correcto Determinar Método de administración Estructura Cuestionario Fraseo preguntas Orden preguntas PRETEST y Revisar Cuestionario

147
Informantes clave vs. multiples informantes
Investigacion a Consumidor versus Empresas Proceso decisorio & roles Cuáles son los roles? Quién ocupa esos roles? Autonomía de los roles? Consistencia de los roles? ¿Cómo identificar los roles y estructura típica del buying center? Entrevistas exhaustivas via snowballing. Utilizar metodología de informantes clave (vendedores?). ROLES TIPICOS Iniciador Influenciador Decisor Comprador Usuario
. ROLES TIPICOS. Iniciador. Influenciador. Decisor. Comprador. Usuario.")
148
Marco para la Construcción de Cuestionario
Epecificar qué Información será buscada Identificar al encuestado Correct o Determinar Método de administración Estructura Cuestionario Fraseo preguntas Orden preguntas PRETEST y Revisar Cuestionario

149
VENTAJAS Y DESVENTAJAS DE LOS MÉTODOS DE CONTACTO
MALO REGULAR BUENO COSTO TASA DE RESPUESTA EXCELENTE VELOCIDAD DE RECOPILACIÓN CONTROL DE LA MUESTR CONTROL DE LOS EFECTOS DE LOS ENTREVISTADOS CANTIDAD DE DATOS RECOPILADOS FLEXIBILIDAD PERSONAL TELÉFONO CORREO

150
Marco para la Construcción de Cuestionario
Epecificar qué Información será buscada Identificar al encuestado Correct o Determinar Método de administración Estructura Cuestionario Fraseo preguntas Orden preguntas PRETEST y Revisar Cuestionario

151
Estructura de las preguntas
Preguntas abiertas Si usted fuese a comprar un auto nuevo en 2006, qupe marca de auto usted màs probablemente compraria? marca ___________ Preguntas cerradas con respuesta ordenada Si usted fuese a comprar un auto nuevo en 2006, que tan probables serìa que usted comprara las siguientes marcas de autos? Muy probable Algo probable Algo improbable Muy improbable Toyota Honda Nissan Preguntas cerradas con respuesta no ordenada Si usted fuese a comprar un auto nuevo en 2006, cual de los siguientes marcas usted mas probablemente compraria? Toyota o Honda o Nissan o Preguntas parcialmente cerradas Si usted fuese a comprar un auto nuevo en 2006, cual de las siguientes marcas usted mas probablemente compraria? Toyota o Otrar (especificar______________

152
Ventajas y Desventajas de Las preguntas Cerradas vs Abiertas

153
Ejemplo de pregunta Estructurada vs. Abierta
Considerando sus hijos, cuales de los siguientes valores usted siente que son los mas importantes que sus hijos tengan como adultos? (seleccione solo 3) Tres Valores Mas Importantes 1. Cortesia [ ] 2. Exito [ ] 3. Honestidad [ ] 4. Limpieza [ ] 5. Sentido comun [ ] 6. Control [ ] 7. Espiritualidad [ ] 8. Amigabilidad [ ] 9. Obediencia [ ] 10. Responsabilidad [ ] 11. Consideracion [ ] 12. Confianza [ ] 13. Estudiosidad [ ]
 Tres Valores Mas Importantes. 1. Cortesia [ ] 2. Exito [ ] 3. Honestidad [ ] 4. Limpieza [ ] 5. Sentido comun [ ] 6. Control [ ] 7. Espiritualidad [ ] 8. Amigabilidad [ ] 9. Obediencia [ ] 10. Responsabilidad [ ] 11. Consideracion [ ] 12. Confianza [ ] 13. Estudiosidad [ ]")
154
Preguntas Estructuradas: Efecto en las respuestas
Efectos de respuesta por orden Presentación visual de alternativas Efecto de preeminencia Items iniciales establecen un framework cognitivo que guía el procesamiento mental Items iniciales obtienen procesamiento cognitivo más profundo y con menos interferencia Se mimimizan los costos psicológicos al elegir la primera alternativa aceptable SOURCE: Krosnick and Alwin, POQ

155
Preguntas Estructuradas: Efecto en las respuestas
Efectos de respuesta por orden Presentación oral de alternativas Efecto de inmediatez Procesamiento determinado externamente cada alternativa leída termina el procesamiento mental de las alternativas previas más tiempo de procesamiento de las últimas alternativas

156
Ejemplo aplicado Las tres cualidades más importantes
CONTEXTO: Entrevistas personales de 1473 Padres sobre 13 Valores para sus hijos usando tarjetas” Valor STANDARD REVISADO DIFERENCIA CORTESIA % % % ÉXITO % % % HONESTIDAD % % % LOS TRES VALORES MENOS IMPORTANTES NO FUERON AFECTADOS CUANDO HIZO UNA PREGUNTA DE SEGUIMIENTO SOURCE: Krosnick abnd alwin, POQ

157
Reduciendo el Sesgo por orden
Orden de presentación randomizado Entrevista telefonicas con computadora Presencia del efecto a nivel individual Incrementar motivación del encuestado Instrucciones especiales (Por favor lea TODAS las opciones..) Elimina el efecto para los individuos
 Elimina el efecto para los individuos.")
158
Tips sobre el diseño de cuestionarios.
1. Fraseo de preguntas. - Simple y específico. - Evitar hacer dos preguntas en una. - Establecer alternativas. - Establecer períodos de tiempo razonables. - Preguntas de actitud: tienen relación con conducta? 2. Orden de la encuesta: - Identificación sólo si es creíble y no relacionada. - Preguntas “interesantes” primero. - De lo general a lo específico. - Preguntas “difíciles” y demográficas al final. - Rotar las preguntas. 3. Siempre hacer piloto.

159
Investigación Cuantitativa Muestreo: diseño y procedimiento

160
La precisión en las encuestas
A partir de una muestra obtenemos un conjunto de estimaciones. La precisión de las mismas dependerá de diversos factores. Una encuesta producirá mejores resultados si se logran evitar cuatro tipos de errores. Error total de la encuesta Error muestral Error no muestral Error de medición Error de no respuesta Error de cobertura Sistemáticos Aleatorios

161
Clasificación de Técnicas de muestreo
No probabilístico Probabilístico Muestreo por Conveniencia Muestreo por juicio por cuota Muestreo de bola de nieve Muestreo aleatorio simple Otras Técnicas de muestreo Muestreo sistemático Muestreo estratificado Muestreo por agrupamiento

162
Pasos en el muestreo Identificar la población objeto de estudio.
Armar el marco muestral. Formal frame building: se arma la lista a priori. Sequencial frame building: se arma la lista a medida que se realiza la investigación (cuando no existe manera de armar un frame previo). Seleccionar la muestra. Los métodos pueden ser variados y abarcan desde métodos simples a métodos muy sofisticados.
. Seleccionar la muestra. Los métodos pueden ser variados y abarcan desde métodos simples a métodos muy sofisticados.")
163
Pasos en el muestreo El diseño más simple posible es el siguiente:
Existe un marco muestral confiable. El diseño le asigna la misma probabilidad de selección a cada miembro de la población (ejemplo: hogares, individuos, firmas, etc.). Cada miembro de la población al que se le requiere su participación en la encuesta colabora. Entonces, la muestra sería una muestra aleatoria simple, donde cada unidad muestral representa un mismo número de miembros en la población. PRECAUCIÓN: Por el característico sesgo de las distribuciones de clientes industriales, el muestreo aleatorio simple, raramente es eficiente.
. Cada miembro de la población al que se le requiere su participación en la encuesta colabora. Entonces, la muestra sería una muestra aleatoria simple, donde cada unidad muestral representa un mismo número de miembros en la población. PRECAUCIÓN: Por el característico sesgo de las distribuciones de clientes industriales, el muestreo aleatorio simple, raramente es eficiente.")
164
Muestreo Simple Al Azar

165
Muestreo Probabilístico: Muestra aleatoria estratificada
A través de este procedimiento muestral podemos obtener información de: Toda la población Cada estrato La relación entre estratos. Geografía AMBA Interior Tamaño ($) Menos de 20 20-30 31-40 41-50 Industria Bancos AFJPs Soc. Bolsa Ejemplo: sistemas de cotizaciones en tiempo real
 Menos de Industria. Bancos. AFJPs. Soc. Bolsa. Ejemplo: sistemas de cotizaciones en tiempo real.")
166
Muestreo Probabilístico: Muestra aleatoria estratificada

167
Muestreo aleatorio en dos etapas (Clustering sampling)
Una muestra aleatoria en dos etapas es una muestra aleatoria simple de grupos de elementos. Este tipo de muestreo es útil cuando: Es difícil y costoso desarrollar una lista completa de los miembros de la población Los miembros de la población se encuentran ampliamente dispersos geográficamente. Este tipo de muestreo incrementa el error muestral, Ceteris paribus, debido a que probablemente las observaciones en cada cluster no sean independientes.

168
Clustering Primera Etapa

169
Clustering Segunda Etapa

170
Muestreo no Probabilístico
A diferencia del muestreo probabilístico, en el muestreo no probabilístico los elementos de la población no tienen una probabilidad de ser seleccionados. Por lo tanto es IMPOSIBLE calcular el error muestral que puede producirse. No tenemos ninguna posibilidad de decir cuán precisas son las estimaciones muestrales.

171
Muestreo no Probabilístico
Las tres clases más conocidas de muestreo no probabilístico son: Muestreo por conveniencia Muestreo por juicio de experto Muestreo por cuotas

172
Muestreo por Conveniencia
La muestra se selecciona, como el nombre lo indica, por conveniencia de la persona que realiza la investigación. Ejemplos de este tipo de muestreo son: Pedir voluntarios para testear un producto y luego usar esos voluntarios. Entrevistar gente en un shopping para obtener su opinion sobre algun tema en particular. Entrevistas en la calle para un canal de TV.

173
Muestreo por Conveniencia
En cualquiera de estos casos los elementos de la muestra se auto-seleccionan o se seleccionan porque estan fácilmente disponibles. En todos estos casos no está claro de que población se está obteniendo la muestra. Las muestras por conveniencia se utilizan en las primeras etapas de la investigación como base para generar hipótesis de trabajo.

174
Muestreo por Juicio de Experto
La muestra se selecciona de acuerdo a lo que algún experto piensa que son los mejores elementos para responder el objetivo particular de la investigación. Ejemplos de este tipo de muestreo son: Testigos expertos que presentan sus puntos de vista en un juicio. Selección de sucursales de un supermercado donde presentar un nuevo producto. Seleccionar diferentes ciudades donde testear y promocionar un nuevo producto. El snowballing, es un tipo especial de este muestreo donde el experto es el último entrevistado.

175
Muestreo por Juicio de Experto
Como en el caso anterior, el grado y la dirección del error muestral son desconocidos.

176
Muestreo por Cuotas La idea básica en el muestreo por cuotas es ‘reproducir’ en la muestra ciertas características de la población (por ejemplo género, edad etc.) llenando ‘cuotas’ para cada una de esas características. El supuesto detrás de este procedimiento es que si la muestra ‘reproduce’ a la población en estas características, también podría hacerlo en las cantidades que se tratan de medir.
 llenando ‘cuotas’ para cada una de esas características. El supuesto detrás de este procedimiento es que si la muestra ‘reproduce’ a la población en estas características, también podría hacerlo en las cantidades que se tratan de medir.")
177
Muestreo por Cuotas El muestreo por cuotas es parecido al muestreo estratificado. Es diferente porque no obstante los encuestadores estan restringidos por cuotas, utilizan algún elemento de juicio en la elección de la muestra. Como existe un elemento de juicio no podemos determinar la probabilidad de seleccionar una unidad dada de la población.

178
Muestreo por Cuotas A diferencia de los muestreos probabilísticos no hay ninguna distribución de probabilidad que se pueda derivar de los estimadores muestrales. El muestreo por cuotas puede ser apropiado cuando no existe una lista de la población que estamos muestreando.

179
Intervalo de Confianza de 95%
0.475 0.475 XL _ X _ XU _

180
Determinación del tamaño de la muestra de Medias y Proporciones
_ -

181
Tamaño de muestra y subsegmentos
Guidelines 100 Casos por cada segmentos importantes 20-50 Casos por subsegmento Ejemplo Cruce Edad - 5 Grupos Probabilidad de compra - 5 Puntos Likert 5 x 5 = 25 x 100 = Casos efectivos Seymour Sudman, Applied Sampling

182
PRONÓSTICOS DE VENTAS

183
Pronósticos de venta: lo básico, el método de la reacción en cadena
La cuenta simple: Tamaño de la industria (potencial de mercado) x % de mercado tomado por el producto = Venta del producto. Cuando lanzamos nuevos productos en mercados maduros, lo complicado es estimar el % de mercado que tomará el nuevo producto. En productos totalmente nuevos, tenemos que estimar adicionalmente el mercado potencial (mucha mayor complejidad).
 x % de mercado tomado por el producto. = Venta del producto. Cuando lanzamos nuevos productos en mercados maduros, lo complicado es estimar el % de mercado que tomará el nuevo producto. En productos totalmente nuevos, tenemos que estimar adicionalmente el mercado potencial (mucha mayor complejidad).")
184
Pronósticos de venta: lo básico, el método de la reacción en cadena
MEDICIÓN DE MERCADO POTENCIAL TOTAL DEL MERCADO: Número de compradores X cantidad comprada promedio X precio unitario promedio.

185
Pronostico de venta : poniendo todo junto
Ejemplo en cortinas antiruido Población Total 238,000 Fracción en áreas urbanas X Fracción en target de edad X Fracción molesta por el ruido X Tamaño del mercado potencial 38,077

186
Pronósticos de venta: el método de jerarquía de efectos
El modelo Demon de BBDO Presupuesto Publicidad Volumen de Ventas G.R.P.´s Precio Promoción Cobertura y Frecuencia Frecuencia de Uso Conocimiento Prueba Usuarios Distribución

187
Modelo de jerarquía de efectos
Tamaño mercado potencial 38,077 Fracción conoce el pdto .30 Fracción se interesa .30 Fracción con intención de compra .65 2,200 Mercado que probará el pdto

188
Métodos de pronóstico de venta

189
Métodos de pronóstico de venta

190
Métodos estadísticos Modelos Causales
Generalmente utilizados para estimar ventas de productos existentes o la evolución del mercado total (industria/potencial). Modelos Causales Proyección del mercado en base a datos históricos. Buscar la causa del comportamiento de la variable a proyectar relacionándola con variables explicativas. Las variables explicativas son variables independientes, que determinan en consecuencia las variables a proyectar.
. Modelos Causales. Proyección del mercado en base a datos históricos. Buscar la causa del comportamiento de la variable a proyectar relacionándola con variables explicativas. Las variables explicativas son variables independientes, que determinan en consecuencia las variables a proyectar.")
191
Modelo de Regresión Lineal
Es una relación funcional entre dos variables correlacionadas, formando una línea recta y = a+bX y = Variable dependiente X = Período a = Intersección de Y b = Pendiente X, y= Promedio _ _ Ejemplo serial: Vta Coke: f(precio CC, precio vino, precio cerveza, estacionalidad, M1 real) Ejemplo cross-section Vta equipo GNC: f (precio nafta/precio gas, # estaciones GNC, # parque automotor)
 Ejemplo cross-section. Vta equipo GNC: f (precio nafta/precio gas, # estaciones GNC, # parque automotor)")
192
Métodos de pronóstico de venta

193
El Método Delphi Es probablemente la técnica cualitativa que más se utiliza. Este método requiere el establecimiento de un grupo de expertos relacionados con el tema a pronosticar. Este grupo debe ser anónimo.

194
Fases del Método Delphi
Se crea y envía una encuesta a expertos y éstos la devuelven a los coordinadores para su análisis. Se prepara una lista con información derivada del punto anterior y se envía a los expertos Los expertos devuelven las listas y aquellos con opinión diferente deben justificar sus apreciaciones Consolidar los pronósticos donde exista el consenso por parte del grupo de expertos

195
Métodos de pronóstico de venta

196
Concept Test El concept test es una manera de estimar el interes del consumidor en un nuevo producto. Mide (primariamente) Nivel de interés. Comparación en una batería de atributos con la marca habitual del consumidor con marcas competitivas. Intención de compra. Intención de compra a un precio determinado. Mide (secundariamente) Preguntas abiertas “porqué? Atributos mas importantes.
 Nivel de interés. Comparación en una batería de atributos. con la marca habitual del consumidor. con marcas competitivas. Intención de compra. Intención de compra a un precio determinado. Mide (secundariamente) Preguntas abiertas porqué Atributos mas importantes.")
197
Ejecutando un Concept Test
Presentación fáctica presenta el concepto de producto puro. Presentación persuasiva. Con declaración de posicionamiento de producto. Con Story board de la pieza publicitaria que verá el consumidor. Elección de presentación gráfica o verbal depende de cómo el consumidor piensa normalmente en el concepto. Los puntajes no deben ser comparados entre opciones

198
Medidas de intención de compra
Intención de prueba Si-No escala dicotómica generalmente usada Intención de compra Escala de cinco/siete puntos (definitivamente compraría/ definitivamente no compraría) Frecuencia de compra o de cambio de marca. Usar el ciclo de compra de la categoria como el punto medio Escala de cinco/siete puntos.
 Frecuencia de compra o de cambio de marca. Usar el ciclo de compra de la categoria como el punto medio. Escala de cinco/siete puntos.")
199
Usando los datos de Intención de Compra
Hay una alta correlación entre los porcentajes de intención de compra y la “prueba real” en el mercado. Pero las medidas de intención de compra típicamente sobreestiman compra real o “adopción final” y participación de mercado estable. Por qué? Cuál es el problema? Performance real del producto. Acciones competitivas.

200
Usando los datos de Intención de Compra
Reglas prácticas: Conservadora: considerar como compradores solamente el grupo de “definitivamente compraria” - the top box rule. Menos conservadora es el top box + 20% del grupo “probablemente compraría” Recordar que prueba y primera compra no aseguran el éxito de un producto. Para el éxito es necesario lograr la compra habitual. Concept test no predicen la repetición de compras. Para ello es necesario un “product test”

201
Métodos de test de mercado
Pseudo venta (laboratorio) Menos gasto, menor riesgo. Compra “ficticia” Venta controlada (mini markets) El cliente realmente compra Las condiciones de venta estan controladas El producto no esta realmente en el mercado Venta plena (market test) Costo La competencia se entera con seguridad.
 Menos gasto, menor riesgo. Compra ficticia Venta controlada (mini markets) El cliente realmente compra. Las condiciones de venta estan controladas. El producto no esta realmente en el mercado. Venta plena (market test) Costo. La competencia se entera con seguridad.")
202
Pronósticos de venta: conclusiones
La estimación de la venta de un producto nuevo es una tarea extremadamente difícil. Reconociendo esto, nunca hacer una sóla estimación. Tratar de “triangular”, es decir, utilizar el enfoque de los navegantes guiandose por las estrellas:

203
Pronósticos de venta: conclusiones
Estrella 1 Estrella 2 Planeta Probablemente estás por acá Navegación celestial: tomar dos o tres puntos independientes para determinar tu posición.

204
Pronósticos de venta: conclusiones
Múltiples estimaciones de ventas: Estimación subjetiva del grupo emprendedor. Optimista, pesimista y más probable utilizando metodología Delphi. Concept test . Conjoint. Mini mercado de prueba. Recurso gratuito en internet: forecastingprinciples.com Sitio actualizado por el profesor Amstrong (Wharton), autoridad mundial en forecasting. (ver arbol de decisión en próximo slide).
, autoridad mundial en forecasting. (ver arbol de decisión en próximo slide).")
205
Arbol de Decisión para seleccionar el método de pronóstico
No Yes Existen suficientes datos históricos Si Se esperan grandes cambios Policy analysis Hay conflicto entre los decisores clave Tipo de conocimiento Conveniente Evaluar opciones Experto Consumidor Time series Cross-section Type of data Good knowledge of relationships Policy analysis domain knowledge Large changes likely Similar cases exist Métodos de opiniones Métodos estadísticos Several methods provide useful forecasts Combine forecasts Use selected method Delphi/ Prediction markets Judgmental bootstrapping/ Decomposition Conjoint Intenciones/ (concept test) Role playing (Simulated interaction/ Game theory) Structured analogies Expert systems Rule-based forecasting Extrapolation/ Neural nets/ Data mining Causal models/ Segmentation Quantitative Arbol de Decisión para seleccionar el método de pronóstico Accuracy feedback Unaided judgment forecastingprinciples.com JSA-KCG June 2005
 Role playing (Simulated interaction/ Game theory) Structured. analogies. Expert. systems. Rule-based. forecasting. Extrapolation/ Neural nets/ Data mining. Causal. models/ Segmentation. Quantitative. Arbol de Decisión para seleccionar el método de pronóstico. Accuracy. feedback. Unaided. judgment. forecastingprinciples.com. JSA-KCG. June")
206
Understand the Market Roadmap
Objectives for thisTraining Review of Key VAC Concepts Data Gathering Techniques for Mexico Refining Value Chain Process Maps Brainstorming Influence Strategies External Trend Analysis Competitor Analysis Customer Analysis VOC & Market Insights Path Forward Exercise Pre-Work for Workshop #3: Segmentation, Targeting & Positioning

207
Workshop #8: Path Forward to Complete Understand Market
Objective: Leave Session 2 with clear plan for what has to be done to complete Understand the Market module Output: A list of PF items, with responsibilities and completion dates Steps: Complete the Path Forward template, paying special attention to unresolved questions or “need-to-confirm” information from Session 2 Workshops As a Team, determine whether you can confidently select a level of the VAC for special marketing emphasis for your Project to be successful—and make that selection -- If you’re not yet comfortable making this key decision, make specific plans to reconvene the Team when the additional info required will be available. This decision must be made so that customers at the targeted level can be interviewed prior to Session III (Segmentation, Targeting and Positioning) Time: 45 Mins RECONVENE AT:
 Time: 45 Mins. RECONVENE AT:")
208
Path Forward to Complete Understand the Mkt: Industry/VAC: _____________________
Plan & conduct market research (see next template) Person Accountable Deliver To Due By Item for Action
 Person Accountable. Deliver To. Due By. Item for Action.")
209
Marketing Research Issues
Project Title:_______________________________ Person resp. & due date Expected approach to gathering the data Question to be Researched/Decision to be made

210
Understand the Market Conclusion: Selected Level of VAC for Marketing Emphasis
Project Title: ____________________ Team Leader: __________________ Team Members: _________________________________________________________________________________________________________________________________________________________ Industry / Market ______________________________ LEVEL OF VAC chosen for Mktg Emphasis________________ Three key reasons why this level has been chosen: __________________________________________________

211
Understand the Market Roadmap
Objectives for thisTraining Review of Key VAC Concepts Data Gathering Techniques for Mexico Refining Value Chain Process Maps Brainstorming Influence Strategies External Trend Analysis Competitor Analysis Customer Analysis VOC & Market Insights; Techniques for Data Gathering in South America Path Forward Exercise Pre-Work for Training Session #3: Segmentation, Targeting & Positioning

212
Pre-work for Segmentation & Target Workshop
To prepare for the next workshop in the Marketing Competency Development series, your Team must: Arrange and conduct VOC interviews with customers at the selected level(s) of the VAC. At least six companies High share. medium share, low share At least two members of the Buying Center at each company In-person interviews preferred Two Team members per interview Explore relative perceptions of competitive offerings Explore CSFs, needs, values, sources of competitive advantage Summarize the knowledge acquired in these interviews and share with all Project Team members Create a draft (preliminary) of criteria that would make a segment… Attractive for a marketer to pursue One where DuPont can compete effectively Vai prework 3
 of the VAC. At least six companies. High share. medium share, low share. At least two members of the Buying Center at each company. In-person interviews preferred. Two Team members per interview. Explore relative perceptions of competitive offerings. Explore CSFs, needs, values, sources of competitive advantage. Summarize the knowledge acquired in these interviews and share with all Project Team members. Create a draft (preliminary) of criteria that would make a segment… Attractive for a marketer to pursue. One where DuPont can compete effectively. Vai prework 3.")
213
Understand the Market Wrap Up
Can you... Identify and apply business strategy input to guide Marketing & Sales Planning processes? Complete a rigorous Value Chain Analysis, to include VAC process mapping, roles, flows, dynamics, influences? Effectively lead an effort to: --complete an External Trend Analysis using VOC and other marketplace insight data? --complete a rigorous Competitor Analysis using VOC and other marketplace insight data? --complete a macro Customer Analysis using VOC rigor? Demonstrate an appreciation for VOC and other external data for improved decision-making, and the ability to select from a wide range of external data gathering methodologies?

214
…for your attention and participation.
Thank You… …for your attention and participation. It’s time to further develop, test and implement your ideas for capturing added value for DuPont!

Presentaciones similares


 European Transfer Credit System (ECTS) Methodology in.>")


