Descargar la presentación
La descarga está en progreso. Por favor, espere

1
Algunas consecuencias
Tasa de extinción más rápida 65 millones de años (1000x tasa normal) Aumento enfermedades (p.e. asma, malaria) Aumento pobreza y hambre Elevación del nivel del mar Tiempo más extremo Sequías Inundaciones Olas de calor Tormentas Species of land animals are disappearing faster now than any time since the dinosaurs were wiped out 65 million years ago. From polar bears in the Arctic no longer having sea ice for hunting, mating, and migration, to frog in the tropics, we are losing species fast, and humans are almost completely to blame. Increased winds are carrying dust farther, worsening conditions like allergies and asthma, while longer breeding seasons for insects are helping spread insect-borne disease like malaria. 1
 Aumento enfermedades (p.e. asma, malaria) Aumento pobreza y hambre. Elevación del nivel del mar. Tiempo más extremo. Sequías. Inundaciones. Olas de calor. Tormentas. Species of land animals are disappearing faster now than any time since the dinosaurs were wiped out 65 million years ago. From polar bears in the Arctic no longer having sea ice for hunting, mating, and migration, to frog in the tropics, we are losing species fast, and humans are almost completely to blame. Increased winds are carrying dust farther, worsening conditions like allergies and asthma, while longer breeding seasons for insects are helping spread insect-borne disease like malaria. 1.")
2
2

3
3

4
4

5
Explosión de algas 5

6
6

7
Honolulu, Hawaii 1000+ medusas en la playa de Waikiki
Julio 1000+ medusas en la playa de Waikiki 234 personas con picaduras de medusa Hanauma Bay cerrada después de 14 personas picadas en una hora 7

8
Rara medusa gigante ahora común
8

9
Variaciones de temperatura (°C)
Temperatura global registros instrumentales 5 Años más cálidos: 2005 1998 (“El Niño”) 2002 2003 2004 Variaciones de temperatura (°C) con como referencia 9
 Variaciones de temperatura (°C) con como referencia. 9.")
10
Reconstruyendo climas pasados
Sedimentos marinos Anillos de los árboles Documentos históricos Sedimentos de coral Testigos de hielo Otros 10

11
Reconstrucción Temperaturas Superficie
11

12
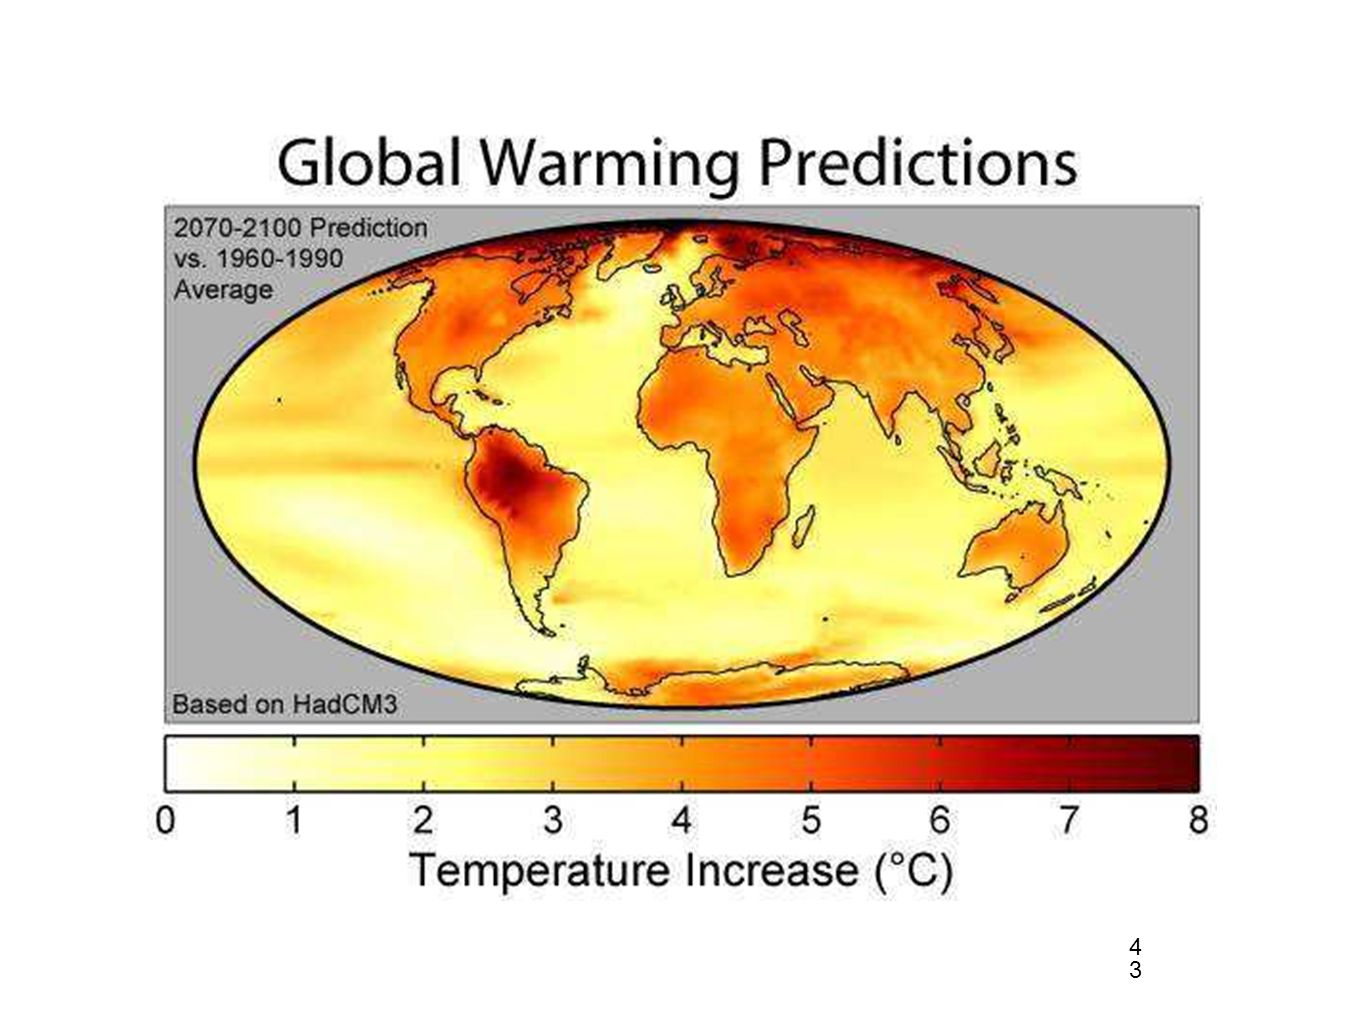
Las mayores incertidumbres actuales en los modelos climáticos son: económicos, avances tenológicos, combustibles alternativos, y la población. Estos factores están incluidos en los diferentes escenarioa de emisiones y tenidos en cuenta en un amplio rango de predicciones. 12

13
GFDL modelo simulación del Calentamiento del aire en superficie (°F)
2xCO2 GFDL modelo simulación del Calentamiento del aire en superficie (°F) El calentamiento medio de la mitad de los continentes en el Hemisferio Norte es 15-25°F 8-14ºC! Un mundo tostado. 4xCO2 13
 El calentamiento medio de la mitad de los continentes en el Hemisferio Norte es 15-25°F 8-14ºC! Un mundo tostado. 4xCO")
14
Señales: el calentamiento global está ocurriendo
Elevación del nivel del mar por expansión termal y hielo fundido Fusión del hielo marino (Ártico y Antártico) Glaciares fundiéndose en todo el mundo Ártico y Península Antártica más rápido Fusión de los hielos terrestres se acelera Climas más extemos (sequías, inundaciones, tormentas, olas de calor, fuertes heladas, etc.) Base de partida: Estos cambios no se dan naturalmente si no añadimos los efectos de los GEIs 14
 Glaciares fundiéndose en todo el mundo. Ártico y Península Antártica más rápido. Fusión de los hielos terrestres se acelera. Climas más extemos (sequías, inundaciones, tormentas, olas de calor, fuertes heladas, etc.) Base de partida: Estos cambios no se dan naturalmente si no añadimos los efectos de los GEIs. 14.")
15
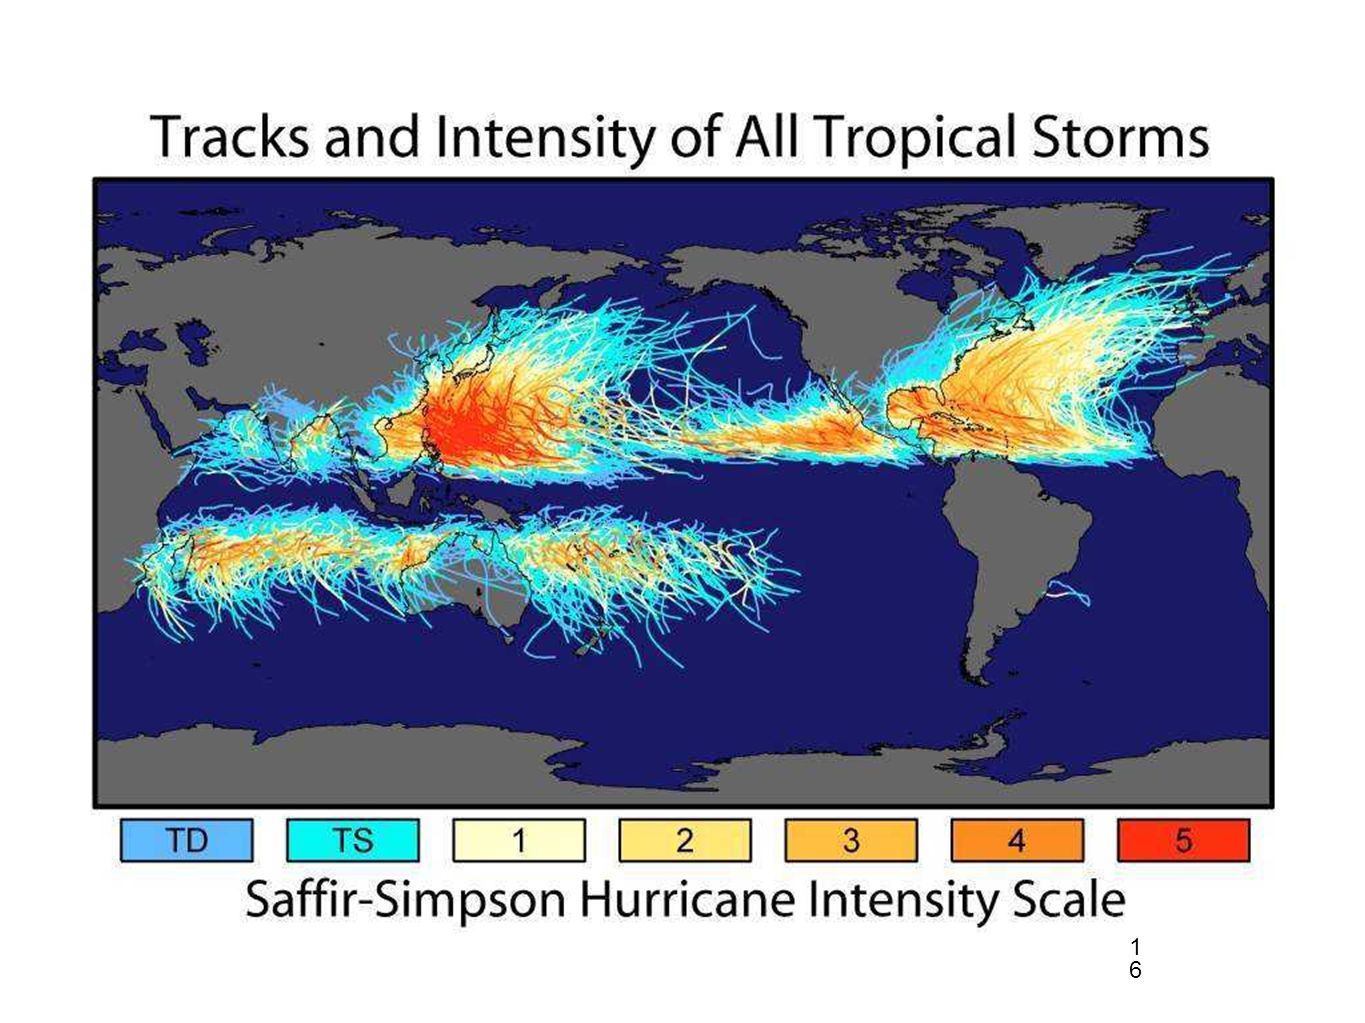
Huracanes 15

16
16 1616
17
I 2004, una de cada cinco viviendas en Florida fue
dañada por un huracán. Not only are tormentas getting more powerful (50% stronger since 1970), but they are getting LONGER (50% longer since 1970). Note the dates of the tormentas! JEANNE – SEPT , 2004 IVAN – SEPT. 2-24, 2004 CHARLEY – AUG. 9-14, 2004 FRANCES – AUG. 25-SEPT. 8, 2004 17
, but they are getting LONGER (50% longer since 1970). Note the dates of the tormentas! JEANNE – SEPT , IVAN – SEPT. 2-24, CHARLEY – AUG. 9-14, FRANCES – AUG. 25-SEPT. 8,")
18
Katrina (28 ag 2005) Rita (21 sep 2005) Wilma (19 oct 2005) 18
 Rita (21 sep 2005) Wilma (19 oct 2005) 18")
19
¿Estamos ante un Ciclo Natural?
algunas scientist have blamed a natural cycle on the increased intensity of tormentas we’ve seen recently. If they are correct, the THC should be very fast right now, drawing warm aguas into the North Atlantic. Instead, we’re finding that the THC is slowing down, probably due to the freshening of the N. Atlantic (calentamiento global!). ¿Estamos ante un Ciclo Natural? Algunos lo atribuyen a la Oscilación Atlántica Multidecadal (AMO) 60-70 años de ciclo (30 rápido, 30 lento) Efectos la velocidad de la Convección Oceánica Rápida = agua cálida hunde más rápido en Atlántico N. Lenta = enfriamiento del agua cálida Calentamiento indefinido? O futura glaciación? Ver video “la verdad incómoda” 19
. ¿Estamos ante un Ciclo Natural Algunos lo atribuyen a la. Oscilación Atlántica Multidecadal (AMO) años de ciclo (30 rápido, 30 lento) Efectos la velocidad de la Convección Oceánica. Rápida = agua cálida hunde más rápido en Atlántico N. Lenta = enfriamiento del agua cálida. Calentamiento indefinido O futura glaciación Ver video la verdad incómoda 19.")
20
Convección Oceánica 20

21
Huracanes are heat engines which pull heat from the ocean to drive the storm. They thrive in warm, moist conditions. 21

22
Knutson, T. K., and R. E. Tuleya, 2004, Journal of Climate.
All computer models agree that with increased concentrations of CO2, the number of strong tormentas increases, but not the overall total. 22 Knutson, T. K., and R. E. Tuleya, 2004, Journal of Climate.

23
Glaciares 23

24
Glaciares y permafrost están retrocediendo
El área de permafrost estacional en HN ha decrecido el 7% entre 1901 y 2002 Retroceso de los glaciares desde lo 1990s 24

25
Kilimanjaro 2000 Images of Kilimanjaro taken from the shuttle in 1993 and in 2000. 1993 25

26
Kilimanjaro 1970 2005 26 2626

27
Nevadas y Fusión, Deposición Sublimación y Desprendimiento Acumulación
Ablación Nevadas y Deposición Fusión, Sublimación y Desprendimiento It is no longer snowing, deposition is small, melting does not occur as temperatures are never above freezing, and calving is not significant. Thus, the Glaciars atop Mt. Kilimanjaro are sublimating, or drying up, due to lack of snow and very dry air. This is not to say that calentamiento global is not occurring; it is, but it is not DIRECTLY causing the snows atop Kilimanjaro to disappear. The fact that Glaciars are vanishing all over the world is evidence enough. Flow of ice 27

28
1978 Qori Kalis Glaciar 2002 (parte del tropical Quelccaya ice cap,
Peru) 28 2828
")
29
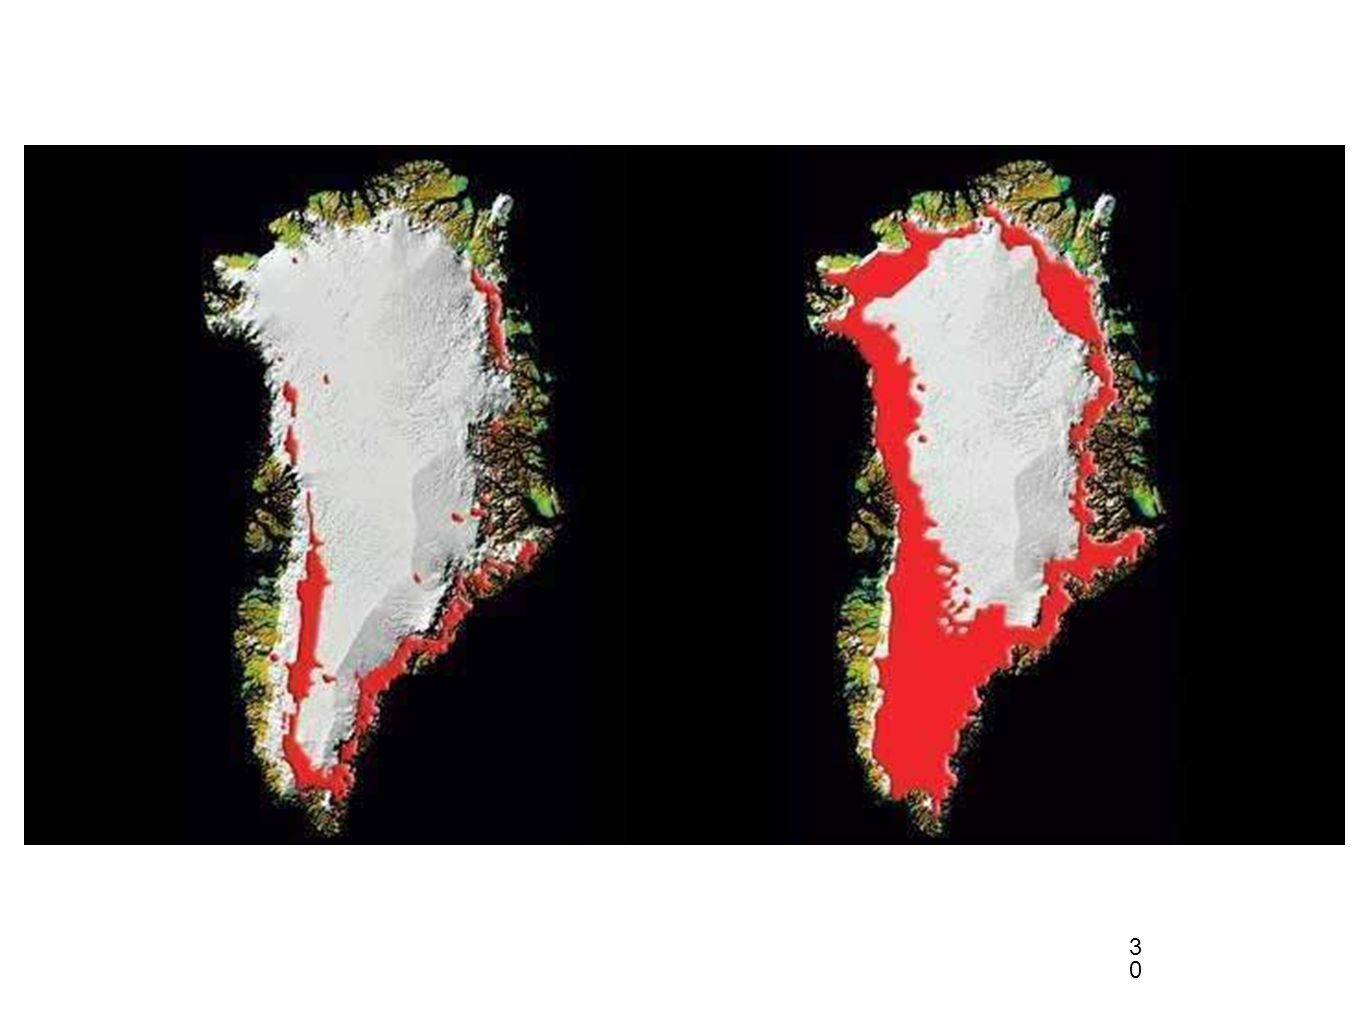
14-Jun-2001 13-Jun-2002 17-Jun-2003 Satellite images reveal a widening melt area in early summer each year. 29

30
Groenlandia imágenes de satélite
1992 2005 30 3030
31
Lubricación en la base 31

32
Elevación del nivel del mar
Expansión térmica Adición de agua Endulzamiento del agua Fusión casquetes polares terrestres Groenlandia: 7.4 m potencial Antártida: 74 m potencial Antártida Ocidental (7 m) Antártida Oriental (67 m) 32
 Antártida Oriental (67 m) 32.")
33
33

34
34

35
Corrientes oceánicas Corrientes oceánicas 35

36
CirculaciónTermohalina (THC)
36

37
37

38
Albedo según los tipos de Nubes
38

39
nubes: la gran incertidumbre
Bajas, gruesas Bloquean las luz solar Enfrían Altas, delgadas Dejan pasar la luz solar Atrapan el calor terrestre Calientan Sobre todo, agua es el GEI más intenso. We still don’t know if nubes will warm or cool the Earth in a warming climate, but agua vapor is the strongest greenhouse gas, so my guess is that nubes will have a net warming. 39

40
40

41
Qué puedes hacer tú? 41

42
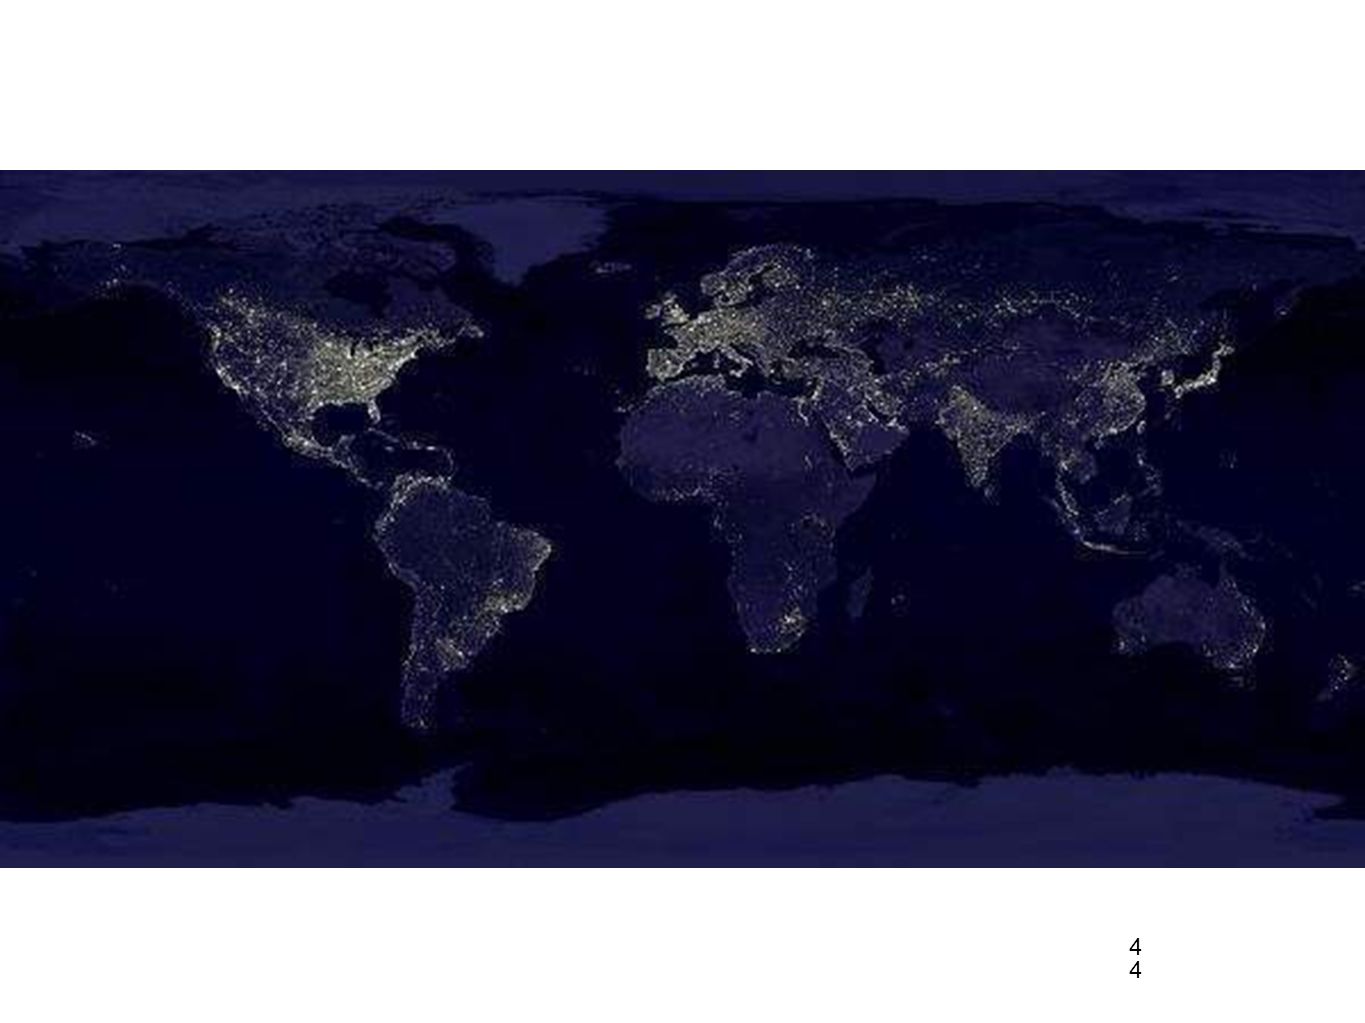
¡ Nuestro voraz apetito de energía no tiene fin – necesitamos cambiar a alternativas limpias !
¿qué debemos hacer? 42

43
43 4343
44
44 4444
Presentaciones similares


