Descargar la presentación
La descarga está en progreso. Por favor, espere

1
Nefropatía crónica del injerto Aspectos clínicos y terapeúticos
Pablo U. Massari Programa de Trasplantes Renales Hospital Privado Centro Médico de Córdoba Carrera de Postgrado en Nefrología Universidad Católica de Córdoba Armenia, Septiembre 2008

2
Supervivencia del injerto y paciente en serie completa
Hospital Privado- Centro Medico de Cordoba Supervivencia del injerto y paciente en serie completa n: 850 PACIENTES 1 ,8 ,6 Supervivencia acumulada Paciente Injerto ,4 ,2 10 20 30 40 50 60 Tiempo (meses)
")
3
Hospital Privado- Centro Medico de Cordoba
Supervivencia del injerto 1 ,8 ,6 Logrank: p= 0.6 Supervivencia Acumulada No DBT DBT ,4 ,2 10 20 30 40 50 60 No DBT DBT Tiempo (meses)
")
4
Long-term Patient and Graft Survival Rates during 3 Eras for Living Donor Transplants
100 Patient 80 80 78 60 58 Graft 57 Percent Survival 40 Era n t 1/2 90-94 95-99 00-04 11,712 18,137 26,543 12.8 15.3 18.6 20 2 4 6 8 10 Years Posttransplant Cecka, Clinical Transplants 2005 (p.3)
")
5
Long-term Patient and Graft Survival Rates during 3 Eras for Standard Criteria Donor Transplants
100 Patient 80 80 78 Graft 60 Percent Survival 46 40 Era n t 1/2 42 90-94 26,614 9.0 20 95-99 27,707 10.3 00-04 29,609 10.9 2 4 6 8 10 Years Posttransplant Cecka, Clinical Transplants 2005 (p.3)
")
6
Late allograft loss Death with functioning graft 40 %
Chronic allograft nephropathy % Recurrence of original disease %

7
Perdida de filtrado glomerular Proteinuria Hipertensión arterial
DISFUNCION TARDIA DEL INJERTO Perdida de filtrado glomerular Proteinuria Hipertensión arterial

8
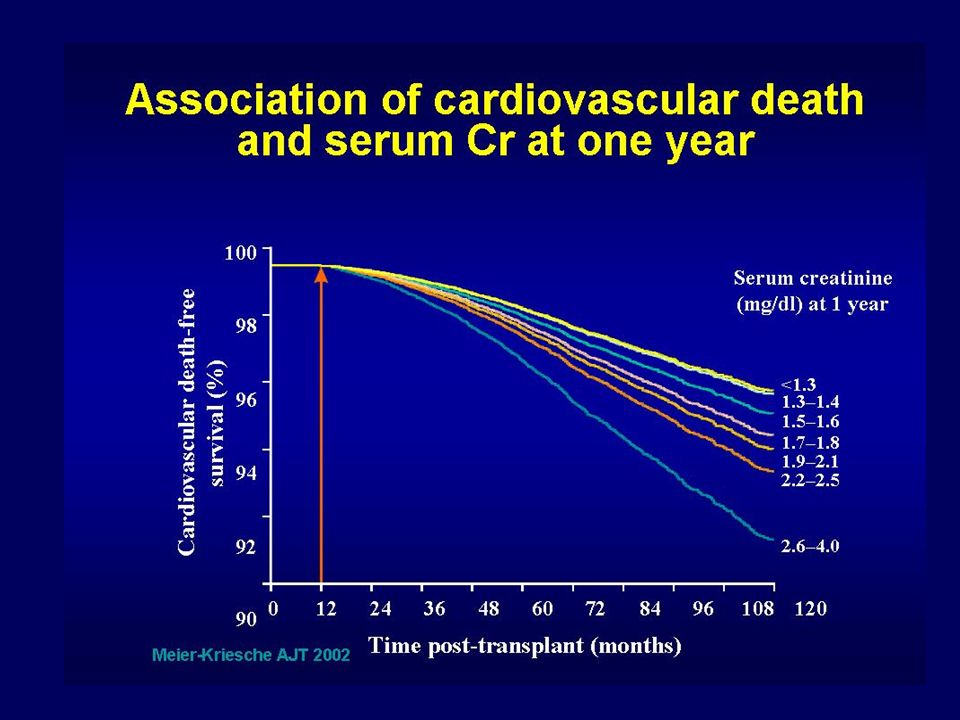
Graft Survival by Serum Creatinine Level at 5 and 10 Years
Years Posttransplant Percent Graft Survival 20 40 60 80 100 2 4 6 8 10 12 14 5 Year 10 Year SCr (mg/dl) Mizutani, Clinical Transplants 2004 (p.346)
 Mizutani, Clinical Transplants 2004 (p.346)")
9
4. Anemia 5. Insuficiencia renal 6. Morbimortalidad CV
DISFUNCION TARDIA DEL INJERTO 4. Anemia 5. Insuficiencia renal 6. Morbimortalidad CV

12
Late allograft loss Death with functioning graft 40 %
Chronic allograft nephropathy % Recurrence of original disease %

13
DISFUNCION TARDIA DEL INJERTO
( + de 3 meses ) Diagnostico diferencial Uropatia obstructiva Estenosis arteria renal Recurrencia enf. glomerular original Microangiopatia-HUS Enfermedad glomerular de novo Nefritis tubulo intersticial cronica Nefroesclerosis Nefropatia cronica del injerto
 Diagnostico diferencial. Uropatia obstructiva. Estenosis arteria renal. Recurrencia enf. glomerular original. Microangiopatia-HUS. Enfermedad glomerular de novo. Nefritis tubulo intersticial cronica. Nefroesclerosis. Nefropatia cronica del injerto.")
14
Nefroesclerosis-senescencia Nefrotoxicidad por drogas
NEFROPATIA CRÓNICA DEL INJERTO Rechazo cronico Nefroesclerosis-senescencia Nefrotoxicidad por drogas

15
100 pacientes Tx renal CsA/TAC + AZA/MMF + esteroides
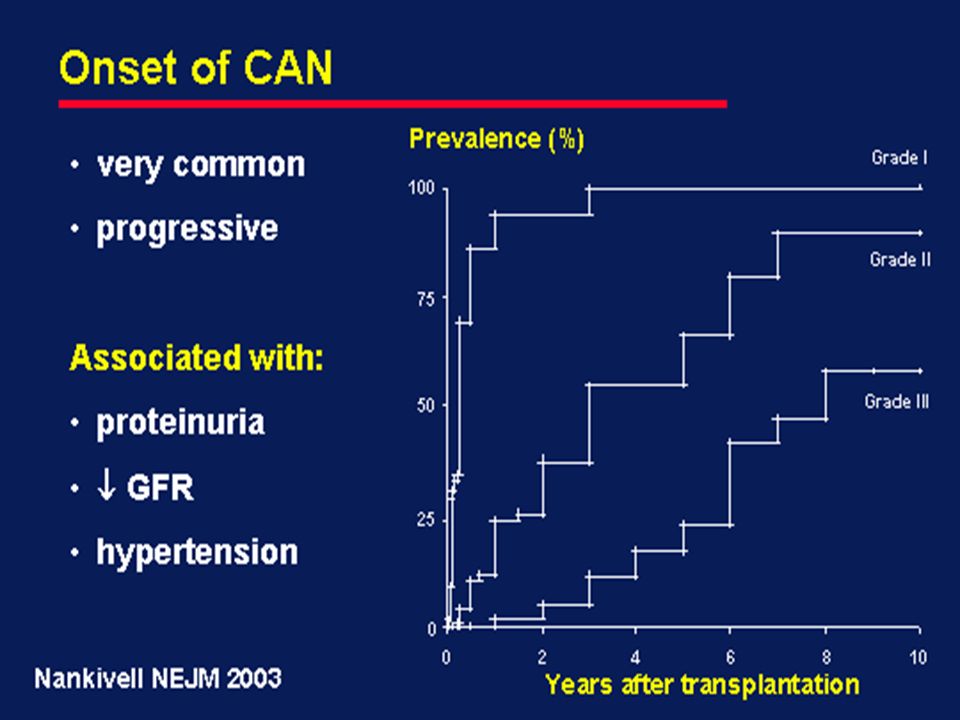
La nefropatía crónica del injerto (CAN) se desarrolla precozmente después del trasplante 100 pacientes Tx renal CsA/TAC + AZA/MMF + esteroides Leve (6–25%) 100 Moderada (26–50%) 75 Severa (>50 %) Pacientes (%) 50 % área cortical afectada 25 2 4 6 8 10 Años postrasplante 1Nankivell BJ et al. N Engl J Med 2003; 349: 2326–33; 2Racusen LC et al. Kidney Int 1999; 55: 713–23.
 se desarrolla precozmente después del trasplante. 100 pacientes Tx renal CsA/TAC + AZA/MMF + esteroides. Leve (6–25%) 100. Moderada (26–50%) 75. Severa (>50 %) Pacientes (%) 50. % área cortical afectada Años postrasplante. 1Nankivell BJ et al. N Engl J Med 2003; 349: 2326–33; 2Racusen LC et al. Kidney Int 1999; 55: 713–23.")
17
years post- transplant
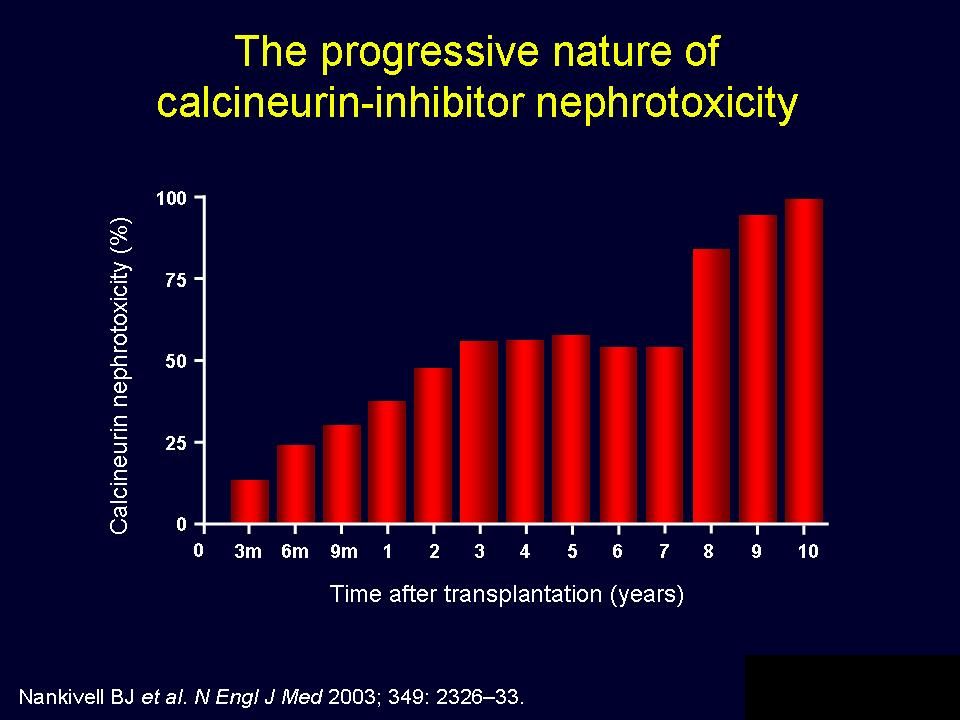
Lower doses of CNI are associated to less nephrotoxicity 7 P< HR: 1.71 6 CsA (mg/kg/día) with CNI toxicity 5 CAN =nefropatía crónica del injerto; HLA = antígeno leucocitario humano; CsA, ciclosporina para microemulsión En un análisis multivariado, se identificó a la nefrotoxicidad por CNI (P < 0.01) como uno de los factores de predicción más significativos de CAN.1 Dosis más bajas de CNI se asocian con menor nefrotoxicidad.2 En el estudio de Nankivell y col (2004) la nefrotoxicidad crónica de la CsA se asoció con dosis más elevadas de CsA durante el estudio cuando se la comparó con los riñones control sin nefrotoxicidad por CsA.2 En este estudio, la nefrotoxicidad crónica por CNI exacerbó la CAN.2 Referencias Solez K et al. Transplantation 1998; 66: 1736–40. Nankivell BJ et al. Transplantation 2004; 78: 557–65. Without CNI toxicity 4 1 2 3 4 5 years post- transplant Nankivell BJ et al. Transplantation 2004; 78: 557–65
 with CNI toxicity. 5. CAN =nefropatía crónica del injerto; HLA = antígeno leucocitario humano; CsA, ciclosporina para microemulsión. En un análisis multivariado, se identificó a la nefrotoxicidad por CNI (P < 0.01) como uno de los factores de predicción más significativos de CAN.1. Dosis más bajas de CNI se asocian con menor nefrotoxicidad.2. En el estudio de Nankivell y col (2004) la nefrotoxicidad crónica de la CsA se asoció con dosis más elevadas de CsA durante el estudio cuando se la comparó con los riñones control sin nefrotoxicidad por CsA.2. En este estudio, la nefrotoxicidad crónica por CNI exacerbó la CAN.2. Referencias. Solez K et al. Transplantation 1998; 66: 1736–40. Nankivell BJ et al. Transplantation 2004; 78: 557–65. Without CNI toxicity years post- transplant. Nankivell BJ et al. Transplantation 2004; 78: 557–65.")
19
The timeline for destruction of a kidney
GRAFT LOSS Tx Glomerular Sclerosis Rising Creatinine Subclinical Rejection/Chronic Humoral Rejection Arteriosclerosis Chronic Donor Disease Acute Donor Disease Arteriolar Hyalinosis CNI Toxicity Interstitial Fibrosis TubularAtrophy AcuteRejection Ischaemia Chapman JR et al. J Am Soc Nephrol 2005; 16: 3015–3026.

20
RISK FACTORS FOR RENAL TRANSPLANTATION
LONG-TERM GRAFT LOSS IN RENAL TRANSPLANTATION P. Arenas, J. Bittar, C. Chiurchiu, J. de la Fuente, W. Douthat, J. de Arteaga, P.U. Massari Renal Transplant Program, Hospital Privado - Centro Médico de Cordoba. Postgraduate School of Nephrology, Catholic University of Cordoba, Argentina

21
INTRODUCTION Despite marked improvements in the short term outcome, chronic survival of kidney grafts has improved modestly. Until now, few data about long term survival and its associated factors are available for Latin American patients with kidney transplant.

22
OBJETIVES To identify factors associated with long-term graft survival (LTGS) -over 8 years- and to determinate the causes of graft loss To compare this data with a control group (CG) matched for time of transplantation.
 matched for time of transplantation.")
23
RESULTS LTGS n:127 CG n: 394 p Age, y 36,8 11,9 39,9 13,9 0,02
Male, % 62,9 62 ns HD time, months 35,3 32,9 37,5 34 Cadaveric % 71,3 DGF, % 69,5 56,6 Pre transplant CVD % 7 15,9 0,01

24
RESULTS LTGS n:127 CG n: 394 p Missmatch (n) 2,3 1,2 2,2 1,2 ns
Induction use (%) 19,7 18,7 Retransplant (%) 10,2 14,2 Acute rejection (%) 36,5 45,9 AR < 6 months (%) 36,1 32,4 AR > 1 year (%) 8,9 6,9
 19,7. 18,7. Retransplant (%) 10,2. 14,2. Acute rejection (%) 36,5. 45,9. AR < 6 months (%) 36,1. 32,4. AR > 1 year (%) 8,9. 6,9.")
25
RESULTS LTGS n:127 CG n: 394 p SCr. 1 year, mg/dl 1,39 0,40
1,70 0,85 0,000 SCr. 5 years, mg/dl 1,39 0,44 1,80 1,20 MDRD 1 year ml/min 59,7 16,5 53,6 23,5 0,01 MDRD 5 year ml/min 60,2 18,7 51,0 22,7 0,001

26
SOBREVIDA DE PACIENTES EN LA POBLACION TOTAL
100 80 Sobrevida acumulada % 60 40 20 TIEMPO EN MESES 25 50 75 100 125 150 175 200 POB. TOTAL TIEMPO MEDIO DE SEGUIMIENTO HASTA LA MUERTE 73,6 ± 57,4

27
SOBREVIDA DEL INJERTO DESPUES DE LOS 8 AÑOS
100 SV PROLONGADA GRUPO CONTROL Log Rank < 0,0001 80 Sobrevida acumulada % 60 40 20 25 50 75 100 125 150 175 200 TIEMPO EN MESES SV PROLONGADA CONTROLES Arenas et al, 2007

28
SOBREVIDA DE PACIENTES EN CADA POBLACION
100 Log Rank < 0,0001 80 60 Log Rank < 0,0001 Sobrevida acumulada % SV PROLONGADA 40 SV injerto en grupo control GRUPO CONTROL 20 SV injerto en SV prolongada TIEMPO EN MESES 25 50 75 100 125 150 175 200 SV PROLONGADA CONTROLES

29
SCr 1 year, mg/dl PreTx Hypertension CAN Post Tx diabetes
Cox Multivariate Analysis for factors associated with graft survival beyond 8 years (RR 1 = survival > 1 year and not reaching 8) SCr 1 year, mg/dl PreTx Hypertension CAN Post Tx diabetes Acute rejection , , ,
 SCr 1 year, mg/dl. PreTx Hypertension. CAN. Post Tx diabetes. Acute rejection. 0 0,5 1,5 2 2,")
30
FACTORES DE RIESGO PARA PÉRDIDA DEL INJERTO EN LA POBLACIÓN TOTAL
Trasplante cadavérico 2,9 (1,21-7,00) Creatinina 1º año mg/dl 2,00 (1,4-2,8) HTA pretx 1,68 (1,19 -1,87) CAN ,77 (1,56 -1,89) Diabetes de novo 1,66 (1,22 - 1,85) , ,5 0, FACTORES DE RIESGO PARA PÉRDIDA DEL INJERTO EN LA POBLACIÓN TOTAL Arenas et al, 2007
 Creatinina 1º año mg/dl 2,00 (1,4-2,8) HTA pretx 1,68 (1,19 -1,87) CAN 1,77 (1,56 -1,89) Diabetes de novo 1,66 (1,22 - 1,85) 0 0,25 0,5 0, FACTORES DE RIESGO PARA PÉRDIDA DEL. INJERTO EN LA POBLACIÓN TOTAL. Arenas et al,")
31
ANALISIS MULTIVARIADO DE COX PARA SOBREVIDA EN LA POBLACION SOBREVIDA PROLONGADA
DEL INJERTO RENAL VARIABLE COEF. RANGO p CAN 1,93 1,68-1,99 0,0009 Arenas et al, 2007

32
CAUSAS DE PERDIDA DEL INJERTO EN EL GRUPO CONTROL Y EN LOS PACIENTES SOBREVIDA PROLONGADA
CONTROLES SV PROLONGADA % p=0,0002 p=0,0004 p=0,008 p=0,01 Arenas et al, 2007 SVP n=26 Controles n=229

33
CAUSAS DE MUERTE EN EL GRUPO CONTROL Y EN LOS PACIENTES CON SOBREVIDA PROLONGADA
%

34
CAUSAS DE MUERTE EN PACIENTES EN EL GRUPO DE SOBREVIDA PROLONGADA

35
Conclussions This series suggest that long term graft survival is not
related to immunological factors and underscore the importance of CAN and post-transplant diabetes in long term outcomes.

36
The Change in Allograft Function among Long-Term Kidney Transplant Recipients Gill et al, JASN 14: 1636, 2003 Analysis of USRDS n: pts ( ) Survival of at least 2 yr Mean eGFR: 49.6 ml/m/1.73 m2 at 6 mo Mean follow-up 5.7 yr 30 % improvement in eGFR 20 % no change in eGFR 50 % had decline of eGFR Mean decline in eGFR: 1.66 ml/m/1.73 m2
 Survival of at least 2 yr. Mean eGFR: 49.6 ml/m/1.73 m2 at 6 mo. Mean follow-up 5.7 yr. 30 % improvement in eGFR. 20 % no change in eGFR. 50 % had decline of eGFR. Mean decline in eGFR: 1.66 ml/m/1.73 m2.")
37
Disease progression and outcomes in chronic kidney diease and renal transplantation Djamali et al, KI 64: 1800, 2003 Retrospective, single center, n:1762 pts ( ), sCr >1.3 mg/dl CKD n: RTR n: 890 Cockcroft-Gault 80 % had K/DOQI Stages 3 and 4 eCrCl declined – 6.6 ml/min/y in CKD eCrCl declined – 1.9 ml/min/y in RTR Similar mortality rate
, sCr >1.3 mg/dl. CKD n: 872 RTR n: 890. Cockcroft-Gault. 80 % had K/DOQI Stages 3 and 4. eCrCl declined – 6.6 ml/min/y in CKD. eCrCl declined – 1.9 ml/min/y in RTR. Similar mortality rate.")
38
Progression and Outcomes in Renal Transplantation
The transplant patients as a high risk group Long-term survival of grafts and patients How to detect progression Proteinuria and outcome Renal function and outcome GFR in transplant patients What to do ?

39
Progression and Outcomes in Renal Transplantation
The transplant patients as a high risk group Long-term survival of grafts and patients How to detect progression Proteinuria and outcome Renal function and outcome GFR in transplant patients What to do ?

40
How to detect progression in RTP ?
Proteinuria sCreatinine and GFR Graft volume Graft biopsy

41
PROTEINURIA IN TRANSPLANT PATIENTS
Early, transient, associated to DGF Acute rejection Recurrence of primary renal disease De novo glomerular disease (HVC) 5. Chronic allograft nephropaty
 5. Chronic allograft nephropaty.")
42
PROTEINURIA IN TRANSPLANT:
PREVALENCE 36.6 % during first 3 monhs Perez Fontan et al, 1999 25 % at 6 months Hohage et al, 1997

43
PREVALENCE OF PROTEINURIA IN CADAVERIC TRASPLANTS, %
Month 12 24 60 n: 225 168 84 Ur. Prot/Creat < 0,5 64,8 68,4 54,7 Ur. Prot/Creat 0,5 – 1,5 26,6 20,2 19,0 Ur. Prot/Creat > 1,5 8,4 11,3 26,2 De la Fuente et al, 2006

44
IMPACT OF PROTEINURIA ON GRAFT SURVIVAL
1 80.1% ,8 ,6 58.0% % sobrevida Proteinuria < 1 gr/ 24 hs ,4 Obs. Events Proteinuria > 1 gr/ 24 hs Prot < 1 gr/ 24 hs 126 6 Logrank p 0,0001 ,2 25 9 Prot > 1 gr/ 24 hs Total 151 15 10 20 30 40 50 60 70 Month post TX 2006

45
PROTEINURIA AND GRAFT SURVIVAL IN CADAVERIC TRANSPLANT
1 n:146 n: 60 n:19 .8 n: 55 n:17 .6 Cum. Survival n: 5 .4 Proteinuria < 0,5 .2 Proteinuria 0,5-1,5 Proteinuria > 1,5 Logrank (Mantel-Cox) p= 20 40 60 80 100 120 Time 2006
 p= Time")
46
THE RISK OF CARDIOVASCULAR DISEASE ASSOCIATED
WIT PROTEINURIA IN RENAL TRANSPLANT PATIENTS Fernandez-Fresnedo et al, Transplantation 73: 1345, 2002

47
How to detect progression in RTP ?
Proteinuria sCreatinine and GFR Graft volume Graft biopsy

48
Renal function in long term graft survival
250 200 150 100 MDRD ml/min 50 years Bittar et al, 2007

49
Estimated GFR to post Cimetidine Creatinine Clearance rate
1,7 1,6 1,5 1,4 1,3 1,2 1,1 1 ,9 2 h Jellife1 MDRD Walser Jellife2 Cockro Nankiv Mawer Mayo Bittat et al, 2007

50
Measured GFR and estimated GFR by different formulas
67,3 70 66,2 63,5 61,6 59,9 60 54,9 55,6 51,6 53,1 50,1 50 40 ml/min/1,73 m2 30 20 10 Iothal 3Hora Jellif1 Walser MDRD Jellif2 Cockro Nankiv Mawer Mayo Bittar et al 2007

51
Progression and Outcomes in Renal Transplantation
The transplant patients as a high risk group Long-term survival of grafts and patients How to detect progression Proteinuria and outcome Renal function and outcome GFR in transplant patients What to do ?

52
Chronic allograft nephropathy
IMMUNOLOGICS NON IMMUNOLOGICS Risk factors DGF Ischemic injury Donor age Hypertensión Hyperlipidemia Diabetes Nefrotoxicity of CNI Acute rejection episodes HLA compatibilities Pre-transplant antibodies CAN CAN =nefropatía crónica del injerto; HLA = antígeno leucocitario humano; CNI = inhibidor de calcineurina En un análisis multivariado, se identificó a la nefrotoxicidad por CNI (P < 0.01) y al rechazo agudo (P = 0.04) como los factores de predicción de la CAN más significativos.1 CAN involucra a factores de riesgo inmunológicos y no inmunológicos que pueden relacionarse con el donante, el receptor o ambos.2,3 La concordancia HLA y la sensibilización previa junto con la función retardada del injerto son particularmente dañinas cuando están combinadas con el rechazo agudo. 2,3 El rechazo agudo produce el aumento en la CAN a los 3 meses postrasplante. 3,4 La nefropatía crónica por CNI, tanto con CsA como con tacrolimus, produce hialinosis arteriolar y fibrosis en capas. Estos fenómenos contribuyen al desarrollo de glomeruloesclerosis.2,5,6 Otros factores no inmunológicos asociados con CAN incluye la edad creciente del donante, la calidad pobre del injerto y la injuria isquémica.2,3,7 Las comorbilidades del trasplante incluyendo hipertensión, hiperlipidemia y diabetes han demostrado que impactan en el desarrollo de la CAN.2,3,8 Referencias Solez K et al. Transplantation 1998; 66: 1736–40. Chapman JR et al. J Am Soc Nephrol 2005; 16: 3015–26. Pascual M et al. New Eng J Med 2002; 346: 580–90. Nankivell BJ et al. New Eng J Med 2003; 349: 2326–33. Nankivell BJ et al. Transplantation 2004; 78: 557–65. Nankivell BJ et al. Transplantation 2004; 78: 461–8. Oppenheimer F et al. Nephrol Dial Transplant 2004; 19: 11–15. Ortiz F et al. J Am Soc Nephrol 2005; 16: 817–24. Creeping creatinine Proteinuria Anemia Hypertension Protocol Graft biopsy
 y al rechazo agudo (P = 0.04) como los factores de predicción de la CAN más significativos.1. CAN involucra a factores de riesgo inmunológicos y no inmunológicos que pueden relacionarse con el donante, el receptor o ambos.2,3. La concordancia HLA y la sensibilización previa junto con la función retardada del injerto son particularmente dañinas cuando están combinadas con el rechazo agudo. 2,3. El rechazo agudo produce el aumento en la CAN a los 3 meses postrasplante. 3,4. La nefropatía crónica por CNI, tanto con CsA como con tacrolimus, produce hialinosis arteriolar y fibrosis en capas. Estos fenómenos contribuyen al desarrollo de glomeruloesclerosis.2,5,6. Otros factores no inmunológicos asociados con CAN incluye la edad creciente del donante, la calidad pobre del injerto y la injuria isquémica.2,3,7. Las comorbilidades del trasplante incluyendo hipertensión, hiperlipidemia y diabetes han demostrado que impactan en el desarrollo de la CAN.2,3,8. Referencias. Solez K et al. Transplantation 1998; 66: 1736–40. Chapman JR et al. J Am Soc Nephrol 2005; 16: 3015–26. Pascual M et al. New Eng J Med 2002; 346: 580–90. Nankivell BJ et al. New Eng J Med 2003; 349: 2326–33. Nankivell BJ et al. Transplantation 2004; 78: 557–65. Nankivell BJ et al. Transplantation 2004; 78: 461–8. Oppenheimer F et al. Nephrol Dial Transplant 2004; 19: 11–15. Ortiz F et al. J Am Soc Nephrol 2005; 16: 817–24. Creeping creatinine. Proteinuria. Anemia. Hypertension. Protocol. Graft biopsy.")
53
NEFROPATIA CRÓNICA DEL INJERTO
Posibilidades de intervención terapeútica Sistemática de controles periódicos Detección precoz Dosaje de creatinina serica y calculo de FG por formulas 4. Medición de FG por método apropiado 5. Determinación de proteina urinaria 6. Biopsia del injerto

54
NEFROPATIA CRÓNICA DEL INJERTO
Posibilidades de intervencion terapeutica Control de factores no inmunológicos Control de hipertensión arterial Hiperlipidemia Evitar nefrotoxicos (AINE) Manejo de la nefrotoxicidad de ICN
 Manejo de la nefrotoxicidad de ICN.")
55
NEFROPATIA CRONICA DEL INJERTO
Posibilidades de intervención terapeútica Factores inmunológicos Inmunosupresión apropiada Utilización de niveles de drogas en sangre Importancia de tiempo sin inmunosupresión o con inmunosupresión reducida 4. Pasaje a inmunosupresión menos nefrotóxica (minimización vs suspensión ICN)
")
56
NEFROPATIA CRONICA DEL TRASPLANTE
Posibilidades de intervención terapeútica Suspensión de anticalcineurínicos Mantener esteroides Antiproliferativos: micofenolato Retirado de ICN Introducción de M-TOR inhibidores (sirolimus-everolimus)
")
58
Estrategias para evitar toxicidad de CNIs
1. Minimización 2. Suspensión 3. No utilización

59
MINIMIZACIÓN . Múltiples protocolos desde época Aza
. Mayor incidencia de RA . Mejoría de función renal . Igual sobrevida del injerto . Mejores resultados con MMF . Poco seguimiento a largo plazo . Malos resultados con imTOR

60
MINIMIZACIÓN: Que hay de nuevo?
Randomized Controlled Study Comparing Reduced CNI Exposure vs Standard CsA- Based mmunosuppression Hernandez et al. Transplantation 84: 706, 2007 Cadavéricos, primarios, bajo riesgo, unicéntrico, n= 240 Prospectivo, aleatorizado, 3 ramas, 80 c/u Rama 1 : Timo + CsA 8 mg/ k + Aza + Pred Rama 2 : Basix + CsA 4 mg/ k + MMF + Pred Rama 3 : Basix + Tac 0.10 mg/ k + MMF + Pred Seguimiento por dos años

61
Hernandez et al. Transplantation 84: 706, 2007 Resultados
Rama Rama Rama 3 DGF, % NFP, % BPAR, % CrCl, ml/ m ( C-G) ± ± ± 27* CrCl, ml/ m (MDRD) ± ± ± 22 SV pte, % Sv Graft, % CMV, % P < 0.05 ( 3 vs 1 )
 58 ± ± ± 27* CrCl, ml/ m (MDRD) 52 ± ± ± 22. SV pte, % Sv Graft, % CMV, % P < 0.05 ( 3 vs 1 )")
62
MINIMIZACIÓN: Que hay de nuevo?
Sirolimus vs CyA Therapy Increases Circulating Regulatory T Cells Does Not Protect Renal Transplant Patients Given Alemtuzumab Induction From Chronic Allograft Injury Ruggenenti P et al. Transplantation 84: 956, 2007 Prospectivo, aleatorizado, abierto, inducción con Alemtz + MMF Pred solo periop. Grupo Sir n= 11, 4 mg/ d, objetivo niveles 5-10 ng / ml Grupo CyA n=10, 4 mg/ kg /d, objetivo niveles º mes, después ng/ml Función renal y biopsia por protocolo a 30 meses Evaluación células T regulatorias circulantes ( CD4+, CD25+, Trg)
")
63
Ruggenenti P et al. Resultados
Grupo Sir Grupo CyA C4d score Chronic index Caída GFR, ml/ m Caída RPF, ml/ m U Protein, g / d CD4+, CD25+, Treg, %, 24 m Conclusión: A pesar de aumentar expresión de Treg SIR, no previno desarrollo de evidencias histológicas y funcionales de CAN

64
Cyclosporine Sparing with Mycophenolate Mofetil, Daclizumab and Corticosteroids in Renal Allograft. Recipients: The CAESAR Study. Ekberg et al: AJT, Estudio CAESAR Prospectivo, aleatorizado,controlado, multicéntrico - Bajo a moderado riesgo inm, primarios - 3 ramas: rama 1: retirada de ciclosporina gradual a 6 m n = 179 rama 2: ciclosporina baja dosis n = 184 rama 3: ciclosporina clásica y continuada n = 173 Las 3 con DACLZ, MMF Y ESTEROIDES

65
Exberg et al. Resultados a 1 año
rama 1 rama 2 rama 3 DGF, % BPAR, % * GFR, ml/m SVPTE, % SVGRAFT N/NC, % SVGRAFT SN, % * P< 0.05

66
Estrategias para evitar toxicidad de CNIs
1. Minimización 2. Suspensión 3. No utilización

73
Change from baseline in creatinine clearenca after conversion
to sirolimus in randomized controlled trials : results of a meta-analysis Bodziak et al. COOT 2007 Mullay et al. Transplant 2006 Study n n conversion control Baboolal (2004) Watson (2005) Stallone Oberbauer (2006) Pooled random effect estimate
 Watson (2005) Stallone Oberbauer (2006) Pooled random effect. estimate")
74
Short Term Renal Function in Renal Transplant
Patients Converted to mTOR inhibitors An Argentinean Single Center Experience C Chiurchiu, J Bittar, D Stoppa, P Arenas, J de la Fuente, J de Arteaga, W Douthat, PU Massari Servicio de Nefrología y Programa de Trasplantes Renales Hospital Privado Centro Médico de Córdoba & Escuela de Posgrado en Nefrología Universidad Católica de Córdoba, Córdoba, Argentina

75
Primary Secondary Objectives
To investigate the effects on renal function of conversion from CNIs to mTORs in long standing renal transplant patients with biopsy proven CAN Secondary To study graft and patient survival after conversion To investigate changes in proteinuria after mTORs introduction

76
Material & Methods Sixty-four consecutive Renal Transplant Recipients previously treated with CNIs without recent history of acute rejection were included After biopsy proven CAN, 37 patients were converted to sirolimus and 27 to everolimus Renal function and proteinuria were registered six months before, at the time of conversion and during the follow-up (mean: 11 months, range: 1-53) Antihypertensive and renoprotective therapies were used as needed For the analysis of graft survival patients were divided in two groups according to the median of serum creatinine and proteinuria at time of conversion
 Antihypertensive and renoprotective therapies were used as needed. For the analysis of graft survival patients were divided in two groups. according to the median of serum creatinine and proteinuria at time. of conversion.")
77
Characteristics of patients at conversion
Age (years) 41.6 ± 16.9 Male gender (%) 62.5 Cadaveric donors (%) 60.9 Time at Trasplantation (months) 65 ± 49 Serum Creatinine (mg/dl) 2.4 ± 0.8 Urinary Protein Creatinine Ratio (g/d) 1.3 ± 2.0 Immunossupression (%) CSA-AZA-STD 57.6 CSA-MMF-STD 30.7 TAC-MMF-STD 6.9 Other 4.8
 41.6 ± Male gender (%) Cadaveric donors (%) Time at Trasplantation (months) 65 ± 49. Serum Creatinine (mg/dl) 2.4 ± 0.8. Urinary Protein Creatinine Ratio (g/d) 1.3 ± 2.0. Immunossupression (%) CSA-AZA-STD CSA-MMF-STD TAC-MMF-STD Other")
78
Glomerular Filtration Rate according MDRD (ml/min))
Changes in Renal Function after Conversion p:<0.006 p: n.s. p: n.s p: n.s. 3.00 70 2.50 50 2.4 ± 0.8 2.00 2.3 ± 0.8 2.1 ± 0.7 40 42.9 ± 19.9 38.3 ± 19.4 38.6 ±20.8 1.50 30 Serum Creatinine (mg/dl) Glomerular Filtration Rate according MDRD (ml/min)) 1.00 20 0.50 10 0.00 6 Months Pre At conversion 6 Months Post 6 Months Pre At conversion 6 Months Post 6 Months Pre to Conversion Conversion to 6 Months Post -1 Δ GFR (ml/min) -2 -3 -4 -5 -6 -7
 Glomerular Filtration Rate. according MDRD (ml/min)) Months. Pre. At. conversion. 6 Months. Post. 6 Months. Pre. At. conversion. 6 Months. Post. 6 Months Pre to. Conversion. Conversion to. 6 Months Post. -1. Δ GFR. (ml/min)")
79
According to the median of creatinine at conversion
Graft Survival after conversion Whole Group According to the median of creatinine at conversion 100 100 80 80 p < 0.002 60 60 Cumulative Survival 40 40 S.Creat. < 2.3 mg/dl S. Creat. >2.3 mg/dl 20 20 No deaths occurred during the follow-up 2 4 6 8 10 12 2 4 6 8 10 12 Months Months

80
Evolution of Proteinuria Levels Role on Graft Survival
According to the median of proteinuria at conversion 2,0 100 1,8 1,6 80 p = 0.3 1,4 60 Proteinuria (P/C Ratio) Cumulative Survival 1,2 1,0 40 P/C Ratio < 0.64 P/C Ratio > 0.64 0,8 20 0,6 0,4 P/C Ratio 6 Months Pre P/C Ratio At conversion P/C Ratio 6 Months Post 2 4 6 8 10 12 Months
 Cumulative Survival. 1,2. 1, P/C Ratio < P/C Ratio > , ,6. 0,4. P/C Ratio. 6 Months Pre. P/C Ratio. At conversion. P/C Ratio. 6 Months Post Months.")
81
Efectos secundarios de los PSI/mTORi post- conversión
Neumonitis Infecciones cutaneas Anemia, > 1g Hg Diarrea Motivo DC temporaria Motivo DC definitivo

82
Sirolimus- everolimus en conversión por CAN
Mejoría de función renal Estabilización daño histológico Efecto antineoplásico Mejor perfil cardiovascular Efecto antiviral ?

83
Sirolimus- Everolimus
Problemas No exentos nefrotoxicidad Anemia Infecciones bacterianas piel, GI Neumonitis Edemas

84
Change from baseline in creatinine clearenca after conversion
to sirolimus in randomized controlled trials : results of a meta-analysis Bodziak et al. COOT 2007 Mullay et al. Transplant 2006 Study n n conversion control Baboolal (2004) Watson (2005) Stallone Oberbauer (2006) Pooled random effect estimate
 Watson (2005) Stallone Oberbauer (2006) Pooled random effect. estimate")
87
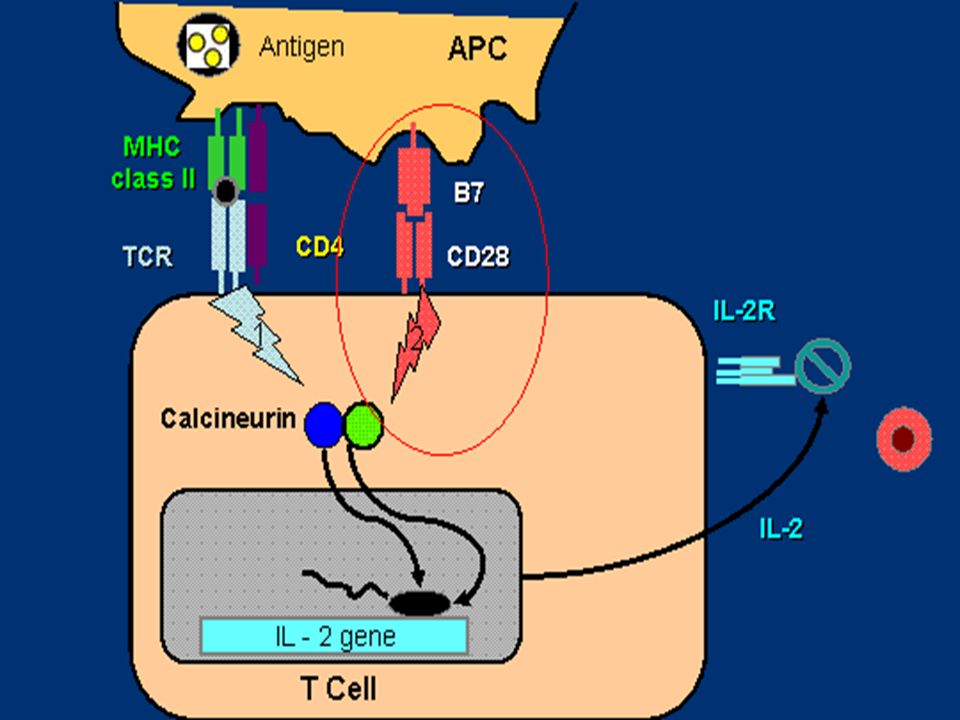
Inmunosupresión en trasplante renal Mantenimiento
Belatacept Bloqueo señal co-estimulación Parenteral Efectos prolongados No nefrotóxico, no mielotóxico En proceso confirmar eficacia y seguridad

88
Vincenti et al,NEJM 2005

89
Vincenti et al NEJM 2005

90
Median follow-up time: 48 months
Interim Report of Phase 2 Long-Term Safety of Belatacept Charpentier B et al, ATC 2007 Rate/100 pt/yr (95% CI) Belatacept n: Cyclosporine n:26 Infections ( ) ( ) Neoplasms ( ) ( ) Acute rejection ( ) ( ) Cardiovascular ( ) ( ) Median follow-up time: 48 months
 Belatacept n:102 Cyclosporine n:26. Infections 4.2 ( ) 8.9 ( ) Neoplasms 2.6 ( ) 2.5 ( ) Acute rejection 3.2 ( ) 2.5 ( ) Cardiovascular 0.3 ( ) 3.8 ( ) Median follow-up time: 48 months.")
91
Mortality One Log order of improvement needed
Two Log orders of improvement needed

Presentaciones similares